Article Text

Abstract
Objective Two recent important lupus nephritis trials reported that proteinuria was a good predictor of renal outcome in Caucasians, but data on real-life situation, other races and severe nephritis are lacking to substantiate this finding as a simple test to guide clinical practice. The aim of this study was to validate proteinuria as a predictor of long-term renal outcome in real-life situation in a racially diverse group of patients with severe nephritis.
Methods Proteinuria, serum creatinine (SCr) and urine red blood cells were assessed at baseline and after 3, 6 and 12 months, as early predictors of long-term renal outcome (SCr <1.5 mg/dL at 7 years), in 94 patients with biopsy-proven lupus nephritis. The parameter performance and cut-off values were computed by receiver operating characteristic curves. Kaplan-Meier curves were used to validate the parameter.
Results A proteinuria <0.8 g/24 hours at 12 months was the best single predictor of long-term renal outcome (sensitivity 90%, specificity 78%, positive predictive value 67%, negative predictive value (NPV) 94% and area under the curve 0.86; p<0.001). Addition of other variables to proteinuria such as SCr and haematuria at 12 months did not improve its performance. The proteinuria cut-off value of 0.8 g/24 hours at 12 months was a good predictor of 7-year renal survival (years free of dialysis) for patients with pure membranous (p=0.005) and proliferative nephritis (p=0.043), as well as black (p=0.002) and white race (p=0.001), anti-dsDNA positive (p=0.001) and anti-dsDNA negative (p=0.04) and male (p=0.028) and female (p=0.003) patients.
Conclusion We provided novel evidence that, in a real-life situation, proteinuria at 12 months of follow-up was the single best predictor of renal outcome at 7 years for an ethnically diverse group of patients with severe nephritis and a valid parameter for distinct histological classes, races, genders and anti-dsDNA profiles. The remarkably high NPV obtained reinforces its recommendation as the ideal predictor for clinical practice, since it is of low cost, easy to interpret, non-invasive and widely available.
- Lupus Nephritis
- Systemic Lupus Erythematosus
- Outcome research
- Proteinuria
This is an Open Access article distributed in accordance with the Creative Commons Attribution Non Commercial (CC BY-NC 4.0) license, which permits others to distribute, remix, adapt, build upon this work non-commercially, and license their derivative works on different terms, provided the original work is properly cited and the use is non-commercial. See: http://creativecommons.org/licenses/by-nc/4.0/
Statistics from Altmetric.com
Introduction
Treat to target (T2T) strategies are becoming the best approach to treat several rheumatic disorders. The T2T concept has been widely used in the treatment of chronic disorders (such as hypertension, diabetes and cardiovascular disease) for many years, and the achievement of accurate therapeutic targets has led to significant good long-term prognoses.1 Adhering to this strategy in clinical practice optimises the outcomes and facilitates the routine follow-up, particularly when targets are as simple as possible.
Considering that lupus nephritis (LN) is a critical condition that can lead to renal impairment, a clear measurable short-term target is desirable. The current American College of Rheumatology (ACR) and European League Against Rheumatism criteria for the partial and complete responses of LN, assessed at 6–12 months, employ a composite measure of creatinine, urinary sediments and proteinuria (PTU).2 3 Both criteria consider the same variables but with different thresholds and relative endpoints (percentages of the initial variable). The use of multiple variables associated with relative endpoints hampers T2T strategies, since there is no clear target to be pursued. There are several other LN response criteria, but all of them hold the same problems.4–6
In the last few years, several LN trials have used short-term measures of renal response to create their own definitions of complete and partial responses.7–10 In 2015, Corapi et al 11 critically reviewed and compared all LN response criteria and endpoints used in LN trials. This article emphasised that there was a need to standardise the definitions of LN response as well as LN trial endpoints.11
Until recently, no simple test could predict renal outcome and guide treatment in LN. Recently, two analyses of important lupus trials, the MAINTAIN Nephritis trial and the Euro-Lupus Nephritis Trial (ELNT), have reported that PTU is the single best predictor of long-term (7 years) renal outcome in lupus patients,12 13 suggesting a possible use of the T2T approach for PTU to prevent renal damage. Both studies assessed the capacity of serum creatinine (SCr) concentration, 24-hour PTU and urinary red blood cell (RBC) counts at several time points to predict long-term renal outcome and concluded that PTU level at the 12-month follow-up was the best measure. The association of SCr or RBC to PTU undermined the predictive power of the model for both studies.12 13
The MAINTAIN Nephritis trial analysis concluded that a PTU <0.7 g/day at 12 months was the best predictor of good long-term renal outcome with a sensitivity of 71%, a specificity of 75%, a positive predictive value (PPV) of 94% and a negative predictive value (NPV) of 29%.13 The ELNT identified a PTU cut-off of 0.8 g/day at 12 months with a sensitivity of 81%, a specificity of 78%, a PPV of 88% and an NPV of 67%.12 According to these two analyses, an early PTU response (assessed at 12 months) seemed to be the best target to focus on in patients with LN.
The generalisation of these results is limited by the fact that the majority of patients were Caucasian with mild/moderate renal involvement at entry in both cohorts.12 13 In addition, adherence to intervention protocols is much higher in clinical trials than in non-research settings.14 Moreover, there is a lack of data regarding the relevance of the proposed PTU predictor in patients of distinct histological classes, races, genders and anti-dsDNA profiles. Therefore, the purpose of this study was to determine, in a real-life situation, if PTU was indeed a good predictor of renal outcome in patients with severe LN in a geographical region with more racial diversity.
Methods
Patient selection and study design
A total of 107 biopsy-proven LN patients with at least 7 years of available longitudinal follow-up data at the rheumatology division of a tertiary university hospital were consecutively selected for this study. Since histological class and severity of LN cannot be predicted by the clinical features, all enrolled patients had biopsy-proven LN and met ACR criteria for the diagnosis of SLE.15 Data were obtained at intervals of 1–3 months using a standardised electronic database protocol that included data on demographics, clinical and laboratory findings, and treatments. In all, 13 patients were excluded, seven due to missing relevant data and six due to the development of early end-stage renal disease (ESRD) that required dialysis in the first year after the nephritis episode. Patients who were diagnosed with ESRD at any time after the first year of follow-up were included. On the whole, 94 patients with biopsy-proven LN were enrolled.
This is a retrospective observational study, and all relevant data (such as demographic, clinical and laboratory findings) were obtained through electronic charts review. This study was approved by the local ethics committee.
Definition of long-term renal outcome
A poor long-term renal outcome was defined as SCr ≥1.5 mg/dL at the 7-year follow-up. Conversely, patients with SCr <1.5 mg/dL were considered to have a good renal outcome. Although MAINTAIN and ELNT used a cut-off of SCr <1.0 mg/dL, the cut-off of SCr <1.5 mg/dL already used by Chen et al 16 was adopted to allow the discrimination of highly severe cases among an already severe LN population.
Statistical analysis
PTU, SCr and urine RBC counts were evaluated at baseline; after 3, 6 and 12 months; and at 7 years of follow-up. Anti-dsDNA antibodies, serum albumin and Systemic Lupus Erythematosus Disease Activity Index (SLEDAI) score were assessed only at baseline, and the total number of renal flares was assessed during the follow-up. A renal flare was defined as a significant increase in PTU levels (PTU >500 mg/24 hours if previously negative or PTU >3 g if previously >500 mg/24 hours). Absolute values were used for PTU, SCr and albumin. RBCs and anti-dsDNA were considered only as present or absent. The ability of these biomarkers at different time points to predict a good long-term renal outcome (arbitrarily defined as SCr <1.5 mg/dL) at 7 years was assessed.
Initially, the evaluation of biomarkers (at baseline and after 3, 6 and 12 months) associated with good long-term renal outcome (SCr <1.5 mg/dL at the 7-year follow-up) was performed using appropriate statistical tests such as Student’s t-test, Mann-Whitney and Chi-square. Subsequently, parameters that were not associated with long-term renal outcome were excluded.
The second step was to generate receiver operating characteristic (ROC) curves to assess the best parameter performance at different time points and then to select the cut-off for each of these parameters. Accuracy, represented by the area under the curve (AUC), sensitivity, specificity, PPV, NPV and their CIs were also calculated. ROC curves were used to calculate single-variable analysis and the sensitivity, specificity, PPV and NPV of the combined variables. This enabled comparisons between the models.
Once the best biomarker to predict long-term renal outcome had been defined, the third step was to plot Kaplan-Meier curves to assess renal survival and to validate this parameter for patients of distinct histological classes, races, genders and anti-dsDNA profiles.
All analyses were performed using SPSS software. Statistical significance was set as p<0.05.
Results
Demographic, clinical and histological characteristics
Of the total SLE population (n=94), 80 patients (85.1%) were women, and 38 patients (40.4%) were non-white. The mean age was 44±10 years old. At baseline, SLE patients had a mean SCr value of 1.73±1.34 mg/dL, a mean PTU of 5.46±4.51 g/24 hours, a mean albumin concentration of 2.45±0.78 g/dL, a mean SLEDAI of 9.46±4.2. Almost two-thirds had positive anti-dsDNA (64.3%,) and 33 patients (31.5%) had SCr ≥1.5 mg/dL. The frequencies of histological classes were class II (7.4%), class III or class III+V (10.6%), class IV or class IV+V (46.8%) and pure class V (35.1%).
At the end of the follow-up (7 years), a total of 59 (62.7%) patients had a good long-term outcome of a SCr <1.5 mg/dL, 20 (21.3%) patients were on dialysis and 9 (9.5%) patients died (primarily due to infections). Further analysis of the distribution of patients according to SCr groups (≥1.5 mg/dL or <1.5 mg/dL) revealed that 17/31 (54.8%) of patients with SCr ≥1.5 mg/dL at entry improved kidney function and 15/60 (25.0%) who had SCr of <1.5 mg/dL at entry ended with a SCr ≥1.5 mg/dL at the end of follow-up.
Baseline data and long-term renal outcome
To investigate if long-term renal outcome could be predicted by baseline data, SLE patients were divided into two groups (SCr at 7 years <1.5 and ≥1.5 mg/dL). Of note, most of the baseline data were comparable between groups: 24-hour PTU (5.33±0.62 vs 5.76±0.69 g/day; p=0.19), serum albumin (2.44±0.9 vs 2.46±0.76 g/dL; p=0.88), complement C3 (76±34 vs 66±30 mg/dL; p=0.17), positive anti-dsDNA (65% vs 67%; p=0.59), SLEDAI (9.42±0.49 vs 9.48±0.42; p=0.53), presence of RBCs (64% vs 85%; p=0.05). SCr (1.4±1.0 vs 2.3±1.6 mg/dL; p=0.003) was the only baseline parameter significantly related to renal outcome.
Assessing renal flares
As the number of renal flares usually influences renal outcome (and could be a confounder in the present study), another analysis was performed to compare the numbers of renal flares during follow-up. Both groups (SCr at 7 years <1.5 and ≥1.5 mg/dL) exhibited a comparable number of flares during follow-up (1.42±0.93 vs 1.47±0.89, p=1.0).
Performance of 24-hour PTU at 3, 6 and 12 months
The kinetics of 24-hour PTU within the first year of treatment was assessed in both groups (SCr at 7 years <1.5 and ≥1.5 mg/dL). A significant difference in PTU levels between groups at the 3-month (2.25±0.27 vs 4.02±0.56 g/day, p=0.001), 6-month (1.12±0.17 vs 3.45±0.67 g/day, p<0.0001) and 12-month (0.72±0.12 vs 3.74±0.76 g/day, p<0.0001) periods was observed, in contrast with the comparable levels detected at baseline (5.33±0.62 vs 5.76±0.69 g/day, p=0.19) (figure 1).

24-hour proteinuria (g/day) during follow-up in patients with good long-term renal outcome (SCr <1.5 mg/dL) and a poor long-term renal outcome (SCr ≥1.5 mg/dL). Data are shown at baseline and at 3, 6 and 12 months of follow-up. p Values above the columns were calculated by Mann-Whitney tests. SCr, serum creatinine.
Determination of the best renal predictor
ROC curves with PTU and SCr values measured at different points within the first year of follow-up were generated to identify the target that would best predict long-term renal outcome. Figure 2 shows the ROC curves for PTU levels achieved at 3, 6 and 12 months, their AUCs and PTU cut-off values that maximised sensitivity and specificity. PTU <0.8 g/24 hours at 12 months of follow-up was the best single predictor of long-term renal outcome (sensitivity 90%, specificity 78%, PPV 67%, NPV 94% AUC 0.86; p<0.001). SCr alone at 12 months was related to long-term renal outcome (p=0.001), but in the ROC curve, it performed worse than PTU (sensitivity 84%, specificity 76%, PPV 52%, NPV 100%). The addition of creatinine to the composite model did not improve the performance of PTU alone (sensitivity 74%, specificity 87%, PPV 87%, NPV 74%). The number of RBCs alone at 12 months was not able to distinguish between groups with a good or poor long-term renal outcome (p=0.06). The presence of RBCs was a poor independent predictor (sensitivity 45%, specificity 50%, PPV 39%, NPV 50%), and therefore, it was not included in the final model because it would negatively impact the performance of the model.

Receiver operating characteristic curves of 24-hour proteinuria at 3 (A), 6 (B) and 12 (C) months of follow-up. Area under the curve (AUC); the cut-off, sensitivity and specificity values and their CIs are shown in the graphs.
Assessing renal survival and validation of the PTU cut-off
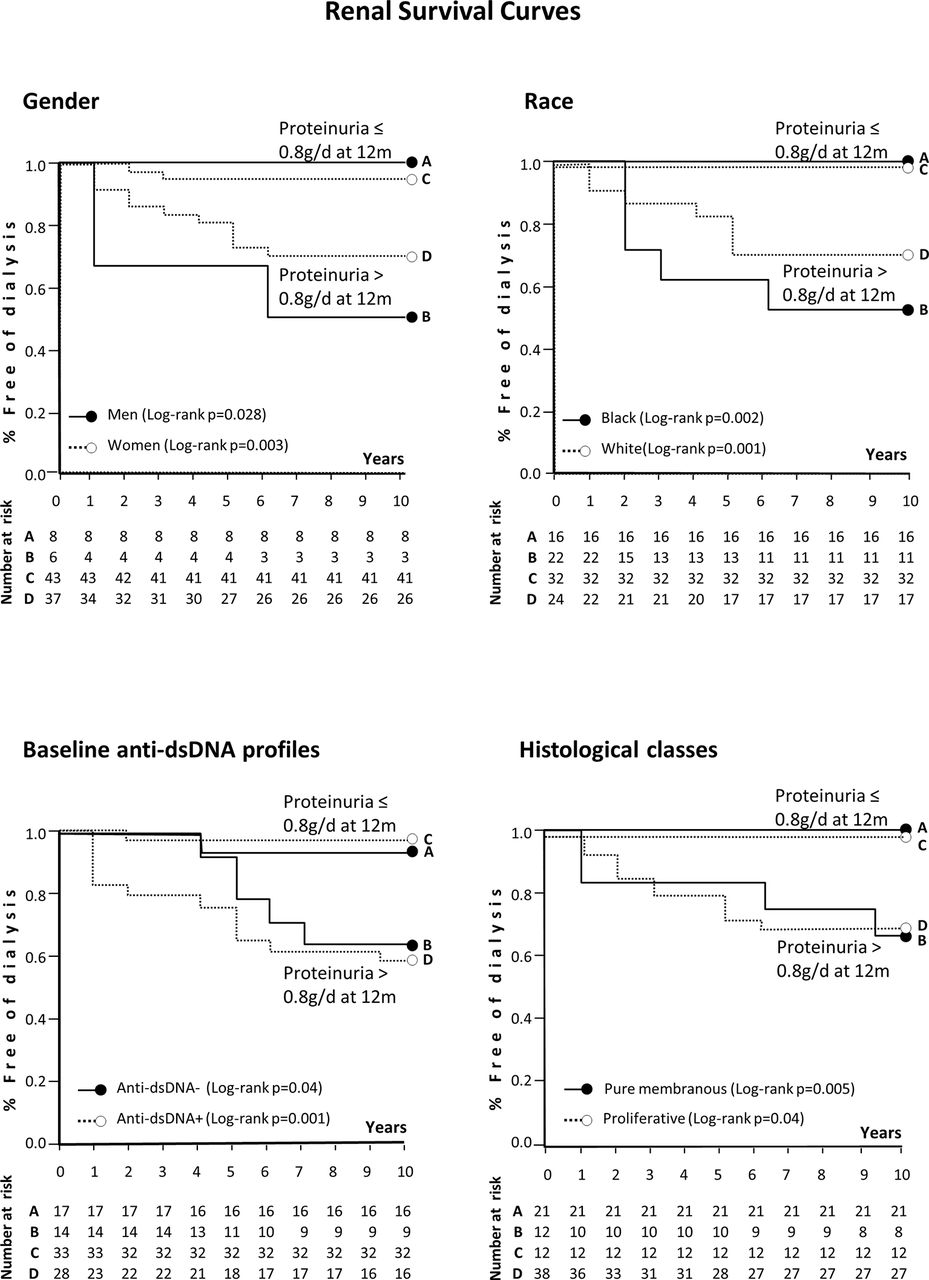
The Kaplan-Meier curves generated to assess renal survival using the proposed PTU cut-off (<0.8 g/24 hours at 12 months) were also able to distinguish good and poor renal outcomes based on different conditions that are known to influence renal outcome: pure membranous disease (p=0.005) and proliferative nephritis (p=0.043) and black (p=0.002), white (p=0.001), anti-dsDNA positive (p=0.001), anti-dsDNA negative (p=0.04) and male (p=0.028) and female (p=0.003) patients (figure 3).
Renal survival Kaplan-Meier curves for distinct histological classes, races, genders and anti-dsDNA profiles. The p values that are indicated above were calculated by log-rank tests.
Discussion
This study demonstrated, in a real-life situation, that PTU <0.8 g/24 hours at 12 months of follow-up was the single best predictor of a good long-term renal outcome in an ethnically diverse group of patients with severe nephritis.
The evaluation of a population with a mixed ethnic background, such as a Brazilian population, was essential in the validation of the generalisation of the reported PTU target as a long-term predictor of renal outcome in patients with lupus.12 13 Indeed, nephritis appears to have a less favourable outcome in non-white populations; race/ethnicity as well as geographical region was reported to influence LN treatment response.17 18
We have extended previous observations to include patients with more severe nephritis, since the mean SCr level was higher (1.73 mg/dL) herein compared with the mean values reported in the ELNT (1.15 mg/dL) and MANTAIN (0.95 mg/dL) studies. Accordingly, the SCr cut-off level used in the current trial was more stringent than the ones used in other trials but was comparable to levels in previous studies that assessed patients with more severe LN.16 As expected, the enrolment of a representative sample of patients with renal impairment yielded lower PPV and higher NPV values than in previous reports.12 13 The remarkably high NPV (94%) obtained in the current study indicates that only 6% of the patients who did not achieve the proposed PTU target in 1 year would still have a SCr <1.5 mg/dL after 7 years of follow-up. This finding reinforces the relevance of this important predictor for the treatment of LN.
Another advantage of the present study is that it includes real-world observations, since adherence is generally higher in clinical trials than in routine clinical practice. The adherence reported in the MAINTAIN trial was approximately 80%,13 whereas in real-life, the reported adherence in Brazilian lupus patients was less than 50%.14 Conversely, the real-life situation is a limitation of our work because NL treatment heterogeneity might have influenced the PTU response.
In spite of that, the PTU cut-off (<0.8 g/24 hours) observed here was comparable to the previously reported values (<0.7 g and <0.8 g) in Caucasian patients with less severe nephritis, which suggests that this target is likely to be generalisable. We confirmed the previous observation that the best time to assess this parameter was at the 12-month follow-up visit and reinforced the finding that the PTU response starts as early as 3 months.12 13 19
Although creatinine clearance, PTU, age, gender and histological features are known risk factors for renal deterioration17 that were recently tested in a multistate modelling study20 when we evaluated treatment response at 12 months, the addition of SCr and RBC to the PTU analysis did not improve the performance of isolated PTU, confirming that this parameter is the single best predictor of long-term renal outcome.12 13
Renal flares are recognised as another important predictor of renal survival and may be a confounding variable in the outcome analysis.21 However, the number of flares during follow-up was comparable in both groups of patients, which minimised the interference of this variable in the outcome assessed.
The further evaluation of a PTU cut-off value of 0.8 g/24 hours in distinct races revealed that for white and non-white patients, this target predicts a better long-term renal outcome in spite of the fact that poor renal survival has been reported in African–Americans and Hispanics compared with Caucasians with LN.18 22 Likewise, the proposed PTU target was validated for female and male patients regardless of the finding that the latter group has a worse prognosis.23
Regarding histological classes, lupus membranous glomerulonephritis appears to have a more favourable long-term course compared with the proliferative forms of the disease,24 and there were some concerns that the performance of the proposed PTU target may be different in patients with proliferative versus membranous forms of the disease.25 Along this line, it was suggested that residual PTU might be a less serious problem in patients with membranous disease compared with patients with proliferative disease.25 Our data clearly demonstrated that the PTU cut-off is indeed a target to be achieved independent of the histological LN class. In support of this notion, the PTU cut-off was valid for patients with and without an anti-dsDNA profile despite the association of this antibody with cases of more severe nephritis.22
Conclusion
In conclusion, we demonstrated, in a real-life situation, that PTU at 12 months of follow-up was the single best predictor of renal outcome at 7 years in an ethnically diverse group of patients with severe nephritis. We further validated this parameter as a long-term predictor of renal outcome for distinct histological classes, races, genders and anti-dsDNA profiles. Our findings strongly support the recommendation that rheumatologists should use PTU at 12 months as a T2T strategy in clinical practice to optimise outcomes.
References
Footnotes
Contributors All authors equally contributed to this article and meet the authorship criteria.
Competing interests EFB and EB received a grant from Conselho Nacional de Desenvolvimento Científico e Tecnológico (#307226/2014-0 to EFB and #305068/2014-8 to EB) not related with this work.
Ethics approval All procedures performed in studies involving human participants were in accordance with the ethical standards of the institutional and/or national research committee and with the 1964 Declaration of Helsinki and its later amendments or comparable ethical standards.
Provenance and peer review Not commissioned; externally peer reviewed.
Data sharing statement All data are provided in full in the results section of this paper.