Article Text

Abstract
Objective Anifrolumab is a fully human immunoglobulin G1 κ monoclonal antibody specific for subunit 1 of the type I interferon (IFN) α receptor. In a phase IIb study of adults with moderate to severe SLE, anifrolumab treatment demonstrated substantial reductions in multiple clinical endpoints. Here, we evaluated serum proteins and immune cells associated with SLE pathogenesis, type I interferon gene signature (IFNGS) test status and disease activity, and how anifrolumab affected these components.
Methods Whole blood samples were collected from patients enrolled in MUSE (NCT01438489) for serum protein and cellular assessments at baseline and subsequent time points. Data were parsed by IFNGS test status (high/low) and disease activity. Protein expression and immune cell subsets were measured using multiplex immunoassay and flow cytometry, respectively. Blood samples from healthy donors were analysed for comparison.
Results Baseline protein expression differed between patients with SLE and healthy donors, IFNGS test-high and -low patients, and patients with moderate and severe disease. Anifrolumab treatment lowered concentrations of IFN-induced chemokines associated with B, T and other immune cell migration in addition to proteins associated with endothelial activation that were dysregulated at baseline. IFNGS test-high patients and those with high disease activity were characterised by low baseline numbers of lymphocytes, circulating memory T-cell subsets and neutrophils. Anifrolumab treatment reversed lymphopenia and neutropenia in the total population, and normalised multiple T-cell subset counts in IFNGS test-high patients compared with placebo.
Conclusions Anifrolumab treatment reversed IFN-associated changes at the protein and cellular level, indicating multiple modes of activity.
Trial registration number NCT01438489.
- systemic lupus erythematosus
- type I interferon
- monoclonal antibody
- disease activity
This is an open access article distributed in accordance with the Creative Commons Attribution Non Commercial (CC BY-NC 4.0) license, which permits others to distribute, remix, adapt, build upon this work non-commercially, and license their derivative works on different terms, provided the original work is properly cited, appropriate credit is given, any changes made indicated, and the use is non-commercial. See: http://creativecommons.org/licenses/by-nc/4.0/
Statistics from Altmetric.com
Introduction
Systemic lupus erythematosus (SLE) is a chronic, multisystem, disabling autoimmune disease of unknown aetiology that is associated with severe morbidity and an increased risk of mortality.1 SLE treatment remains challenging due to the limited efficacy and deleterious side effects of some standard therapies.2 Only one new therapy, belimumab, has been approved for the treatment of SLE in the last 50 years.3
The pathogenesis of SLE is complex and includes genetic, environmental, ethnic and immunological factors.4 One of the key elements believed to link these diverse factors is type I interferon (IFN).5 Unabated secretion of type I IFN by plasmacytoid dendritic cells (pDCs) and signalling via the IFN-α receptor (IFNAR) have been directly associated with immune dysregulation and increased disease activity in patients with SLE.6 7
Type I IFN elicits a diverse spectrum of effects on immune cells including assisting in the differentiation of dendritic cells into potent antigen-presenting cells,8 9 prolonging the survival of activated T cells, stimulating the development of memory T cells and increasing plasma cell differentiation.10 Furthermore, exposure to type I IFN and immune complexes (ICs) renders SLE-derived neutrophils susceptible to neutrophil extracellular trap-osis (NETosis).11 This leads to the production of a rich source of intracellular materials (including RNA and DNA) which ultimately result in IC-mediated induction or amplification of IFNα production by pDCs.12
The majority of moderate to severe patients with SLE exhibit elevated expression of the type I IFN-inducible genes or the ‘IFN gene signature’ in their peripheral blood cells.13–16 Therefore, blockade of type I IFN signalling may be an effective and viable treatment for SLE.
Anifrolumab (formerly MEDI-546) is a fully human immunoglobulin (Ig) G1 κ monoclonal antibody that binds to subunit 1 of IFNAR, inhibiting all type I IFN signalling.17 18 Recently, a phase IIb study (NCT01438489) reported substantial reductions in disease activity across multiple clinical endpoints in patients with moderate to severe SLE, following treatment with intravenous anifrolumab (300 or 1000 mg).19 The primary endpoint, percentage of patients achieving an SLE Responder Index at week 24 with sustained reduction of oral corticosteroids (OCS), was met by more patients treated with anifrolumab than placebo. Anifrolumab treatment also showed significant improvements compared with placebo, in percentage of patients achieving a major clinical response, percentage of patients with severe disease at baseline who had a 50% reduction in Cutaneous Lupus Erythematosus Disease Area and Severity Index (CLASI) score and percentage of patients with a SLE Disease Activity Index 2000 (SLEDAI-2K) score ≤2 by week 52.19
To further elucidate the mechanism of action of anifrolumab, we examined how dysregulation of the protein and immune cell repertoire of patients with SLE is associated with type I IFNGS test status and disease activity. Subsequently, we evaluated how treatment with anifrolumab altered these components relative to placebo.
Methods
Clinical samples
Blood samples were obtained from adults with moderate to severe SLE enrolled in the MUSE study (NCT01438489).19 Patients were randomised 1:1:1 to receive intravenous placebo or anifrolumab 300 mg or 1000 mg every 4 weeks, in addition to standard therapy. OCS tapering was encouraged, investigator permitting, any time after randomisation but not within 8 weeks of the primary and secondary endpoint assessments. Randomisation was stratified by type I IFNGS test status (high or low) using a validated four-gene (IFI27, IFI44, IFI44L, RSAD2) qualitative polymerase chain reaction-based test, OCS dosage (<10 or ≥10 mg/day) and SLEDAI-2K score (<10 or≥10). Full details of the MUSE study design, including inclusion and exclusion criteria, have been previously published.19 Healthy donor samples were purchased from BioreclamationIVT (Westbury, New York, USA) and were age-matched and sex-matched to the SLE cohort.
Whole blood sample acquisition and handling
Serum samples for protein analyses were collected and frozen at –80°C on days 1, 85 and 169. Blood samples from patients were collected pre-dose on days 1, 85, 141, 169, 253, 337 and 365 for complete blood counts (CBC) and flow cytometry (at selected sites). All flow cytometry assays were validated at LabCorp (Brentwood, Tennessee, USA) and then transferred to LabCorp flow cytometry facilities (Cranford, New Jersey, USA, and Mechelen, Belgium). Healthy donor sample stability was assessed daily for 3 days following acquisition. Stability analyses commenced 1 day after blood draw and shipping to mimic the handling of clinical samples. Patient samples for flow cytometry were analysed at the facility closest to the collection site. CBC with differential was performed using validated methods at a central laboratory.
Serum protein profiling
Serum samples were stored at –80°C before shipment to Myriad RBM Inc (Austin, Texas, USA) where analyses were conducted using the Luminex® xMAP technology according to standard operating procedures.20 The baseline expression of 134 proteins in healthy donors and in patients with SLE from the MUSE study was evaluated to determine which proteins were associated with disease. Proteins with serum concentrations below the lower limit of quantification (LLOQ) in >70% of all samples were excluded from the downstream analysis. For those samples with serum concentrations below the LLOQ, we replaced the concentration with the LLOQ and analysed accordingly. The percentage change from baseline in the expression of proteins found to be dysregulated at baseline was measured following treatment with anifrolumab 300 or 1000 mg and compared with placebo.
Immune cell subset profiling
Flow cytometry assays were validated using recommended procedures, including evaluation of inter-assay and intra-assay precision, repeatability and ruggedness.21 The DC and T-cell and B-cell panels were tested using heparinized whole blood from five healthy donors on a BD FACSCanto IITM (BD Biosciences, San Jose, California, USA) using seven-tube, eight-colour panels, which reported cell percentage and absolute number to assess assay repeatability. CD markers and gating strategies for the different immune cell types are summarised in online supplementary table S1. To ensure sample quality, CD45x side scatter (SSC) and/or forward scatter (FSC)/SSC approaches were used in combination with normal doublet discrimination gate prior to subsetting of cell populations based on the additional population marker antigens.
Supplemental material
Neutrophil data are presented from CBC results only as too few patients from the flow cytometry cohort had detectable numbers of neutrophil subsets.
Baseline flow cytometry and CBC analyses used blood samples from the modified intention-to-treat (mITT) MUSE study population, defined as all randomised patients who received any investigational product, and had data for the analyte of interest (n=87 and 297 for flow cytometry and CBC analyses, respectively).
Longitudinal analyses to determine the effect of anifrolumab treatment on specific immune cell counts were conducted using samples from the mITT population with flow cytometry data available at baseline in addition to ≥2 further time points (n=75).
Statistical analysis
Non-parametric Wilcoxon tests, Kruskal-Wallis H test and Spearman’s rank correlation coefficient analyses were used to evaluate baseline dysregulation in serum protein concentration among different disease-related groups. P-values <0.05 were considered significant with Benjamin-Hochberg (B-H) multiple testing correction. The Wilcoxon test was used to compare post-treatment changes between placebo and anifrolumab 300 or 1000 mg treatment groups at each time point. Longitudinal effects of anifrolumab were considered significant if the B-H adjusted p-value was <0.05 at more than one post-treatment time point for either dosage of anifrolumab.
For baseline flow cytometry measurements, a constant value of 0.5 was added to all data points and a log2 transformation was applied; mean fold change, CIs and p-value were then calculated using the Student’s t-test. For longitudinal CBC and flow cytometry data, the Student’s t-test was used to compare the means between different treatment groups and placebo; no multiplicity adjustment was applied. P-values <0.05 were considered nominally significant.
Results
Association of protein expression with baseline disease activity and type I IFNGS test status
A panel of 134 proteins were analysed at baseline in patients with SLE (n=304) from the MUSE study and 30 healthy donor controls. Of those, 59 proteins were differentially expressed in patients with SLE compared with healthy donors, among which 48 were elevated and 11 were reduced (B-H p<0.05). In parallel, we found 66 proteins with different levels among healthy donors, IFNGS test-high and IFNGS test-low patients with SLE (B-H p<0.05). Combining two lists of proteins identified above, 67 unique proteins demonstrated dysregulated serum levels in IFNGS test-high and/or IFNGS test-low patients with SLE. A total of 42 proteins were significantly differentially expressed between IFNGS test-high and IFNGS test-low patients, of which 38 were elevated in IFNGS test-high patients relative to IFNGS test-low patients (online supplementary table S2). Many of the upregulated proteins in IFNGS test-high patients are known type I IFN-inducible proteins, consistent with previous literature.22 The baseline expression of the 67 dysregulated proteins in SLE was analysed in association with SLEDAI-2K and CLASI scores. Serum concentrations of 27 proteins were significantly correlated with SLEDAI-2K score by Spearman’s correlation analysis and significantly higher in patients with SLE with high SLEDAI-2K than those with low SLEDAI-2K score (p<0.05) (figure 1, online supplementary table S3C), indicating their association with overall lupus disease activity. Seven proteins demonstrated significant correlation with CLASI activity scores and showed higher concentrations in patients with high CLASI scores (figure 1, online supplementary table S3B), suggesting their potential as biomarkers of cutaneous lupus activity.

Serum proteins dysregulated at baseline in patients enrolled in the MUSE study subsetted by IFNGS test status, Cutaneous Lupus Erythematosus Disease Area and Severity Index (CLASI) and Systemic Lupus Erythematosus Disease Activity Index 2000 (SLEDAI-2K) scores, and the proportions of these proteins that are significantly upregulated or downregulated following treatment with anifrolumab. The Venn diagram is area-proportional to the numbers of serum proteins that are dysregulated at baseline in patients classified as IFNGS test-high (n=229) versus test-low (n=75), patients with a CLASI score ≥10 (n=77) versus <10 (n=227) and patients with a SLEDAI-2K score ≥10 (n=181) versus <10 (n=123). These baseline values are also represented by numbers in the figure. The numbers in parenthesis represent the numbers of serum proteins that are significantly upregulated or downregulated following anifrolumab treatment. IFN, interferon; IFNGS, IFN gene signature; MUSE, a Phase II, Randomized Study to Evaluate the Efficacy and Safety of MEDI-546 in Subjects with Systemic Lupus Erythematosus.
Association of immune cell populations with baseline disease activity and type I IFNGS test status
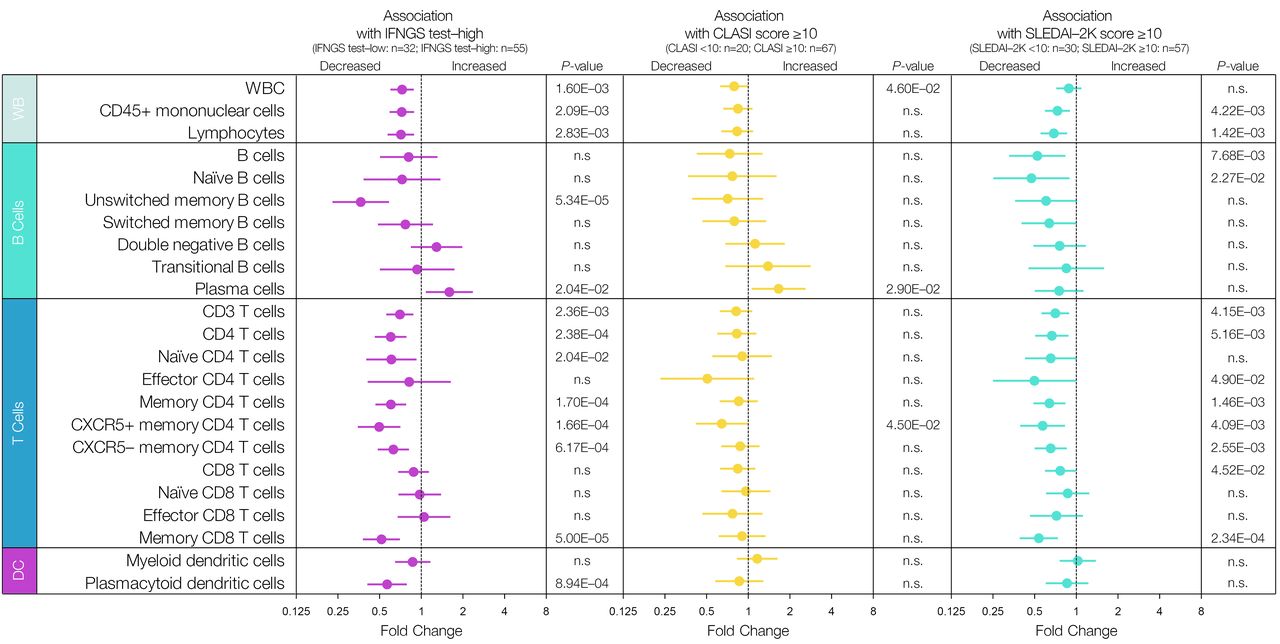
The mean fold change of baseline flow cytometry measurements in patients who were IFNGS test-high (n=55), relative to IFNGS test-low (n=32), for those with CLASI scores≥10 (n=67) relative to CLASI scores<10 (n=20), and for those with SLEDAI-2K scores≥10 (n=57) relative to those with scores<10 (n=30), is shown in figure 2. At baseline, circulating white blood cell numbers were found to negatively associate with IFNGS test-high status and severe CLASI (CLASI ≥10). Peripheral blood T-cell numbers were significantly lower in IFNGS test-high patients and in patients with high disease activity (SLEDAI-2K≥10). This trend persisted across multiple subpopulations of T cells with the strongest signals observed in the memory CD8 T-cell and CXCR5 +memory CD4 T-cell compartments. Only the CXCR5+memory CD4 T-cell numbers were significantly lower in patients with high CLASI. Overall, B-cell populations had fewer associations with IFNGS test status and disease activity measures. However, unswitched memory B cells were profoundly lower in IFNGS test-high patients, and in contrast, plasma cell numbers were significantly higher in IFNGS test-high patients and in patients with high disease activity. Baseline pDC numbers were significantly lower in IFNGS test-high patients and in patients with high disease activity.

Immune cell populations associated with type I IFNGS test status and disease activity. Data are mean fold change of baseline flow cytometry measurements±95% CIs of immune cell subsets in IFNGS test-high versus IFNGS test-low patients, patients with Cutaneous Lupus Erythematosus Disease Area and Severity Index (CLASI) ≥10 versus patients with CLASI <10, and patients with Systemic Lupus Erythematosus Disease Activity Index (SLEDAI) ≥10 versus patients with SLEDAI <10. A constant value of 0.5 was added to all data points before a log2 transformation was applied. Statistical analysis was carried out using a Student’s t -test. Significant p-values <0.05 are reported. DC, dendritic cells; IFN, interferon; IFNGS, IFN gene signature; n.s., not significant; WB, whole blood; WBC, white blood cells.
Effect of anifrolumab treatment on SLE-associated lymphopenia, neutropenia, monocytopenia and thrombocytopenia
Disease-associated lymphopenia, as assessed by CBC, was rapidly and sustainably reversed in patients who received either anifrolumab 300 or 1000 mg (mean change from baseline, compared with placebo p<0.05 at all time points) (figure 3A). Similar results were seen for disease-associated neutropenia, monocytopenia and thrombocytopenia following anifrolumab treatment; in particular, patients in the higher dosage treatment group had significantly increased numbers of neutrophils relative to placebo (figure 3B-D). IFNGS test-high patients demonstrated results comparable to the total cohort for the reversal of lymphopenia, neutropenia, monocytopenia and thrombocytopenia (figure 3A–D). In contrast, for IFNGS test-low patients, no significant differences in lymphocyte or neutrophil numbers between either treatment group and placebo were observed for the majority of the time course (figure 3A, B).
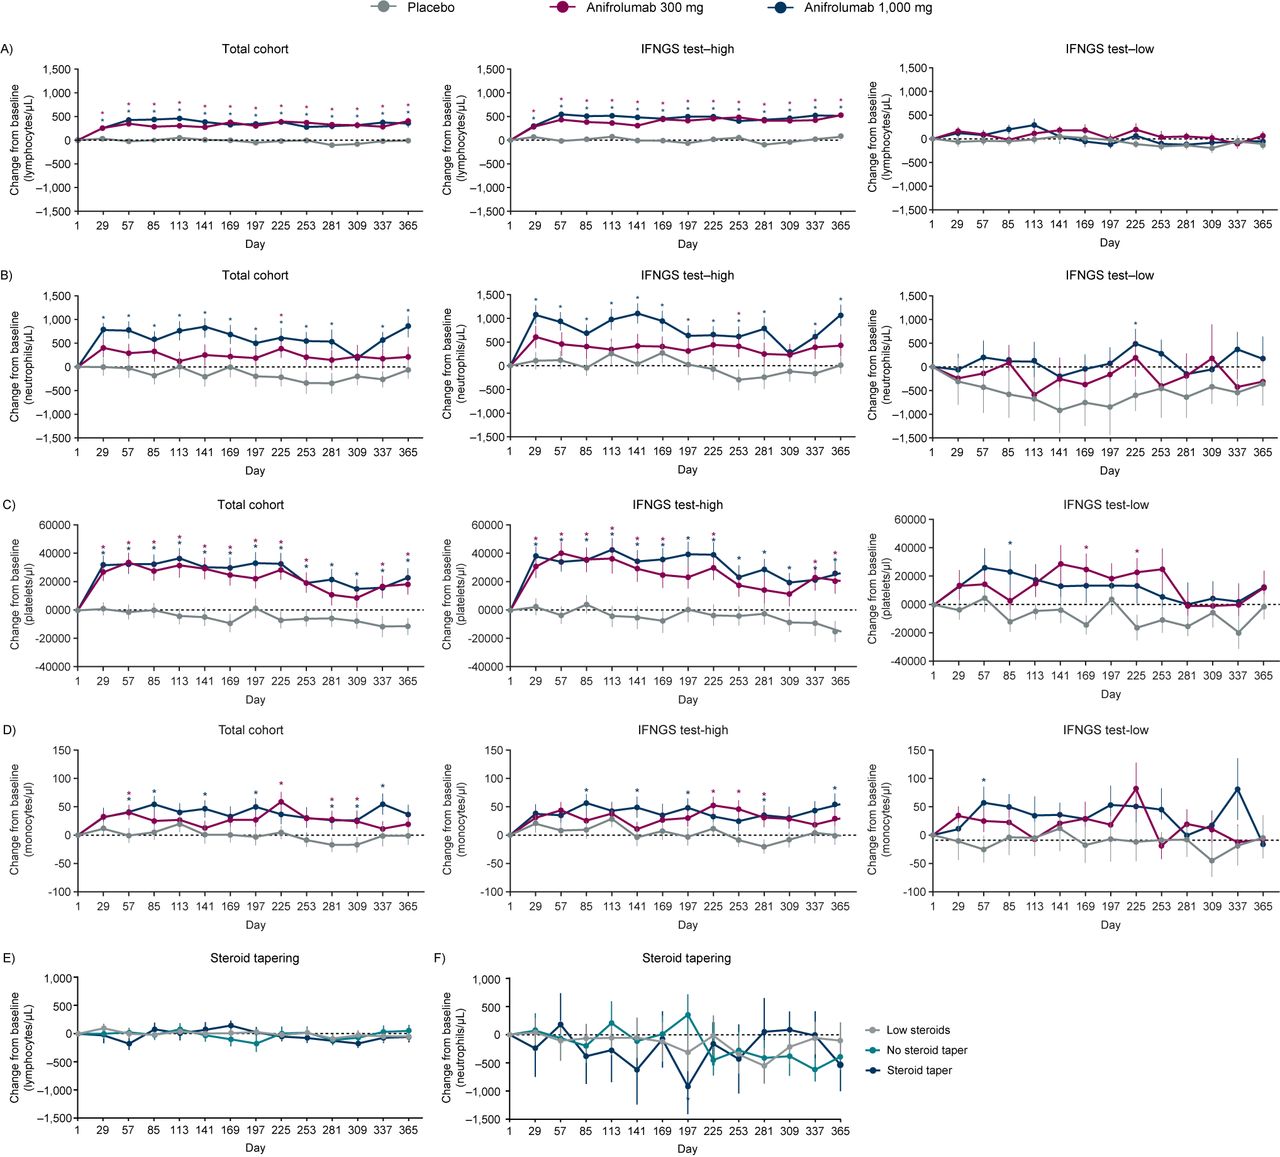
Mean change from baseline in complete blood count (CBC) lymphocyte (A), neutrophil (B), platelet (C), and monocyte (D) counts over time for patients enrolled in the MUSE study, split by treatment group and IFNGS test status; mean change from baseline in CBC lymphocyte (E) and neutrophil counts (F) over time for patients treated with placebo enrolled in the MUSE study, split by oral corticosteroid (OCS) tapering history. (A, B) Anifrolumab significantly increased the mean number of lymphocytes and neutrophils from baseline at all time points (±SEM). Placebo group: patient numbers ranged from 68 (at days 337 and 365) to 101 (at day 1). Anifrolumab 300 mg group: patient numbers ranged from 82 (at day 365) to 99 (at day 1). Anifrolumab 1000 mg group: patient numbers ranged from 68 (at day 337) to 97 (at day 1). *P<0.05 (Student’s t-test for the comparison of anifrolumab vs placebo). (C, D) Anifrolumab significantly increased the mean number of platelets and monocytes from baseline at multiple time points (±SEM). Placebo group: patient numbers ranged from 101 (at day 1) to 68 (at day 337). Anifrolumab 300 mg group: patient numbers ranged from 98 (at day 1) to 81 (at day 337). Anifrolumab 1000 mg group: patient numbers ranged from 98 (at day 1) to 71 (at day 337). *P<0.05 (Student’s t-test for the comparison of anifrolumab vs placebo). (E and F) Lymphocytes and neutrophil concentrations were not affected by steroid tapering. Tapering was defined as a reduction of OCS dosage at day 365 by ≤7.5 mg/day in patients who were receiving ≥10 mg/day at baseline. Sample sizes ranged from 16 to 42 patients, dependent on steroid tapering regimen group. *P<0.05 (Student′s t-test for the comparison of steroid taper vs no steroid taper). Low steroids group: patient numbers ranged from 23 (on days 253 and 365) to 38 (on day 1). No steroid taper group: patient numbers ranged from 26 (on day 337) to 44 (on day 1). Steroid taper group: patient numbers ranged from 16 (on day 337) to 19 (on days 1–141 and 197–225). CBC, complete blood count; IFN, interferon; IFNGS, IFN gene signature; MUSE, a Phase II, Randomized Study to Evaluate the Efficacy and Safety of MEDI-546 in Subjects with Systemic Lupus Erythematosus; OCS, oral corticosteroid; SEM, SE of the mean.
Absolute change in blood lymphocyte and neutrophil counts over time for all patients and those classified by IFNGS test status are shown in online supplementary figure S1. IFNGS test-high patients demonstrated lower counts of lymphocytes and neutrophils at baseline compared with IFNGS test-low patients. Following treatment with anifrolumab, these cells types increased only in IFN test-high patients across most time points in the study (online supplementary figure S1).
The MUSE study permitted OCS tapering following randomisation at the discretion of the investigators.19 OCS treatment can cause alterations in the numbers of some circulating immune cells, including lymphocytes and neutrophils,23 24 and it was therefore important to establish that the observed reversal of lymphopenia and neutropenia was not a consequence of OCS tapering. To this end, we examined changes in lymphocytes and neutrophils over time in placebo-treated patients. In figure 3E, F change in cell numbers over time for placebo-treated patients who tapered steroids, did not taper steroids or who were ineligible to taper (due to low steroid dose at baseline) is shown. No significant increases were observed.
Effect of anifrolumab treatment on SLE-associated serum proteins
Compared with placebo, anifrolumab treatment significantly suppressed the expression of 11 out of the 27 proteins elevated at baseline in patients with SLEDAI-2K scores≥10 (figures 1 and 4). Multiple immune pathways are associated with these proteins, including T-cell-targeting chemokines IP10 and ITAC, B-cell-targeting chemokine CXCL13/BLC, B-cell activator TNFSF13B/BAFF, B-/T-cell activator CCL19/MIP-3β, endothelial cell markers (VCAM1 and ANGPT2), the MHC Class I protein B2M, the soluble cofactor for TLR9 signalling, progranulin and other lymphocyte-associated chemokines (MCP1 and MCP2). Three of those proteins were also positively associated with CLASI activity score at baseline, namely ITAC, CXCL13 and VCAM1. In addition, IgE and FCN3 were significantly higher at baseline in patients with CLASI ≥10, and they were suppressed by anifrolumab treatment. In total, anifrolumab treatment significantly suppressed the expression of five out of the seven serum proteins that were elevated at baseline in patients with CLASI ≥10 (figures 1 and 4).
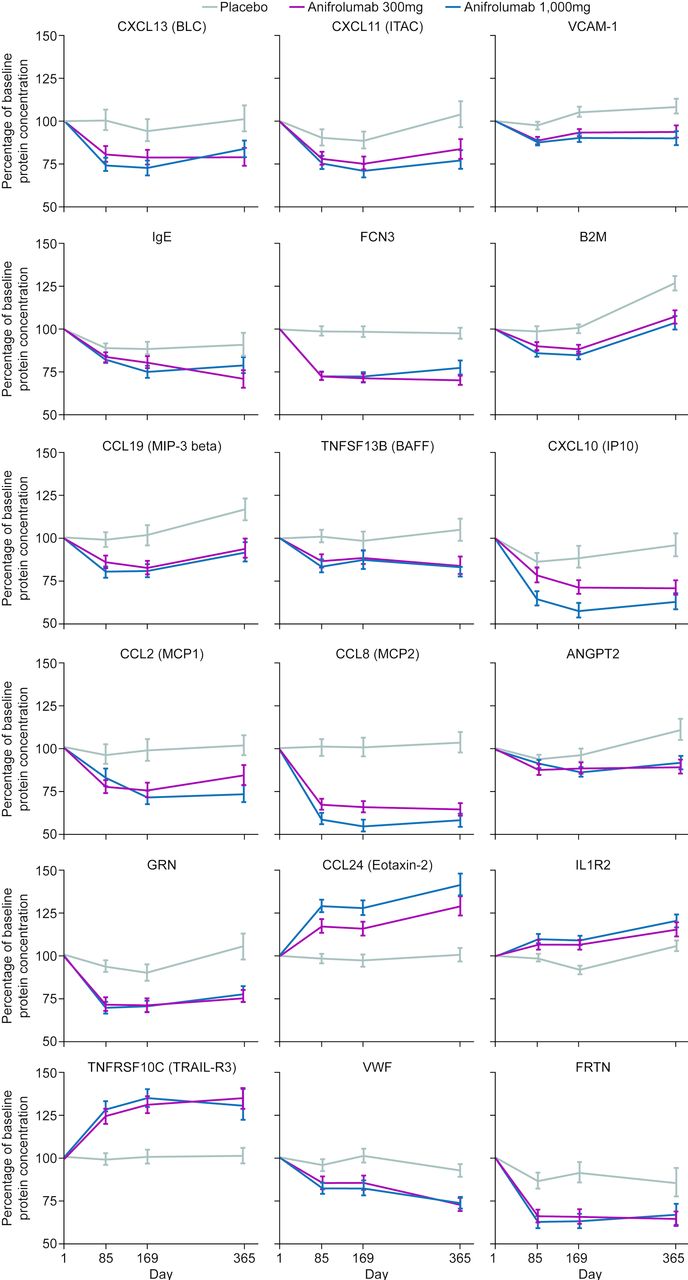
Change over time in percentage of baseline concentrations of selected proteins which were dysregulated in patients with SLE enrolled in the MUSE study. ANGPT2, angiopoietin 2; B2M, beta-2 microglobulin; BAFF, B-cell activating factor; BLC, B lymphocyte chemoattractant; CCL, chemokine (C-C motif) ligand; CXCL, chemokine (C-X-C motif) ligand; FCN3, ficolin-3; FRTN, ferritin; GRN, granulin; IL1R2, interleukin-1 receptor type 2; IP10, interferon gamma–induced protein 10; ITAC, interferon-inducible T cell alpha chemoattractant; MCP, monocyte chemoattractant protein; MIP-3, macrophage inflammatory protein 3; MUSE, a Phase II, Randomized Study to Evaluate the Efficacy and Safety of MEDI-546 in Subjects with Systemic Lupus Erythematosus; TNFRSF10C, tumour necrosis factor receptor superfamily member 10c; TNFSF13B, tumour necrosis factor ligand superfamily member 13b; TRAIL-R3, tumour necrosis factor-related apoptosis-inducing ligand receptor 3; VCAM-1, vascular cell adhesion molecule 1; VWF, von Willebrand factor.
Furthermore, acute-phase reactant ferritin and endothelial cell marker VWF were significantly downregulated, while eosinophil recruiting protein eotaxin-2, anti-apoptotic protein TRAIL-R3 and decoy receptor IL1R2 were upregulated in anifrolumab-treated patients relative to placebo (figure 4). The two downregulated proteins were associated with high IFNGS test score at baseline and the three anifrolumab-upregulated proteins had lower concentrations at baseline in IFNGS test-high patients (online supplementary table S3A), confirming the normalisation of IFN-associated serum protein levels after the blockade of type I IFN pathway by anifrolumab.
Multiple circulating immune cells are altered by anifrolumab
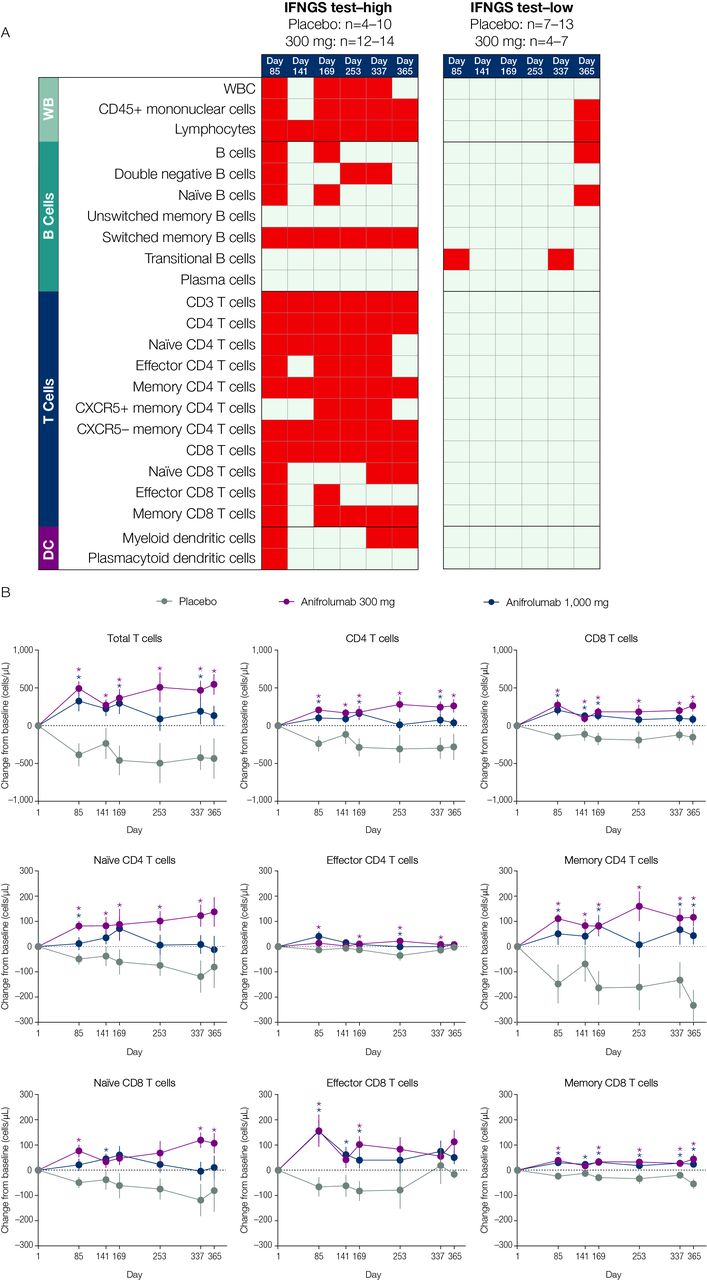
Multiple types of immune cells altered at baseline in association with IFNGS test-high status were normalised following anifrolumab treatment. From days 85–365 of the study, lymphocyte, switched memory B-cell, total T-cell, CD4 T-cell, memory CD4 T-cell, CXCR5- memory CD4 T-cell and CD8 T-cell numbers significantly increased from baseline across all time points measured in anifrolumab 300-mg-treated patients compared with placebo-treated patients (p<0.05; figure 5A, B). The largest differences were observed in memory CD4 T-cell concentrations relative to those in the placebo group. IFNGS test-low patients treated with anifrolumab 300 mg demonstrated minimal changes from baseline in the immune cell subsets.

The effect of anifrolumab treatment on the prevalence of multiple immune cell subtypes in patients stratified by IFNGS test status (A) and on specific T-cell subsets in IFNGS test-high patients (B). (A) Summary table for the comparison of mean change from baseline in the anifrolumab 300 mg group versus placebo for all flow cytometry populations across six time points separated by IFNGS test-high and test-low patients. Red boxes represent statistically significant increases from baseline for the comparison between the 300 mg dosage group and placebo (p<0.05 as calculated using Student’s t-test). Grey boxes represent nonsignificant changes. Placebo group (IFNGS test-high): day 1 (n=13); week 85 (n=10); day 141 (n=10); week 169 (n=10); day 253 (n=7); week 337 (n=8); day 365 (n=4). Anifrolumab 300 mg group (IFNGS test-high): day 1 (n=17); day 85 (n=13); day 141 (n=14); day 169 (n=14); day 253 (n=12); day 337 (n=14); day 365 (n=13). Placebo group (IFNGS test-low): day 1 (n=12); day 85 (n=12); day 141 (n=7); day 169 (n=11); day 253 (n=9); day 337 (n=8); day 365 (n=11). Anifrolumab 300 mg group (IFNGS test-low): day 1 (n=7); day 85 (n=7); day 141 (n=4); day 169 (n=7); day 253 (n=6); day 337 (n=6); day 365 (n=4). (B) Data are mean change from baseline (±SEM) in absolute numbers of T-cell subsets in IFNGS test-high patients. *P<0.05 (Student’s t-test for the comparison of anifrolumab vs placebo). Placebo group: day 1 (n=13); day 85 (n=10); day 141 (n=10); day 169 (n=10); day 253 (n=7); day 337 (n=8); day 365 (n=4). Anifrolumab 300 mg group: day 1 (n=17); day 85 (n=13); day 141 (n=14); day 169 (n=14); day 253 (n=12); day 337 (n=14); day 365 (n=13). Anifrolumab 1000 mg group: day 1 (n=18); day 85 (n=18); day 141 (n=18); day 169 (n=17); day 253 (n=14); day 337 (n=8); day 365 (n=5). DC, dendritic cells; IFN, interferon; IFNGS, IFN gene signature; n.s., not significant; SLEDAI, Systemic Lupus Erythematosus Disease Activity Index; WB, whole blood; WBC, white blood cells.
Discussion
In the MUSE study,19 anifrolumab treatment demonstrated significant clinical improvements across multiple disease activity measures compared with placebo. The present analysis was undertaken to better understand the serum proteins and immune cell repertoire associated with SLE, disease activity and IFN test status and to investigate the effect of anifrolumab treatment on proteomic and cellular dysfunction.
Baseline analyses revealed 27 proteins related to overall disease activity measured by SLEDAI-2K and seven proteins associated with skin involvement measured by CLASI score. All those proteins were significantly associated with IFN test-high score. Evaluation of the baseline immune cells also identified distinct differences between patients stratified by IFNGS test status and CLASI and SLEDAI-2K scores. There was a high degree of overlap between the cell types associated with IFN test-high status and those with high SLEDAI scores. In contrast, few cell subpopulations were associated with CLASI scores.
The analyses described here have several limitations: the flow cytometry data are based on a low number of patients and interpretation of the results are limited by the cellular populations and markers that were selected. Additionally, while the serum concentrations of >100 proteins were examined, many more untested proteins may have important roles in the pathophysiology of SLE. Also, all protein tests are limited by the assay sensitivity.
Anifrolumab treatment achieved a rapid and sustained reversal of SLE-associated lymphopenia, neutropenia, monocytopenia and thrombocytopenia compared with placebo, normalising lymphocyte, neutrophil, monocyte and platelet concentrations. OCS treatment is known to cause alterations in circulating lymphocyte and neutrophil concentrations23 24 and steroid tapering was permitted in the MUSE study.19 Among placebo-treated patients, OCS tapering did not result in changes in lymphocyte or neutrophil counts, suggesting that the reversal seen was attributable to anifrolumab treatment. This finding was foreshadowed by several previous reports: (1) serum concentrations of IFN-α have been historically linked to an inverse relationship with leucocyte counts; (2) therapeutic administration of pegylated type I IFN +ribavirin to patients with hepatitis C virus has been shown to result in leucopenia and thrombocytopenia, demonstrating that type I IFN is sufficient to drive these symptoms of disease; and (3) SLE-associated symptoms mirror traditional type I IFN–associated symptoms of influenza infection (eg, leucopenia, fever, myalgia).25–27 A similar reversal of SLE-associated monocytopenia and thrombocytopenia was also observed in the present study.
Multiple biological mechanisms may account for the observed sustained reversal of lymphopenia, neutropenia, monocytopenia and thrombocytopenia, including alterations in hematopoiesis, changes in cellular migration to or from tissues, prolonged survival of lymphocytes, neutrophils, monocytes and thrombocytes or reduced apoptosis/NETosis.
The concentration of TNF-related apoptosis-inducing ligand (TRAIL) is elevated in patients with SLE.28 Here, TRAIL-R3 concentrations normalised in response to anifrolumab. Increased TRAIL-R3 concentrations would be expected to trigger a decrease in functional TRAIL and apoptosis, supporting the hypothesis that anifrolumab treatment improves immune cell survival.
The anifrolumab-mediated reduction in proteins linked to B-cell survival (BLC and BAFF) may be critical in dampening B-cell differentiation into plasma cells and mature antigen-presenting cells.29 Additionally, the suppression of interferon-inducible chemokines IP-10 and ITAC could reduce immune cell recruitment to sites of inflammation, thereby limiting associated tissue damage.30 Expression of IP-10 and serum progranulin has both previously been shown to correlate with SLE disease activity31 32 and was reduced by both dosages of anifrolumab. Altogether, these findings suggest blockade of type I IFN signalling could attenuate SLE activity and are consistent with the findings in the MUSE study.19 In summary, anifrolumab-mediated proteomic changes provide an opportunity to disrupt the type I IFN inflammation axis, leading to attenuation of SLE-associated inflammation and damage.
Treatment with anifrolumab resulted in normalisation of circulating CD4 +and CD8+T cell and switched memory B-cell counts in IFNGS test-high compared with test-low patients. Belimumab, a B-lymphocyte stimulator-specific inhibitor used to treat SLE, has been shown to decrease total B-cell counts due to decreases in both naive and translational B cells; however, in contrast, has little effect on memory B cells in patients with SLE.33 Similarly, rituximab, another B-cell depleting therapy, normalises the significant disturbances in peripheral B lymphocyte homeostasis reported in patients with SLE at baseline.34
This work demonstrates that there is significant proteomic and cellular dysfunction in SLE. These proteomic and cellular changes are consistent with observed changes in other type I IFN-driven diseases, such as systemic sclerosis35 and dermatomyositis/polymyositis.36 Anifrolumab reverses many of the proteomic and cellular changes associated with SLE, findings which begin to reveal the wider impact of IFNAR blockade and provide a more detailed understanding of anifrolumab’s mechanism of action on a range of immune system targets.
These findings provide mechanistic insight into the clinical benefit observed with anifrolumab in the MUSE study.
Acknowledgments
The authors would like to acknowledge the assistance of Rong Zeng, Geoffrey Stephens, Stephen Eck and Tiziana Di Pucchio for their contributions to the initial stages of the flow cytometry work. The authors thank Kerrie O’Rourke, PhD, and Rebecca Plant, MSc, (QXV Comms [Macclesfield, UK], an Ashfield Company, part of UDG Healthcare plc), who provided medical writing support funded by MedImmune, a member of the AstraZeneca Group, Gaithersburg, MD, USA, in accordance with Good Publication Practice (GPP3) guidelines (http://www.ismpp.org/gpp3).
References
Footnotes
Contributors KAC contributed to the data analysis and interpretation as well as writing and review of the manuscript and approved the final manuscript for publication. XG contributed to the study design, data acquisition, data analysis and interpretation, and manuscript preparation and approved the final manuscript for publication. MA Smith contributed to data analysis and interpretation and manuscript preparation and approved the final manuscript for publication. SW contributed to data analysis and manuscript preparation and approved the final manuscript for publication. DS contributed to data banking and integration, review of data, manuscript preparation and approval of the final manuscript for publication. MA Sanjuan contributed to the study design, data interpretation and manuscript preparation and approved the final manuscript for publication. LW contributed to the study design, data acquisition, data analysis and interpretation, and manuscript preparation and approved the final manuscript for publication. GI contributed to data analysis and interpretation and manuscript preparation and approved the final manuscript for publication. WIW contributed to all biomarker plans and data interpretations as well as writing and review of the manuscript, and approved the final manuscript for publication RZ contributed to the early flow cytometry assay development and optimization GS contributed to data assessments from the flow cytometry work. SE contributed to early flow cytometry development. TDP contributed to early flow cytometry development. KO provided medical writing services. RP provided medical writing services.
Funding This study was sponsored by MedImmune, a member of the AstraZeneca Group.
Competing interests KAC, XG, MAS, SW, DS and WW are employees of MedImmune and hold stock and/or stock options in AstraZeneca. MAS was an employee of MedImmune at the time that this analysis was conducted; he is now an employee of Bristol-Myers Squibb. LW was an employee of MedImmune at the time that this analysis was conducted; he is now an employee of AstraZeneca. GI was an employee of MedImmune at the time that this analysis was conducted; he is now an employee of Viela Bio.
Patient consent Not required.
Ethics approval The MUSE study was conducted in accordance with the principles of the Declaration of Helsinki and the International Conference on Harmonisation Guidelines for Good Clinical Practice. Independent ethics committee or independent institutional review board approvals were obtained.
Provenance and peer review Not commissioned; externally peer reviewed.
Data sharing statement Data underlying the findings described in this manuscript may be obtained in accordance with AstraZeneca’s data sharing policy described at https://astrazenecagrouptrials.pharmacm.com/ST/Submission/Disclosure