Article Text

Abstract
Background SLE is an independent risk factor for cardiovascular disease (CVD). This study aimed to determine which among QRISK2, QRISK3, Framingham Risk Score (FRS), modified Framingham Risk Score (mFRS) and SLE Cardiovascular Risk Equation (SLECRE) best predicts CVD.
Methods This is a single-centre analysis on 1887 patients with SLE followed prospectively according to a standard protocol. Tools’ scores were evaluated against CVD development at/within 10 years for patients with CVD and without CVD. For patients with CVD, the index date for risk score calculation was chosen as close to 10 years prior to CVD event. For patients without CVD, risk scores were calculated as close to 10 years prior to the most recent clinic appointment. Proportions of low-risk (<10%), intermediate-risk (10%–20%) and high-risk (>20%) patients for developing CVD according to each tool were determined, allowing sensitivity, specificity, positive/negative predictive value and concordance (c) statistics analysis.
Results Among 1887 patients, 232 CVD events occurred. QRISK2 and FRS, and QRISK3 and mFRS, performed similarly. SLECRE classified the highest number of patients as intermediate and high risk. Sensitivities and specificities were 19% and 93% for QRISK2, 22% and 93% for FRS, 46% and 83% for mFRS, 47% and 78% for QRISK3, and 61% and 64% for SLECRE. Tools were similar in negative predictive value, ranging from 89% (QRISK2) to 92% (SLECRE). FRS and mFRS had the greatest c-statistics (0.73), while QRISK3 and SLECRE had the lowest (0. 67).
Conclusion mFRS was superior to FRS and was not outperformed by the QRISK tools. SLECRE had the highest sensitivity but the lowest specificity. mFRS is an SLE-adjusted practical tool with a simple, intuitive scoring system reasonably appropriate for ambulatory settings, with more research needed to develop more accurate CVD risk prediction tools in this population.
- lupus erythematosus
- systemic
- cardiovascular diseases
- inflammation
Data availability statement
All data relevant to the study are included in the article or uploaded as supplementary information.
This is an open access article distributed in accordance with the Creative Commons Attribution Non Commercial (CC BY-NC 4.0) license, which permits others to distribute, remix, adapt, build upon this work non-commercially, and license their derivative works on different terms, provided the original work is properly cited, appropriate credit is given, any changes made indicated, and the use is non-commercial. See: http://creativecommons.org/licenses/by-nc/4.0/.
Statistics from Altmetric.com
Key messages
What is already known about this subject?
Patients with SLE are at an increased risk of cardiovascular disease (CVD) compared with the general population.
The performance of a new risk prediction tool for CVD which considers a diagnosis of SLE has not been largely studied.
What does this study add?
CVD risk tools considering a diagnosis of SLE did not result in a sufficient improvement in predictive accuracy for CVD development over existing traditional tools.
CVD risk tools considering a diagnosis of SLE did calculate relatively higher risk scores than those that did not; however, this did not result in a sufficient improvement in predictive accuracy for CVD development.
How might this impact on clinical practice or future developments?
Since there was not an outstanding CVD risk prediction tool identified by this analysis, when clinicians are looking to use an instrument to predict CVD in patients with SLE, ease of calculation, sensitivity, specificity and access to laboratory data must be considered.
More research and optimisation are needed to either develop new or improve existing CVD risk prediction tools, with particular focus on assessment of external validity (generalisability) of CVD prediction tools.
Introduction
Patients with SLE are at an increased risk of accelerated cardiovascular disease (CVD) compared with the general population.1–7 While the original Framingham Risk Score (FRS), developed in 1998,7 refers only to angina, myocardial infarction (MI) and congestive heart failure (CHF), the newest version of the FRS in 2008 incorporated as well transient ischaemic attack (TIA) and cerebrovascular accident (CVA).8 Traditionally monitored risk factors such as age, hypertension, diabetes and smoking fail to appropriately predict CVD events in SLE.3 Research has shown that non-traditional risk factors such as prednisone dose,9 homocysteine, C reactive protein, proinflammatory high-density lipoprotein (HDL) and certain autoantibodies also play a role in accelerating the atherosclerotic process and are not captured in the current CVD risk tools.5 10 Several groups have reported the prevalence of coronary heart disease (CHD) in their lupus cohorts and have shown that female patients with lupus are fivefold to sixfold more likely to develop CHD and that female patients with lupus aged 35–44 are 52 times more likely to develop CHD than the general population of a large community-based study of CHD, Framingham Offspring Study.11 12 Moreover, SLE is recognised as an independent risk factor for CVD.13
Risk stratification tools are widely used in the general population for interventions, whether lifestyle modifications or pharmacological, for primary prevention of CVD. Pharmacotherapy is generally not indicated for those with low FRS (<10%). A wider range of patients are now eligible for statin therapy in the FRS intermediate-risk category (10%–19%) and in those with high FRS (>20%).14 For primary prevention with pharmacotherapy, and related risk reduction percentages stratified to each risk category for the general population, the greatest benefits have been shown in patients in the high-risk category (number needed to treat (NNT) 35) and in the intermediate-risk category (NNT 40). The latter group’s indication for treatment relies on certain lipid profile parameters for treatment to be met.14 Further research would need to be done to better define treatment thresholds and outcomes in patients with SLE. Despite knowledge of the increased risk of CVD in SLE, there are no validated, widely used risk assessment tools in the primary prevention of CVD in SLE. Moreover, previous studies confirmed the suboptimal performance of the Framingham risk factors tool in SLE.3 9 Currently available cardiovascular risk assessment tools must be assessed to determine which most accurately predicts the development of CVD in this vulnerable population.
The risk assessment tools examined in this study include the QRISK2,15 QRISK3,16 SLE Cardiovascular Risk Equation (SLECRE),17 FRS8 and modified Framingham Risk Score (mFRS).18 In this study, we investigated a large cohort of patients with SLE to determine the utility of these cardiovascular risk assessment tools to best predict the development of CVD in patients with SLE.
Methods
Study population
This was a retrospective analysis on prospectively collected adult patient data from the University of Toronto Lupus Clinic. All patients fulfilled the 1997 American College of Rheumatology19 classification criteria or had three criteria and a confirmatory skin or renal biopsy. Patients were followed every 2–6 months between 1970 and 2017 and underwent a thorough clinical history, physical examination and laboratory investigations according to a standard protocol.20
Information on cardiovascular risk factors (hypertension, smoking status, diabetes, cholesterol) necessary to compute the risk scores and outcomes was identified from the data. Patients were excluded if they had a history of CVD prior to enrolment at the clinic. First identified CVD event classified patients as ‘CVD patients’, and patients without a CVD event throughout the follow-up period were classified as ‘no CVD patients’.
Definition of CVD event
CVD was defined by the physician in accordance with the 2008 Framingham study as a composite of (1) CHD including coronary death, MI, coronary insufficiency and angina; (2) atherosclerotic CVA including ischaemic stroke, haemorrhagic stroke and TIA; (3) peripheral artery disease (PAD) secondary to atherosclerosis (intermittent claudication); and (4) heart failure secondary to atherosclerosis.8
CVD risk prediction tools
Although the CVD risk prediction tools have very similar components, their performances may differ because they use different risk derivation algorithms and the same components are weighted differently among the tools. See online supplemental table S2 for comparison and contrast of all risk prediction tools.
Supplemental material
FRS: includes age, sex, treatment for hypertension, diabetes status, smoking status, HDL cholesterol, total cholesterol and systolic blood pressure.8
mFRS: mFRS calculator applies a two times multiplier to the FRS for a patient with an SLE diagnosis.15
QRISK2: includes age, sex, ethnicity, Townsend score (measure of material deprivation within a population), smoking status, diabetes status, family history of CVD (angina or heart attack in a first-degree relative younger than 60), chronic kidney disease, atrial fibrillation, blood pressure treatment, rheumatoid arthritis (RA), HDL cholesterol, total cholesterol, systolic blood pressure, height and weight.15
QRISK3: examines the same factors as QRISK2, with the addition of migraine, SLE, severe mental illness (schizophrenia, bipolar disorder, moderate/severe depression), atypical antipsychotic use, corticosteroid use, diagnosis or treatment of erectile dysfunction and SD of repeated blood pressure.16
SLECRE: includes age, sex, systolic blood pressure, cholesterol, smoking status, diabetes, mean SLE Disease Activity Index score of 2 or more, history of lupus anticoagulant and low mean C3 in generating a 10-year CVD risk.17
Risk factor data collection
The date of data collection necessary to compute a risk score was the ‘index date’. The index date for patients who had CVD was defined as the closest visit 10 years prior to the CVD event and for patients who did not have a CVD event the closest visit 10 years prior to the patient’s current clinic visit. For patients who had less than 10 years of follow-up, the index date was defined as the cohort enrolment date. The SLECRE was designed for data collection and risk prognostication at the date of enrolment in a clinic; however, this is not in keeping with the design of the other tools assessed. A sensitivity analysis was performed calculating all risk scores from the time of clinic enrolment for all patients.
Most of the data necessary to compute each risk score were regularly collected at clinic appointments. Data on HDL cholesterol were not regularly collected until 1991 (21% were missing prior to imputation). Since missing data on HDL were solely based on the test’s availability but not patients’ characteristics, we assumed these missing were missing at random. A mean HDL cholesterol level was imputed based on group assignment (CVD or no CVD). Similar imputations were performed for weight and height for the basis of body mass index (BMI) calculations, which were not regularly collected until 1977 and 1994, respectively.
Information on several risk factors related to QRISK, including atrial fibrillation, migraine, RA, atypical antipsychotic use, diagnosis or treatment of erectile dysfunction, and severe mental illness, was not captured in the protocol. Data on the first five aforementioned factors were extracted by chart review using analysis of a subgroup of 224 patients, which comprised both CVD patients and no CVD patients. The proportion of CVD patients and no CVD patients identified having each risk factor was used to impute the presence of this risk factor for the patients remaining in that subgroup. For severe mental illness, we used the 36-Item Short Form Survey (SF-36) within 1 year of the index date, collected since 4 January 1994. In order to capture severe depression, we used modified criteria of both a mental health subdomain score ≤56 and a mental component score ≤40, rather than just one or the other.21 Severe mental illness for patients missing the SF-36 (n=360) was imputed from the data on CVD patients and no CVD patients by the same proportion (n=480). Data on family history of CVD and Townsend score were not gathered and calculated in the QRISK3 score; however, these risk factors have little impact on the final risk score.16
Statistical analysis
A CVD risk score for each patient was calculated at the index date using all five tools and evaluated against whether there was development of CVD at the 10-year point. The number of patients classified as low risk (<10% 10-year CVD risk), intermediate risk (10%–20%) and high risk (>20%) was determined and compared for each risk tool. The sensitivities, specificities, and positive and negative predictive values of these risk tools are reported, dichotomising risk scores using a cut-off of 10% 10-year CVD risk, as in other studies.22 The discriminative ability of each tool was evaluated using the concordance (c) statistics, where c is the area under the curve (AUC) of the receiver operating characteristic curve from logistical regression with observed CVD as the outcome. Kappa statistics were used to observe the similarities among tools on high-risk categories assigned by each tool. Contextually, c-statistics of 0.5 suggests no discrimination, 0.7–0.8 is considered acceptable, 0.8–0.9 excellent and greater than 0.9 outstanding.23
Three sensitivity analyses were performed to assess the difference in results if the exact paradigms in particular risk calculation derivation studies were followed, as opposed to the methods described above. The first sensitivity analysis was performed calculating the risk scores for CVD patients and no CVD patients at the time of patient enrolment in the Toronto Lupus Cohort as per the original SLECRE protocol, censoring data at 10 years after enrolment. This is opposed to 10 years prior to the CVD event for CVD patients and 10 years prior to the most recent clinic visit for no CVD patients in this study. The algorithms used to calculate the risk scores are the same as the primary analysis, as well as the performance assessments and comparisons. In a second sensitivity analysis, only cardiovascular events used in the derivation of the mFRS (angina, MI, CVD death) were examined. Thereby TIA, CVA and PAD were excluded from the CVD definition. This analysis was done to assess the impact of a different CVD outcome being used in the derivation of a particular CVD risk calculator, as in the mFRS, as opposed to the more inclusive CVD outcome used in this study, in line with the FRS definition.8 15 In a third sensitivity analysis, only patients with age older than 25 years (at the index date) were included since QRISK2 was designed for at least 25 years.
Results
Of the 1935 patients in the cohort, 48 were excluded (45 patients had CVD events prior to enrolment and 3 patients had large gaps between visits that were longer than 10 years). The final cohort size was 1887. Out of the 1887 patients in the study, 1147 (60.8%) did not have 10-year follow-up (CVD patients 55.6% vs no CVD patients 61.5%) and hence their first visits were used as the index date. The median (IQR) years from index dates to CVD or last visits (no CVD patients) were 8.0 (3.0–17.0) and 7.0 (3.0–14.0) years. The mean follow-up time for the cohort from SLE clinic enrolment was 9.5±7.2 years.
Patient characteristics at index date are summarised in table 1. Particular variables of interest include the CVD patients being on average older in age (47.6±13.5 years vs 37.4±15.0 years), having higher cholesterol levels (5.3±1.0 mmol/L vs 4.8±1.1 mmol/L), higher blood pressure (132±21 mm Hg vs 120±18 mm Hg) and BMI (27.1±4.7 vs 25.0±4.5), and greater proportion with a history of lupus anticoagulant (82 (35%) vs 346 (21%)) and glucocorticoid treatment (163 (70%) vs 994 (60%)). Out of the 1887 patients identified in our cohort, there were 232 CVD events (see table 2 for breakdown of CVD events). Of the 232 CVD events which occurred over five decades, the incidence rates by each 1000 patient-years are 14.0 in the 1970s, 9.9 in the 1980s, 11.6 in the 1990s, 7.4 in the 2000s, and 6.3 in the 2010s. Drug use for antihypertensives, statins and aspirin over the study period is presented in online supplemental table S1.
Descriptive statistics of patients (N=1887)
Breakdown of cardiovascular events seen in patients with CVD
Among the no CVD patients, the mean 10-year CVD risk scores for the FRS, mFRS, QRISK2, QRISK3 and SLECRE were 3.1%, 6.3%, 2.5%, 8.2% and 12.0%, respectively (figure 1). Conversely, the mean 10-year CVD risk scores for CVD patients were 6.9%, 13.8%, 5.8%, 12.8% and 19.3%, respectively (figure 1).
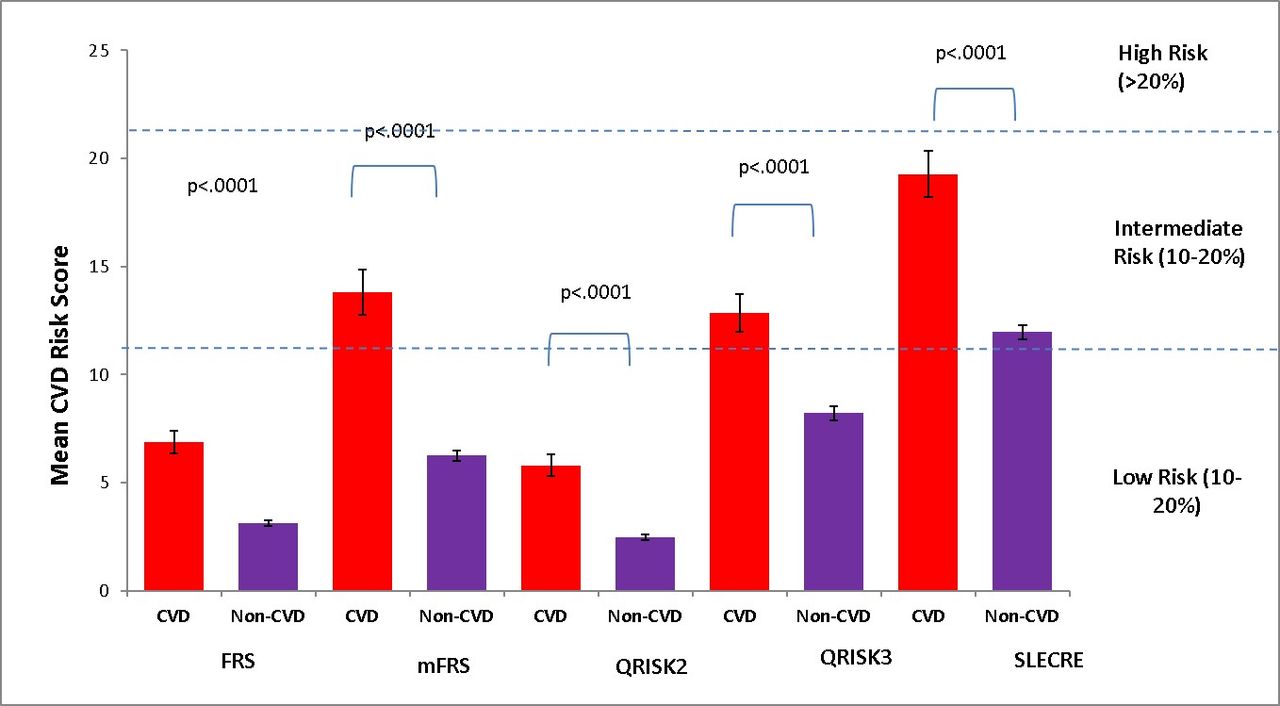
Mean CVD risk score (%±SD) for FRS, mFRS, QRISK2, QRISK3 and SLECRE, stratified according to patients with CVD (n=232) and patients without CVD (n=1655). CVD, cardiovascular disease; FRS, Framingham Risk Score; mFRS, modified Framingham Risk Score; SLECRE, SLE Cardiovascular Risk Equation.
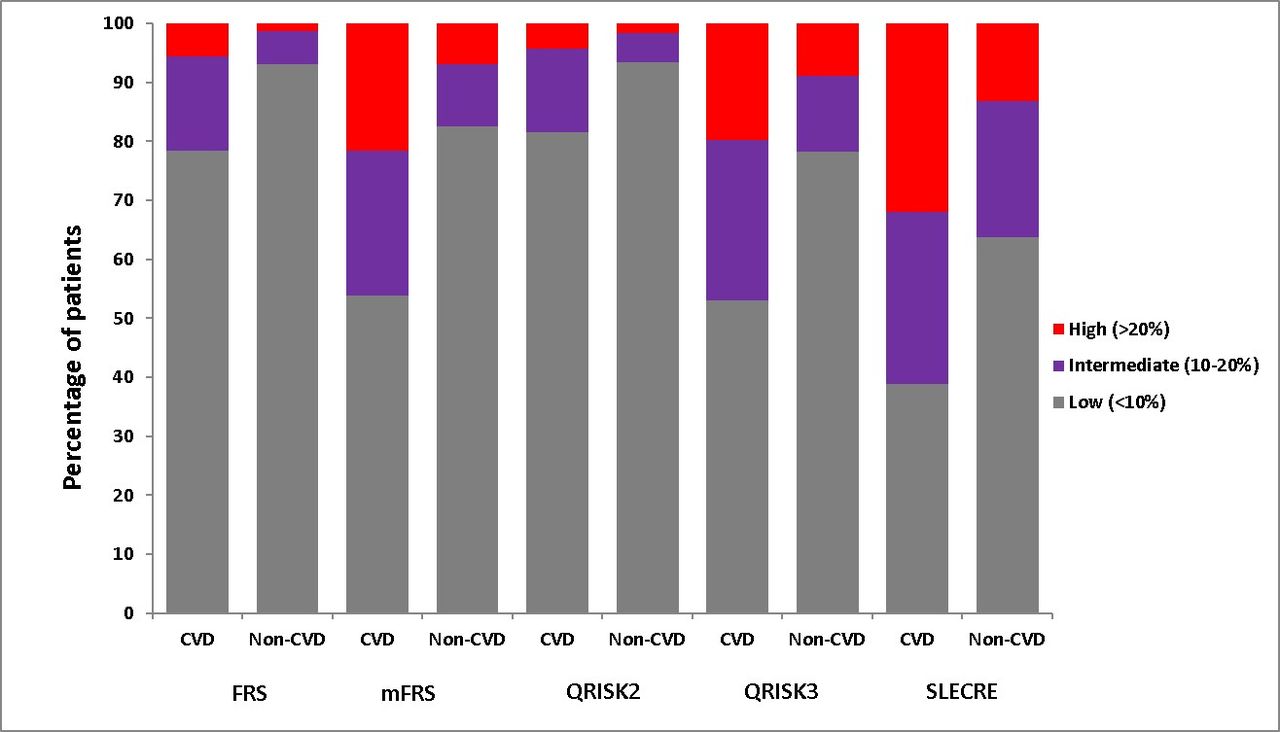
When examining risk stratification, the QRISK2 and FRS similarly classified the most patients as low risk, with the proportions of CVD patients and no CVD patients being 81% and 93% (QRISK2) and 78% and 93% (FRS), respectively (figure 2). The SLECRE classified the most patients as intermediate and high risk. For this tool, the proportion of CVD patients classified as intermediate risk was 29% and as high risk 32%. For the no CVD group, the percentages of patients classified as intermediate and high risk were 23% and 13%, respectively. The QRISK3 and mFRS similarly classified an intermediary proportion of CVD and no CVD patients as intermediate and high risk, being 27% and 13% (QRISK3) and 25% and 10% (mFRS), respectively, compared with the other tools.

Percentage of patients considered low (<10%), median (10%–20%) and high (>20%) risk between patients with CVD (n=232) and patients without CVD (n=1655) according to FRS, mFRS, QRISK2, QRISK3 and SLECRE. CVD, cardiovascular disease; FRS, Framingham Risk Score; mFRS, modified Framingham Risk Score; SLECRE, SLE Cardiovascular Risk Equation.
Tool performance
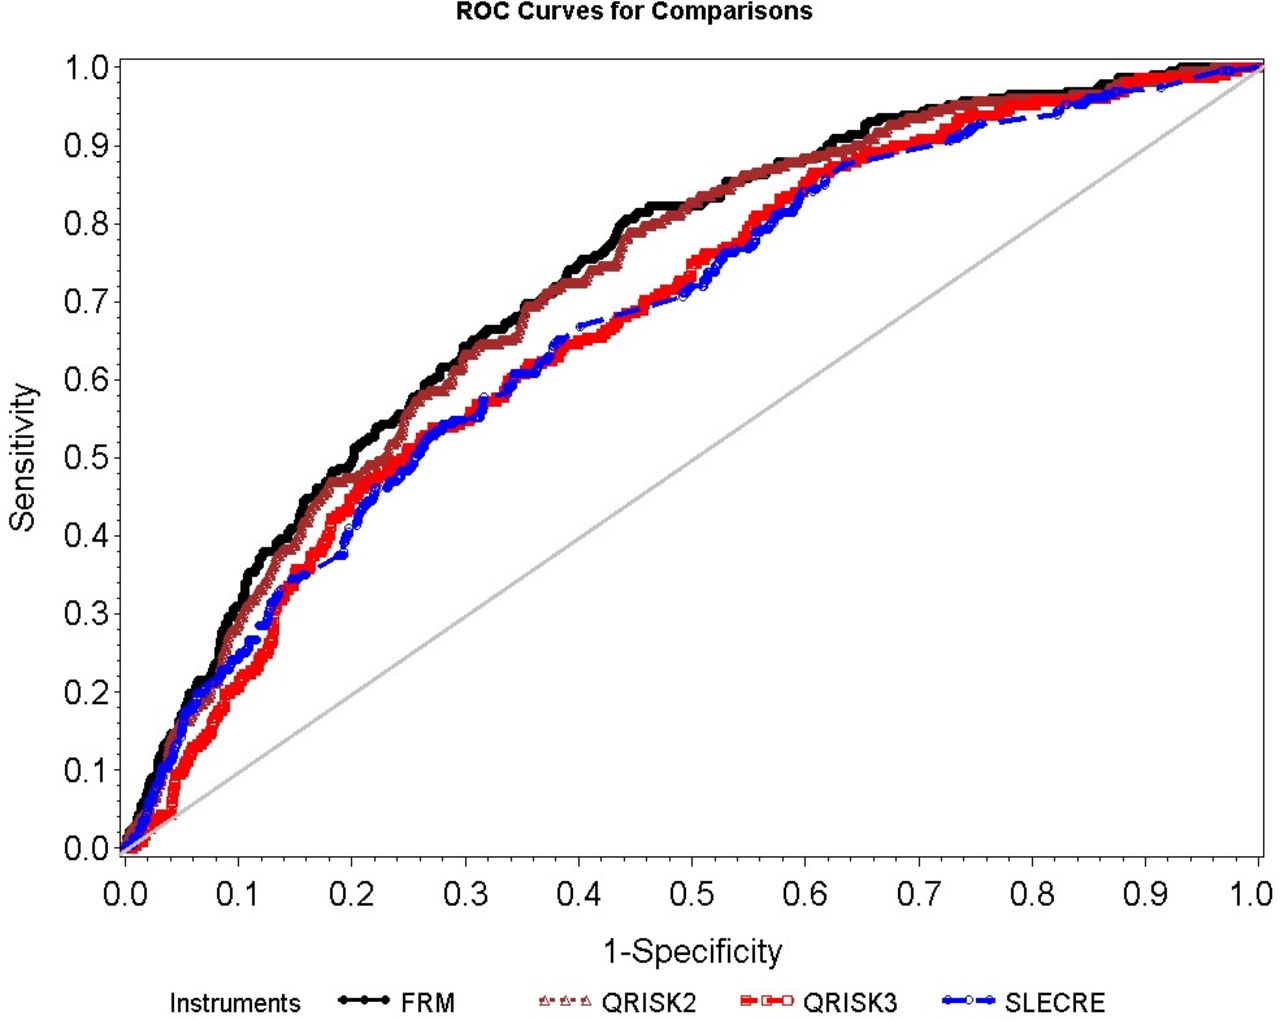
Table 3 lists the sensitivity, specificity, positive predictive value and negative predictive value of each tool. The QRISK2 had the greatest specificity of 93.4% but the lowest sensitivity (18.5%), and the SLECRE had the greatest sensitivity of 61.2% but the lowest specificity (63.7%). The FRS, mFRS and QRISK2 had the greatest AUC, 0.73, 0.73 and 0.72, respectively, and the QRISK3 had the lowest at 0.67. The SLECRE had c-statistics of 0.67 (figure 3).
Receiver operating curve (ROC) for FRS, mFRS, QRISK2, QRISK3 and SLECRE. FRS and mFRS have the same ROC curve. FRM refers to both the FRS and the mFRS as they have the same ROC. FRS, Framingham Risk Score; mFRS, modified Framingham Risk Score; SLECRE, SLE Cardiovascular Risk Equation.
Sensitivity, specificity, PPV, NPV and c-statistics of FRS, mFRS, QRISK2, QRISK3 and SLECRE
The QRISK2 and FRS had the greatest agreement, with a kappa of 0.65 (95% CI 0.59 to 0.71; table 4). Conversely, the QRISK2 and SLECRE had the least agreement, with kappa statistics of 0.20 (95% CI 0.17 to 0.24; table 4).
Kappa coefficient (lower and upper 95% CI) demonstrating agreement between QRISK3, QRISK2, FRS, mFRS and SLECRE
Sensitivity analyses
The first sensitivity analysis calculated the risk scores for CVD patients and no CVD patients at the time of patient enrolment in the Toronto Lupus Cohort (see online supplemental table S3 for descriptive statistics). There were 133 CVD patients classified under this paradigm as compared with 232 in the main analysis (online supplemental table S4). Of the patients, 48% with CVD and 40% without CVD had at least 10 years of follow-up from the date of enrolment, respectively. All risk stratification tools’ c-statistics had marginal improvement under this sensitivity analysis, except for the SLECRE. No significant differences in the performance of the risk tools were seen between this sensitivity analysis and the primary analysis (online supplemental figures S1–S3 and tables S5 and S6).
The second sensitivity analysis examined the performance of mFRS including only angina, MI and CVD death. The c-statistics, sensitivity and specificity for the mFRS in this analysis were 0.74, 46.1% and 81.3%, respectively. The performance of mFRS did not deteriorate in this sensitivity analysis.
In the third sensitivity analysis, 409 (21.7%) patients had index age <25 years (20.5±2.5, with a median of 19.9 years) and were excluded. We found that the risk scores and score categories are similar in the cohort excluding patients younger than 25 compared with the original analysis; hence, patients younger than 25 do not have a big impact on the performance of QRISK2 and QRISK3 (results not shown).
Discussion
This is the first study to examine the QRISK2, QRISK3, SLECRE, Framingham and modified Framingham on a large SLE cohort linked to CVD outcomes. This study was a single-centre analysis of prospectively collected data of 1887 patients with SLE, 232 of whom had a CVD event. The 12.3% prevalence of CVD and the incidence of 8.3 per 1000 person-years in our cohort match the literature.12 13 In this study, we determined which of the five CVD risk tools most accurately predicts CVD in patients with SLE. Our results showed that CVD risk tools considering a diagnosis of SLE did calculate relatively higher risk scores than those that did not; however, this did not result in a sufficient improvement in predictive accuracy for CVD development.
The results of the AUC confirmed that these tools are not very different in their ability to predict CVD in patients with SLE. The FRS, mFRS and QRISK2 had the greatest c-statistics; however, when examining sensitivity and specificity, there are differences between each of these tools. These three risk tools all had high specificities, but low sensitivities, with the mFRS demonstrating the greatest sensitivity of 46.1%, with a modest compromise in specificity, compared with the other tools. The QRISK2 and FRS have such high specificity (93%) because they categorised the greatest proportion of patients as low risk, minimising the number of false positives identified for high CVD risk. With that came poor sensitivity, as there were many false negatives identified. The SLECRE had the greatest sensitivity (61%), but also had the lowest specificity (64%). The FRS and mFRS had identical c-statistics.
Different CVD risk tools have been examined in patients with SLE in prior studies24 where the FRS and SLECRE were compared, and the SLECRE was found to be superior to the FRS and consistent with the mFRS; however, this study only looked at the recategorisation of patients from low risk (≤20% 10-year CVD risk) to high risk (>20% 10-year CVD risk) according to the different tools. These data were not linked to CVD outcomes and so do not demonstrate the predictive ability of these tools. Additionally, as increasing numbers of prediction tools are being developed, there are calls for more studies that validate these prediction models.25 Furthermore, the lower c-statistics and sensitivities demonstrated in this study compared with the literature evaluating these tools on the general population demonstrate the need to further refine CVD risk assessment tools for SLE populations.25
We have shown disagreement among these tools. The kappa statistics demonstrate this, with the QRISK2 and FRS having the greatest agreement of any pair of tools, yet only having kappa statistics of 0.65, signifying a ‘moderate’ to ‘substantial’ level of agreement.19 20 Meanwhile, the QRISK2 and SLECRE had an agreement of 0.20, representing slight to no agreement. Thus, these disagreements can have direct implications on preventive treatment and provide insight into risk management by physicians treating patients with SLE. For example, in the general population, a wide range of patients with FRS ≥10% will be eligible for statin therapy to target a low-density lipoprotein cholesterol <2.0 mmol/L or >50% reduction.11 If there can be so much restratification of CVD risk according to these different tools, this can be representative of a physician’s appraisal of their patients’ CVD risk. If one physician applies the FRS to determine their patients’ CVD risk, they may under-rate their risk compared with another physician who applies the SLECRE. These different approaches could lead to different management to the benefit or detriment of the patient.
There are some limitations to our study. Data on both the Townsend deprivation index and family history of angina or heart attack in a first-degree relative younger than 60 were missing in calculating the QRISK3 score. The weighting of the Townsend score in the QRISK3 score is only 0.077 when calculating the HR to determine the 10-year CVD risk, which is relatively inconsequential, especially compared with a weighting of 1.72 for type 1 diabetes or 0.759 for SLE.13 The Townsend deprivation index is a measure of material deprivation specific to the UK population, calculated using four census variables for a geographical area.16 This metric is used as a marker of socioeconomic status (SES), where an association between low SES and increased CVD has been clearly demonstrated.26 Local metrics of SES such as the 2011 Ontario Marginalization Index or the 2006 Canadian Marginalization Index were not used as substitutes for the Townsend score as they are not directly comparable. Data on family history of CVD were only captured regularly in our protocol after 1999. A subset analysis was performed on 642 patients with family history data collected, comparing their QRISK3 scores with and without this variable, and in 121 CVD patients the mean difference in score was 0.87% and in 521 no CVD patients the mean difference in score was 1.24%. The weighted score of this parameter is 0.454 in calculating the QRISK3 HR to determine 10-year CVD risk, and its exclusion resulted in slightly under-rated CVD risks. Additionally, we did not have data collected on severe mental illness diagnoses; however, we used SF-36 data that were available on 360 patients to determine severe mental illness status, as done in other studies.21 For the missing data on 480 patients, imputation was performed. This could result in patients being randomly assigned to having severe mental illness. However, the relative weighting of severe mental illness in the QRISK3 is minimal compared with other components of this risk tool, resulting in a minimal change in risk score. Lastly, we used the Framingham definition in order to define CVD in our cohort selection. In the derivation and validation of the mFRS, coronary artery disease was examined, resulting in only angina, MI, CHF, CVD death and pacemaker insertion related to CAD to identify CVD.18 Stroke, MI, angina/coronary artery bypass graft and claudication were the only factors used to identify CVD in deriving the SLECRE. Finally, QRISK2 and QRISK3 did not include PAD or heart failure secondary to atherosclerosis in deriving their algorithms but included all of the other FRS CVD events in their definition. We aligned our definition of CVD with the FRS 20088 because it is the most established CVD risk tool available and it was inclusive of all CVD outcomes, thus creating the largest possible unified outcome for comparing tools’ performances and agreements. This comes with the caveat of including CVD outcomes in our analysis that were not used to derive the original risk tools. However, as seen above, each tool uses a different definition of CVD, necessitating a common definition that may not exactly match each individual tool. A sensitivity analysis was performed examining the predictive ability of the mFRS with angina, MI, CVD death excluding TIA, stroke and PAD, and there were no significant differences in sensitivity, specificity or c-statistics when compared with the original analysis, which included all events according to FRS 2008.8 Accordingly, we believe that although different CVD definitions were used by each tool, using the FRS 2008 definition4 of CVD would not have substantively affected the results. All tools’ c-statistics marginally improved under this sensitivity analysis examining patient risk scores at the date of enrolment in the Toronto Lupus Clinic, except for the SLECRE. We are aware of the 2013 American College of Cardiology/American Heart Association CVD risk calculator; however, the calculator’s age cut-off of 40–79 would have attenuated the cohort for analysis.27
Conclusions
Assessing CVD risk in inflammatory disease, especially lupus, is very important given the CVD burden in this patient population, and such prediction tools have an invaluable benefit in helping to risk-stratify patients and guide primary preventive therapy.25 Since there was not an outstanding performer identified by this analysis, when clinicians are looking to use an instrument to predict CVD in patients with SLE, ease of calculation, sensitivity, specificity and access to laboratory data must be considered.
In conclusion, we have shown that some of the most widely used tools do not achieve robust sensitivity, specificity and accuracy in patients with SLE. The FRS has been repeatedly shown in the literature to be a poor predictor of CVD in SLE.2 18 In contrast to this, the QRISK2 and QRISK3 have many variables that must be ascertained, some of which would require laboratory investigations and thorough historical investigations into the patient, which may not always be feasible in the clinical setting. Additionally, the QRISK3’s lack of marginal benefit in predictive ability makes it not an ideal choice for predicting CVD in SLE. The SLECRE showed the highest sensitivity, but had the lowest specificity and second lowest c-statistics, making it also less than ideal. Of the tools studied, the mFRS was the best performer given its c-statistics, sensitivity and specificity, and is reasonable given the ease with which it can be calculated. More research and optimisation are needed to either develop new or improve existing CVD risk prediction tools. Using larger SLE cohorts or combining large cohort studies such as the Pittsburgh or Baltimore cohorts may allow the derivation of a more refined predictor of CVD in SLE.
Data availability statement
All data relevant to the study are included in the article or uploaded as supplementary information.
Ethics statements
Ethics approval
This research study was approved by the University Health Network Research Ethics Board (REB study #11-0397). All individuals have provided written informed consent for this research study.
References
Supplementary materials
Supplementary Data
This web only file has been produced by the BMJ Publishing Group from an electronic file supplied by the author(s) and has not been edited for content.
Footnotes
Contributors All authors were involved in the study conception and design, acquisition of data, and analysis and interpretation of data. ZT had full access to all of the data in the study and takes responsibility for the integrity of the data and the accuracy of the data.
Funding This project is supported by the Lupus Foundation of America Gina M Finzi Student Fellowship received by JS. The Toronto Lupus Program is supported financially by the Lou Rocca Family, Bozzo Family and Lupus Ontario.
Competing interests None declared.
Provenance and peer review Not commissioned; externally peer reviewed.
Supplemental material This content has been supplied by the author(s). It has not been vetted by BMJ Publishing Group Limited (BMJ) and may not have been peer-reviewed. Any opinions or recommendations discussed are solely those of the author(s) and are not endorsed by BMJ. BMJ disclaims all liability and responsibility arising from any reliance placed on the content. Where the content includes any translated material, BMJ does not warrant the accuracy and reliability of the translations (including but not limited to local regulations, clinical guidelines, terminology, drug names and drug dosages), and is not responsible for any error and/or omissions arising from translation and adaptation or otherwise.