Article Text

Abstract
Objective T cells display significant phenotypical changes and play multiple roles in promoting the immune response in SLE. The frequencies of T cell subpopulations in SLE are still not well understood. To better understanding the phenotypic abnormalities of T cells in SLE will help us to clarify disease immunopathology and to find promising biomarkers for disease monitoring and control.
Methods Peripheral blood CD4+ and CD8+ T cells and their subsets were determined by flow cytometry. Forty-one active SLE patients were selected, including 28 new-onset patients and 13 relapsing patients. One hundred healthy controls (HCs) were enrolled as the control group. The percentages of these cell subsets between patients with SLE and HCs and their relationships with disease activity and autoantibody titers were analysed. Thirteen of 28 new-onset SLE patients were assessed before and after treatment. The changes in the frequencies of these cell subsets and their relationships with renal response were analysed.
Results There was a broad range of anomalies in the proportion of T cell subsets in patients with SLE compared with that of the HCs. Compared with the HCs, a higher frequency of memory T cells and a lower frequency of naïve T cells were noted in patients with SLE. In addition, an imbalance of CD28+ and CD28− cells in CD4+ T cells was observed in patients with SLE. We found that the expanded CD4+CD28− T cells did not decrease after treatment in patients who had impaired renal responses. It was very interesting to exhibit a negative correlation in the frequency between the CD4+CD28− T cells and T regulatory (Treg) cells and a positive correlation between the frequency of CD4+CD28+ T cells and Treg cells in this study. Increased CD8+HLADR+ T cell and CD8+CD38+HLADR+ T cell counts were observed in patients with SLE, suggesting an impaired cytotoxic capacity of CD8+ T cells in SLE. Additionally, we found that CD8+CD38+HLADR+ T cells were closely associated with disease activity, autoantibody titres and renal prognosis. CD4+ CXCR5−PD1+ T cells were expanded in patients with SLE in this study and were associated with disease activity in SLE. Th1 (T helper type 1) cells and Treg cells were decreased, but frequencies of T follicular helper (Tfh) cells, Th2 cells, Th17 cells and Tfh17 cells were increased. A strong correlation between Th17 cells and Tregs with renal involvement was observed in this study.
Conclusion The proportions of CD4+CD28− T cells, CD4+CXCR5−PD1+ T cells, CD8+HLADR+ T cells and CD8+CD38+HLADR+ T cells increased in patients with SLE and could be associated with disease activity and renal prognosis.
- lupus erythematosus, systemic
- T-lymphocytes, helper-inducer
- lupus nephritis
Data availability statement
All data relevant to the study are included in the article or uploaded as supplementary information.availability statementavailability statement Data underlying the findings described in this manuscript are uploaded as supplemental information.
This is an open access article distributed in accordance with the Creative Commons Attribution Non Commercial (CC BY-NC 4.0) license, which permits others to distribute, remix, adapt, build upon this work non-commercially, and license their derivative works on different terms, provided the original work is properly cited, appropriate credit is given, any changes made indicated, and the use is non-commercial. See: http://creativecommons.org/licenses/by-nc/4.0/.
Statistics from Altmetric.com
WHAT IS ALREADY KNOWN ON THIS TOPIC
T cells play an indispensable role in the occurrence and development of SLE. Abnormalities in signalling pathways and gene transcription of T cells in SLE lead to an obvious phenotypic change in T cells. A comprehensive understanding of the phenotypic abnormalities of T cells in SLE could help us to clarify disease immunopathology and to find promising biomarkers for disease monitoring and control.
WHAT THIS STUDY ADDS
We analysed the frequency of subtypes of CD4+ and CD8+ T cells and their frequency changes after treatment.
Forty-one active patients with SLE were selected, including 28 new-onset patients and 13 relapsing patients. Thirteen of these 28 new-onset SLE patients were assessed before and after treatment.
The proportions of CD4+CD28− T cells, CD4+CXCR5−PD1+ T cells, CD8+HLADR+ T cells and CD8+CD38+HLADR+ T cells increased in patients with SLE and could be associated with disease activity and renal prognosis.
HOW THIS STUDY MIGHT AFFECT RESEARCH, PRACTICE AND/OR POLICY
These phenotypical changes of T cells provided clues to potential biomarkers for disease monitoring and therapeutic targets for SLE. However, further in-depth research with large sample size is necessary to verify the role of these phenotypical changes in SLE.
Introduction
Systemic lupus erythematosus (SLE is a chronic, heterogeneous autoimmune disease involving multiple systems and organs.1 Immunologically, the major underlying pathogenesis of SLE is the breakdown of T and B lymphocyte tolerance and self-reactive B cells producing a large number of autoantibodies.2 T cells play an indispensable role in assisting B cells, secreting proinflammatory cytokines, infiltrating target tissues and amplifying inflammation, which contribute to the occurrence and development of SLE.3 4 Abnormalities in signalling pathways and gene transcription of T cells in SLE lead to an obvious phenotypic change in T cells.5 6 A better understanding of phenotypic abnormalities of T cells in SLE will help clarify disease immunopathology and provide clues to potential biomarkers for disease monitoring and control.
Based on the expression levels of the surface molecules CD4 and CD8, T cells can be divided into two subsets, CD4+ T cells and CD8+ T cells, each of which includes a variety of functional subclusters. Activated by antigen-presenting cells, naïve CD4+ T cells differentiate into lineages of T helper (Th) cells, including Th1, Th2, Th17, T follicular helper (Tfh) and T regulatory (Treg) cells.3 Previous studies have suggested that FoxP3+ Treg cells, generally described as CD4+CD25+CD127low/− in functional assays,7 8 have an immunosuppressive function and play an essential role in the maintenance of self-tolerance,9 while Th17 cells are expanded in kidney and skin lesions to promote local tissue inflammation in SLE.10 An imbalance in Th17/Treg expression leads to a pathogenic effect in SLE.11 Moreover, the Treg subsets have been identified, including FoxP3− Treg subsets.8 The heterogeneity within these Treg subsets is often identified by several specific cosignalling molecules and soluble factors.8 12 13 The distinct phenotype of these Treg subsets and their immune regulatory effects in SLE still remain to be explored. Tfh cells were reported to be a brand new subtype of CD4+ T cells, serving as mediators of B cell selection, proliferation and differentiation in immune organs.14 Aberrant expansion of Tfh cells is correlated with SLE progression.15 These phenotypic findings underlie the pathogenesis of SLE, providing some promise for SLE treatment.
In recent years, CD8+ T cells have gained increased attention for their role of SLE pathogenesis. CD8+ T cells are cytotoxic immune cells characterised by their cytolytic activities by releasing perforin and granzymes. Previous studies have suggested that patients with SLE display impaired cytolytic function of CD8+ T cells, resulting in an increased risk of infection and autoimmune response triggering.16 17 Katsuyama et al18 demonstrated that an expansion of CD8+CD38+ T cells in patients with SLE is linked to increased risk of infection and CD8+CD38+ T cells display decreased cytotoxic capacity by suppressing the expression of cytotoxic genes through an NAD+/sirtuin1/EZH2 pathway. Monoclonal antibodies targeting CD38 reduce autoantibody titres by eliminating long-lived plasma cells and restore the cytotoxicity of peripheral CD8+ T cells in two refractory SLE patients.19 Moreover, CD38 and HLADR expression levels on CD8+ T cells were known as activation markers, and the high frequencies of these subsets of CD8+ T cells suggested that the immune system was activated.20 21 However, HLADR and CD38 are recently recognised as immunomodulatory molecules of CD8+ T cells.22 23 Little information is still available on the role of CD8+HLADR+ T cells and CD8+CD38+HLADR+ T cells in SLE. In addition, Li et al24 noted that self-reactive CD8+ T cells can convert into double-negative T cells, behaving as a proinflammatory phenotype producing IL-17 to contribute to the pathogenesis of SLE.
Although a large number of investigations into T cell subsets have been reported over the past decade, the impact of different subsets on autoimmune responses in SLE remains unclear. Akahoshi et al25 suggested that Th1/Th2 imbalance, reflected in Th1 hyperactivity, contributes to the pathological changes in SLE while Amel-Kashipaz et al26 suggested that the proportion of Th2 cells is significantly increased in SLE. However, some studies have found that the levels of serum Th1 and Th2 cytokines are both increased in patients with SLE,27 suggesting a common pathogenic role of Th1 and Th2 cells. The frequency of multiple T cell subpopulations is not well understood in SLE due to their high complexities.
In this study, we analysed the frequency of subtypes of CD4+ and CD8+ T cells and their frequency changes after treatment to indirectly understand the differentiation status and cell activity changes in SLE. We aimed to assess the relationships of phenotypic abnormalities and disease activity, autoantibody titres and renal prognosis.
Materials and methods
Study population
Between August 2020 and July 2021, 154 patients were classified as having SLE who fulfilled at least four of the 1997 American College of Rheumatology (ACR) revised classification criteria for SLE28 at Guangzhou First People’s Hospital. Disease activity was assessed by the SLE Disease Activity Index 2000 (SLEDAI-2K).29 One hundred and two patients (66.23%) were defined as having active SLE with a SLEDAI-2K score of ≥4.30 At the 3 months before the initiation of this study, all of these active SLE subjects did not receive any kinds of vaccinations during the disease progression, including the COVID-19 vaccination. Forty-three patients who had received immunosuppressive or immunomodulatory drugs in the 6 months leading up to the study, 15 patients who had active infections when sampling and 3 patients with overlapping autoimmune diseases were excluded from this study. A total of 41 active SLE patients comprised the study population, including 28 new-onset patients and 13 relapsing patients free from immunosuppressive or immunomodulatory drugs for at least 6 months. Of these 28 new-onset SLE patients, we were able to assess 13 patients both before and after 24 weeks of treatment. The flow chart is shown in figure 1. In addition, 100 healthy controls (HCs) were enrolled as the control group. All of the HCs were collected from the physical examination centre. The inclusion criteria for HCs were being at least 18 years old, not receiving a vaccination and not suffering an infection in the 3 months leading up to the study, no current or chronic medication intake, no malignancy and no autoimmune diseases. Peripheral blood lymphocytes were tested with flow cytometry.

Flow chart for the selection process of the study population. SLEDAI, SLE Disease Activity Index.
Data collection
Clinical assessment data and demographic information were collected from admission records, including sex, age, duration of SLE, serological examinations, lupus disease activity and renal involvement. The laboratory data included antinuclear antibody, antidouble-stranded DNA (dsDNA) antibody, erythrocyte sedimentation rate, C reactive protein, complement 3 (C3), complement 4 (C4), immunoglobulin G, serum creatinine, serum albumin (ALB), 24-hour urine protein and urinalysis. The level of serum antinuclear antibody was measured by an ELISA test kit (EUROIMMUN Medizinische Labordiagnostika AG), and the positive cut-off value used was >12 U/mL. The level of serum anti-dsDNA antibody was measured by a chemiluminescence enzyme immunoassay test kit (EUROIMMUN Medizinische Labordiagnostika AG), and the positive cut-off value used was >30 IU/mL. The level of C3 was detected by an electrochemiluminescence assay test kit (SIEMENS), and a low C3 complement level was considered C3 <0.7 g/L.
Lupus nephritis (LN) was defined via renal biopsy or clinical and laboratory manifestations meeting the ACR criteria.31 Renal biopsy is routinely recommended when there is clinical evidence of renal involvement in our department. Complete renal remission after 24 weeks of induction therapy was defined as a 24-hour urinary protein excretion of 0.4 g or less, the absence of active urine sediment, serum ALB level of 35 g/L or greater and normal serum creatinine levels.32 Partial renal remission was defined as a ≥50% reduction in proteinuria and urine protein <3.5 g/24 hours, a level of ALB ≥30 g/L and a normal or ≤25% increase in serum creatinine level from baseline.32
Medications including glucocorticoid and additional immunosuppressive agents were also recorded. The dosage of glucocorticoid was defined as low doses (≤7.5 mg of prednisone-equivalent doses), medium doses (between 7.5 and 30 mg), high doses (>30 mg and up to 100 mg prednisone-equivalent per day), very high doses (>100 mg prednisone-equivalent per day) and pulse therapy(>250 mg prednisone-equivalent per day).
Flow cytometric analysis
Peripheral venous blood (5 mL) samples for T cell immunophenotype detection were collected with heparin sodium anticoagulant tubes and shaken immediately to ensure adequate mixing of blood and anticoagulant. Then, whole blood samples were stained directly with a panel of fluorochrome-conjugated monoclonal antibodies (mAbs) for incubation at room temperature for 15 min in the dark. The list of all mAbs is shown in online supplemental table 1. The categorisations of T cell surface markers are shown in online supplemental table 2. In this study, we analysed the phenotypes of the T cell subsets according to their surface molecules (including activation molecules and chemokine receptors). The surface marker CD127 was taken as an alternative to intracellular marker FoxP3 for isolating Treg cells in this study.33 After red blood cells were removed by adding 800 µL of lysis buffer, the cells were analysed by a BD FACS Canto flow cytometer (BD Biosciences, USA) according to the manufacturer’s instructions, and the data were analysed with FlowJo software (V.10).
Supplemental material
Statistical analysis
The Kolmogorov-Smirnov test was used to determine normal distribution of the data. The mean±SD or median (25th percentile, 75th percentile) is presented for continuous or non-normally distributed continuous data. Categorical variables are presented as the absolute count and percentage. Student’s t-test was used to compare the differences in continuous variables with normal distributions, and the Mann-Whitney U test was used for continuous variables with non-normal distributions between two groups. The χ2 test and Fisher’s exact test were used to compare the differences in categorical variables. Correlations between clinical parameters and the ratio of lymphocyte subtypes were tested using Pearson’s parametric correlation coefficient test or Spearman’s rank correlation coefficient test. The statistical significance of the frequency of lymphocyte subtypes before and after treatment was determined using Wilcoxon signed ranks test. Statistical analyses were performed using the SPSS software package, V.21.0. A p<0.05 was considered to be statistically significant.
Results
Clinical and demographic characteristics of patients with SLE
We measured the frequency of 37 T lymphocyte (T cell, CD4+ T cell and its 16 subsets, CD8+ T cell and its 17 subsets, double-positive T cell) subsets in 41 active SLE patients (40.20±17.41 years old and 34 women) and 100 HCs (42.20±16.22 years old and 81 women). The age and gender were not significantly different between patients with SLE and HCs. Representative cytofluorometric gating strategies and detailed examples of analyses for the subsets are presented in online supplemental figure 1. Table 1 shows the clinical and demographic characteristics of the patients. The median SLE duration was 2.00 months, ranging from 0.90 to 36.00 months. Of all of the patients, severe flares were noted in five patients (12.20%), while mild and moderate flares were both noted in 18 patients each (43.90%). Twenty-five patients (61.00%) were diagnosed as LN, and 20 patients underwent renal biopsy.
Clinical and demographic characteristics of the 41 active SLE patients
Aberrant phenotypes of T lymphocytes in patients with SLE
There was a broad range of anomalies in the proportion of T cell subsets in patients with SLE compared with the HCs. The immunophenotypic parameters that were differentially expressed in patients with SLE and HCs are summarised in figure 2. The proportions of T lymphocytes, including CD4+ T cells, CD8+ T cells and double-positive T cells, were not significantly different between patients with SLE and HCs (online supplemental figure 2). The proportions of CD4+ and CD8+ T cells at different stages of differentiation were also calculated. Compared with the HCs, we found that the naïve CD4+ T cells (CD3+CD4+CD45RA+CCR7+, figure 2A) were significantly decreased in patients with SLE, while the terminally differentiated CD4+ T cells (CD3+CD4+CD45RA+CCR7−, figure 2A) were significantly increased. This phenomenon was also detected in CD8+ T cells (figure 2G).

The distribution of peripheral T lymphocyte subsets between HCs and patients with SLE. (A) Proportions of naïve, terminally differentiated, central memory and effector memory CD4+ T cells were compared between patients with SLE and HCs. (B) The proportion of Treg cells was compared between patients with SLE and HCs. (C) Proportions of CD4+CD28+ T cells and CD4+CD28− T cells (D) were compared between patients with SLE and HCs. (E) The proportion of Tfh cells was compared between patients with SLE and HCs. (F) The proportion of CD4+CXCR5+ T cells was compared between patients with SLE and HCs. (G) Proportions of naïve, terminally differentiated, central memory and effector memory CD8+ T cells were compared between patients with SLE and HCs. Proportions of CD127+ effector memory CD8+ T cells (H), CD8+CD38+HLADR+ T cells (I) and (J) CD8+HLADR+ T cells (J) were compared between patients with SLE and HCs. (K) Proportions of CD28+ cells, HLADR+ cells and PD1+ cells among CD8+ T cells were compared between patients with SLE and HCs. Normally distributed continuous variables were compared using Student’s t-tests. Non-normally distributed variables were compared using the Mann-Whitney U tests. P value summary: *p<0.05, **p<0.01, ***p<0.001, ****p<0.0001. HCS, healthy controls; Tregs, T regulatory cells; Tfh cells, follicular helper T cells.
A reciprocal increase in memory T cells was noted in this study, indicating that SLE T cells exhibited an abnormal differentiation response. The CCR7+ memory CD4+ T cells (TCM, figure 2A), CD8+ TCM cells (figure 2G) and CCR7− memory CD8+ T cells (TEM, figure 2G) were all significantly increased in patients with SLE. In addition, CD8+CD127+ TEM cells (CD3+CD8+ CD45RA−CCR7−CD127+) were also significantly increased in SLE (figure 2H).
CD4+CD28− T cells (figure 2D), as a subpopulation with peculiar effector activities, were found to be significantly increased in patients with SLE, while CD4+CD28+ T cells (figure 2C) were significantly decreased. The proportion of CD4+CXCR5−PD1+ T cells (figure 2F) was significantly increased in patients with SLE. Furthermore, the proportion of Treg-negative regulatory cells (CD3+CD4+CD25+CD127low/−, figure 2B) was significantly decreased in patients with SLE.
It is worth noting that CD8+HLADR+ T cell (figure 2J) and CD8+ T cell coexpression of HLADR and CD38 (figure 2I) was significantly increased in SLE compared with the HCs. Abnormally elevated frequencies of CD8+HLADR+ T cells and CD8+CD38+HLADR+ T cells might play an important role in the pathogenesis of SLE.
Simultaneously, we evaluated the frequency of Tfh cells (Tfh1 cells, Tfh2 cells and Tfh17 cells), Tc cells (Tc1 cells, Tc2 cells a d Tc17 cells) and Th cells (Th1 cells, Th2 cells and Th17 cells), and the results are shown in figure 3. Total Tfh cells (CD3+CD4+CXCR5+, figure 2E) and the CXCR3−CCR6+ subset (Tfh17) cells (figure 3A) were found to be significantly increased in patients with SLE. The frequency of CD4+CXCR5+PD1+ T cells was not significantly different between patients with SLE and HCs. Th17 cells (CD3+CD4+CXCR5−CXCR3− CCR4−CCR6+, figure 3C) and Th2 cells (CD3+CD4+CXCR5−CXCR3−CCR4+, figure 3C) were significantly increased, while a significant decrease in Th1 cells (CD3+CD4+CXCR5−CXCR3+CCR4−, figure 3C) was found in patients with SLE in relation to HCs. No statistically significant difference in the frequency of Tc cells between patients with SLE and HCs was reported (figure 3B).
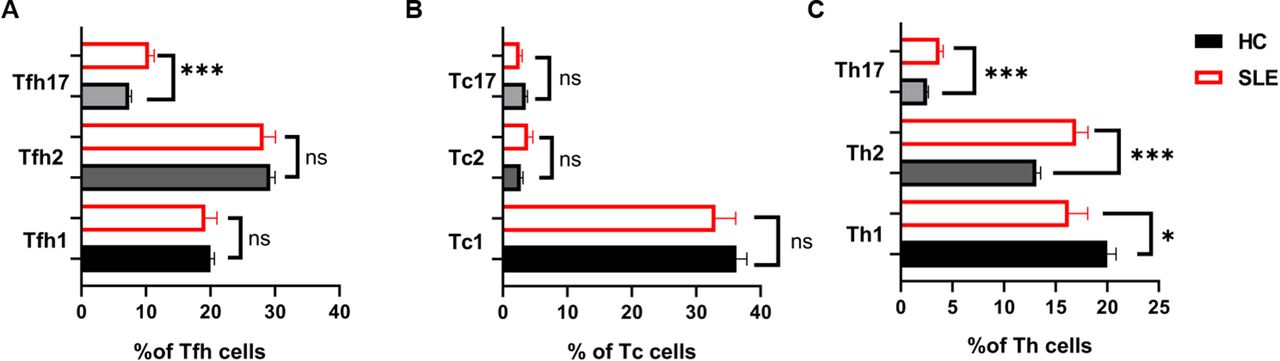
Differences in the percentages of Tfh cells, Tc cells and Th cells in the SLE and HC groups. Proportions of Tfh cells (Tfh1 cells, Tfh2 cells and Tfh17 cells) (A), Tc cells (Tc1 cells, Tc2 cells and Tc17 cells) (B) and Th cells (Th1 cells, Th2 cells and Th17 cells) (C) between SLE and HCs are shown. Normally distributed continuous variables were compared using Student’s t-tests. Non-normally distributed variables were compared using the Mann-Whitney U tests. P value summary: *p<0.05, **p<0.01, ***p<0.001. Th cells, helper T cells; Tc cells, cytotoxic T cells; Tfh cells, follicular helper T cells.
Correlations of T lymphocytes phenotypes with disease activity and autoantibody titre
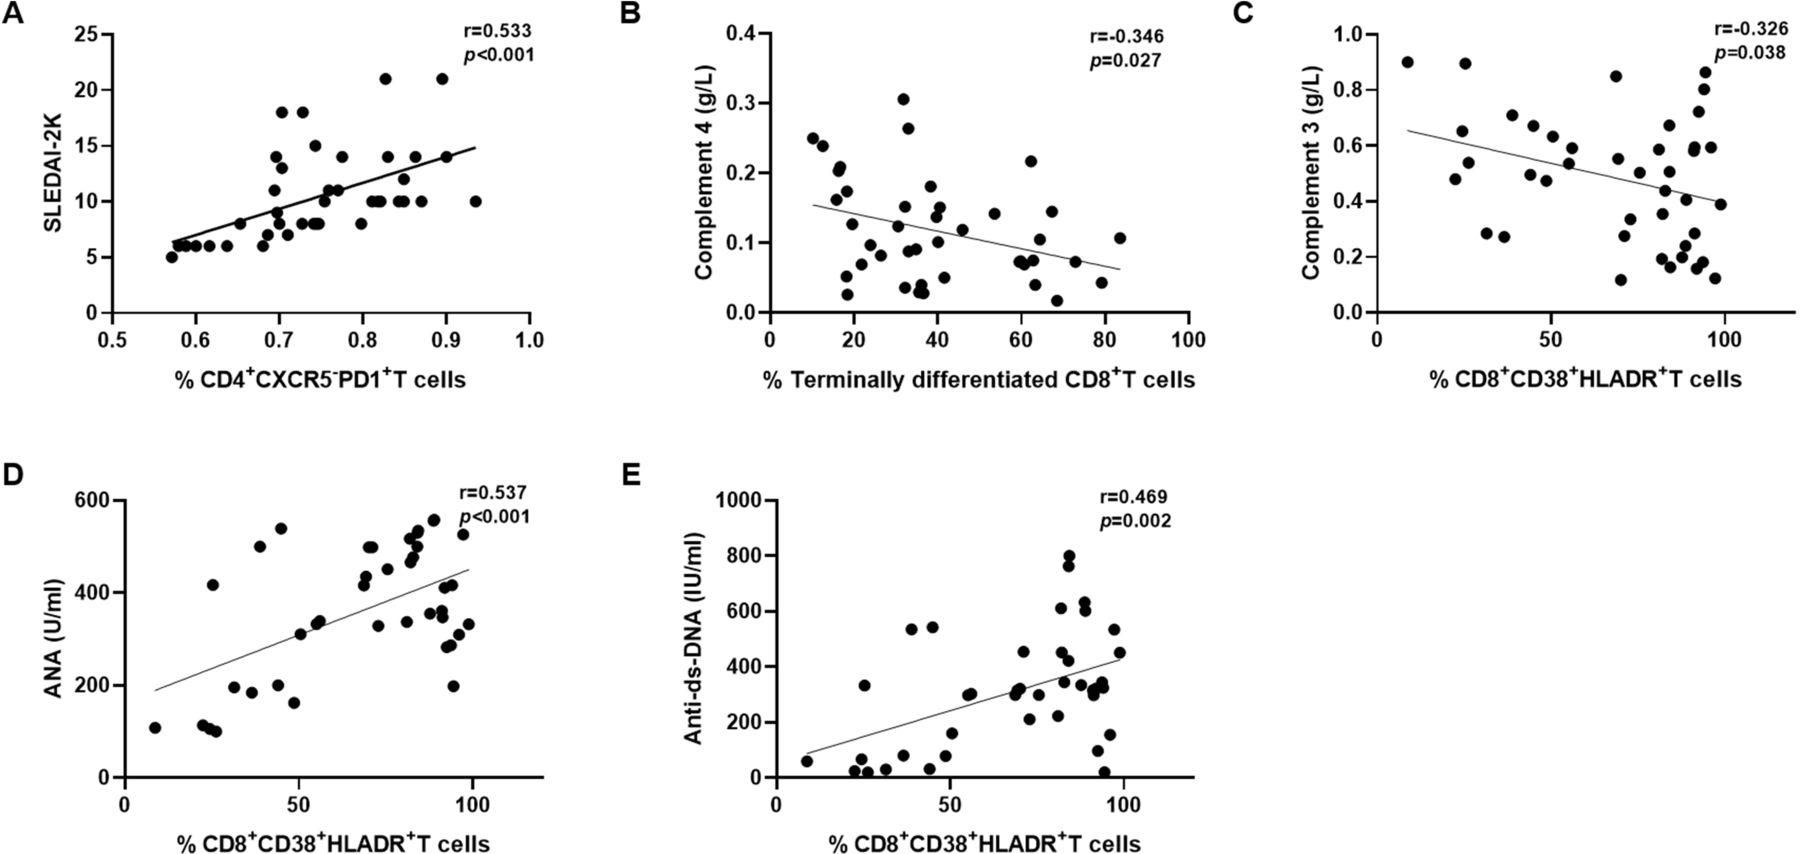
To understand whether these T cell subset imbalances are related to the disease activity of patients with SLE, we analysed the correlation between the frequency of T cell subsets and disease activity indicators (C3, C4 and SLEDAI-2K). On correlation analysis, a significant, positive correlation between CD4+CXCR5−PD1+ T cells and the SLEDAI-2K score (r=0.533, p<0.001) (figure 4A) was noted. Moreover, terminally differentiated CD8+ T cells showed a negative correlation with the level of C4 (r=−0.346, p=0.027) (figure 4B) and CD8+CD38+HLADR+ T cells showed a negative correlation with the level of C3 (r=−0.326, p=0.038) (figure 4C).

Correlations of peripheral T lymphocyte phenotypes with disease activity and autoantibody titre in patients with SLE. (A) The frequency of CD4+CXCR5−PD1+ T cells was associated with SLEDAI-2K scores. (B) The frequency of terminally differentiated CD8+ T cells was associated with the level of C4. The frequency of CD8+CD38+HLADR+ T cells was associated with the levels of C3 (C), ANA (D) and anti-dsDNA (E). Correlations of peripheral T lymphocyte phenotypes with disease activity and autoantibody titre were assessed using Spearman’s rank correlation coefficient. anti-dsDNA, antidouble-stranded DNA; C3, complement 3; C4, complement 4.
Then, we looked for an association between the frequency of T cell subsets and the titres of autoantibodies, including ANA and anti-dsDNA autoantibodies. CD8+CD38+HLADR+ T cells were also found to be positively correlated with the titres of ANA (r=0.537, p<0.001) (figure 4D) and the anti-dsDNA autobody (r=0.469, p=0.002) (figure 4E).
The impact of treatment on phenotypes of T lymphocytes in SLE
A total of 13 of 28 new onset active-phase SLE patients were assessed. The median age of the patients (11 women, 84.62%) was 29.00 (22.00,45.50) years old, and the median disease duration was 0.80 (0.50–3.30) months at baseline. Disease activity was indicated by C3 of 0.53±0.17 g/L and a SLEDAI-2K score of 10.00 (9.00,12.50). The titres of ANA and anti-dsDNA antibodies were 417.30 (374.20,466.00) U/mL and 329.07±208.06 IU/mL, respectively. The median level of 24-hour urine protein in LN patients was 1083.00 (561.50,1701.50) mg. All 13 patients were administered glucocorticoid and immunosuppressant combination treatment, of whom eight patients received cyclophosphamide, two received mycophenolate mofetil, two received methotrexate and one received cyclosporine A. No one received very high doses or pulse doses glucocorticoid therapy. All of 13 active SLE patients were administered high doses therapy at the baseline. After 24 weeks, 13 patients all reduced to medium doses glucocorticoid therapy. After 24 weeks of therapy, the disease activity, the titres of autoantibodies and the level of 24-hour urine protein in LNs all improved significantly after treatment (p<0.05), as shown in table 2.
Comparison of clinical characteristics between 13 new-onset SLE patients before and after treatment
The frequency of some lymphocyte subsets in patients with SLE was altered significantly after treatment. As shown in figure 5, naïve T cells (figure 5A and F) and memory T cells (figure 5A and F) generally decreased after treatment, including CD8+CD127+ TEM cells (figure 5H).

Changes in the frequency of some lymphocyte subsets from 13 active SLE patients before (baseline) and after lupus treatment. (A) The frequencies of naïve, terminally differentiated, central memory and effector memory CD4+ T cells before and after treatment are shown. (B) The frequency of Treg cells before and after treatment is shown. The frequencies of Tfh cells (C) and Tfh17 cells (E) before and after treatment are shown. (D) The frequency of CD4+CXCR5−PD1+ T cells before and after treatment is shown. (F) The frequencies of naïve, terminally differentiated, central memory and effector memory CD8+ T cells before and after treatment are shown. (G) The frequency of Th17 cells before and after treatment is shown. The frequencies of CD127+ effector memory CD8+ T cells (H), CD8+CD38+HLADR+ T cells (I) and CD8+HLADR+ T cells (J) before and after treatment are shown. The frequency of lymphocyte subtypes before and after treatment was determined using the Wilcoxon signed ranks tests. P value summary: *p<0.05, **p<0.01, ***p<0.001, ****p<0.0001.
Furthermore, the frequency of Treg cells was increased (figure 5B), while the frequency of Tfh cells (figure 5C) and CD4+CXCR5−PD1+ T cells (figure 5D) was decreased significantly after treatment (figure 5D). The frequencies of Tfh17 cells (figure 5E) and Th17 cells (figure 5G) were decreased after treatment. The frequencies of CD8+HLADR+ T cells (figure 5J) and CD8+CD38+HLADR+ T cells (figure 5I) were also decreased when the disease improved.
The relationship between T lymphocytes phenotypes and renal response
LN is the most common severe manifestation of SLE and a major cause of mortality. In this cohort, after 24 weeks, 11 out of 13 patients reduced to 10 mg prednisone-equivalent per day, while two patients just reduced to 20 mg prednisone-equivalent per day due to impaired renal responses. We further investigated the relationship between T cell subsets and renal prognosis.
Eight of 13 SLE patients were diagnosed with LN in this research, of whom six patients achieved a complete renal response and two patients did not. We found that the frequencies of CD4+CD28− T cells, CD8+CD38+HLADR+ T cells and Th17 cells did not decrease after medication in patients who had impaired renal responses (figure 6B–D, shown in red dashed lines). This tendency was contrary to that in the patients who had a complete renal response (figure 6B–D, shown in black solid lines). At the same time, the frequency of Tregs in patients with impaired renal responses did not increase after medication, similar to patients with complete renal responses (figure 6A). In addition, in patients who achieved a complete renal response, the frequency of Tfh cells decreased obviously, while this decline was less prominent in patients who had impaired responses (figure 6E). These findings indicated that these T cell subpopulations might be associated with renal involvement and prognosis.

The relationship between T lymphocyte phenotypes and renal response in eight patients with LN. The frequencies of Treg cells (A), CD4+CD28− T cells (B), Tfh17 cells (C), CD8+CD38+HLADR+ T cells (D) and Th17 cells (E) before and after treatment are shown. The black solid line represents six ln patients with complete renal responses, while the red dashed line represents two ln patients with impaired renal responses. ln, lupus nephritis.
Discussion
Dysregulated T cell subset distribution and function are key players in SLE disease pathogenesis. Understanding the aberrant phenotype of T cells in SLE could provide clues to the pathogenic mechanisms linking these abnormalities and therapeutic target identification in SLE.
Naïve T cells are immature and inactivated cells and will differentiate into effector T cells and memory T cells when activated following encounters with antigen-presenting MHC class Ⅰ/II molecules. In this study, we found a differential distribution of naïve and memory T cell subsets between active SLE patients and HCs. A higher frequency of memory T cells and a lower frequency of naïve T cells were noted, in accordance with previous reports.34 35 The causes of this change might the immune system was overactivated in SLE leading to naïve T cells proliferated and differentiated into other cell types.
An imbalance of CD28+ and CD28− cells in CD4+ T cells was observed in patients with SLE. CD4+CD28− T cells were found to be increased in SLE, while CD4+CD28+ T cells were decreased. It was also found that the increased frequency of CD4+CD28− T cells tended to decrease after 24 weeks of treatment, but the difference did not reach statistical significance (online supplemental figure 3). The limited number of cases might be one of the reasons for this outcome. A few recent studies have reported that CD4+CD28− T cells increased and secreted interferon-γ (IFN-γ) in active SLE and might predict the occurrence of lung damage in SLE.36 In this study, we found that the frequency of CD4+CD28− T cells did not decrease after treatment in patients who had impaired renal responses. This finding indicated that CD4+CD28− T cells might be associated with renal involvement and prognosis. In addition, it was very interesting to note a negative correlation that we found between the frequencies of CD4+CD28− T cells and Treg cells (r=−0.377, p=0.015) and a positive correlation between the frequencies of CD28+CD4+ T cells and Treg cells (r=0.378, p=0.015) in this research (online supplemental figure 4). As noted by Esensten et al,37 CD28 might prevent spontaneous autoimmunity by supporting the function of Treg cells. Salomon et al38 reported that the numbers of Treg cells decreased in the mouse thymus and periphery when lacking CD28 ligation. Guo et al39 reported that CD4+CD25− T cells required CD28 ligation to differentiate into functional Foxp3+ Treg cells when activated with transforming growth factor β. The potential association between CD4+CD28−/CD4+CD28+ T cell subsets and Tregs should receive more attention in targeted intervention research in SLE.
The CD4+CXCR5−PD1+ T cell helper population was expanded in patients with SLE in this study, and the increased frequency was reduced significantly after effective treatment. CD4+CXCR5−PD1+ T cells, also called circulating follicular helper-like CD4+ T (cTfh-like) cells, support autoreactive B cell differentiation outside germinal centres. This subpopulation of cells might provide a surrogate for Tfh cell analysis in secondary lymphoid organs. In this study, we found that CD4+CXCR5−PD1+ T cells were associated with disease activity in SLE, in accordance with the data from Choi et al.40 The frequency of CD4+CXCR5−PD1+ T cells might offer a tool for tracking disease activity and response to therapies.
There has been increasing recognition and validation of the critical role of CD8+ T cells in SLE pathogenesis. Circulating CD8+ T cells from patients with SLE generally display impaired cytolytic function and appear powerless to remove autoreactive B cells.16 Chen and Tsokos demonstrated that the cytotoxic functions of CD8+ T cells were between systemic exhausted and locally activated status, contributing to organ damage and a high risk of infection.41 In this study, we showed increased frequencies of CD8+HLADR+ T cells and CD8+CD38+HLADR+ T cells in patients with SLE. A study done by Lebossé et al42 demonstrated that CD8+ T cells expressed an activated dysfunctional profile characterised by an expansion of an immunosuppressive CD8+HLADR+ T cells in peripheral in cirrhosis. The CD8+HLADR+ T cells displayed exhausted, activated and immune-modulatory properties, which were associated with infections and poor disease outcomes in cirrhosis.42 Arruvito et al23 found that CD8+HLADR+ T cells exhibited a suppressive capacity mediating the suppression of antitumour responses via cytotoxic T-lymphocyte-associated antigen 4 signalling. CD8+HLADR+ T cells might represent a separate lineage of CD8+ T cells that might be regarded as a natural subset of Treg cells. Previous studies noted that high levels of CD8+CD38+HLADR+ T cells were characteristic of patients with HIV infection and influenced HIV disease progression.43 Camargo et al44 demonstrated that abnormally elevated frequencies of CD8+CD38+HLADR+ T cells were associated with increased rejection risk in HIV kidney transplant recipients. Huang et al45 found that CD8+CD38+HLADR+ T cells could be regarded as a subset of activated CD8+ T cells with innate-like response in patients with chronic hepatitis C infection and the increased CD8+CD38+HLADR+ T cells were associated with liver damage and liver fibrosis progression. In this study, we found that CD8+CD38+HLADR+ T cells were closely associated with disease activity, autoantibody titres and renal prognosis in SLE. CD8+HLADR+ T cells and CD8+CD38+HLADR+ T cells might play important roles in the impaired immune responses in SLE, while the properties and behaviours of these cells in SLE are rarely investigated.
In addition, we found that CD8+CD127+ TEM cells were expanded in SLE blood and that the frequency of abnormally increased CD8+CD127+ TEM cells decreased after treatment. CD127, known as interleukin seven receptor (IL-7Rα), is involved in the homeostasis, longevity and expansion of T cells. In patients with SLE, information about CD127+ T cell subpopulations is scarce. According to the results of transcriptional profiling of purified CD8+ T cells in SLE, the IL-7R pathway was significantly upregulated, and the poor prognostic group was enriched for genes of the IL-7R pathway. As noted by Kreft et al,46 CD8+CD127+ TEM cells increased significantly in multiple sclerosis (MS) patients, leading to dysregulated changes in the expression of the cytotoxic molecules granzymes A and B, which were associated with the demyelinating lesions of MS. However, the association between CD8+CD127+ TEM cells and organ damage in SLE remains unknown.
A strong association between Th17 cells and renal involvement was observed in this study, in agreement with previous studies. We found a positive correlation between the frequency of Th17 cells and the level of 24-hour urinary protein (r=0.313, p=0.046) (online supplemental figure 5). Excessive activation of the Th17/IL-17 axis leads to the activation of many proinflammatory and profibrotic pathways in the kidney. We demonstrated that Tfh17 cells had the most significant elevation among the Tfh cells, suggesting that this subset played the dominant role in Tfh cells in SLE. Although controversy regarding Th1/Th2 imbalance in SLE remains, our results showed that Th2 cells were increased, and Th1 cells were decreased in patients with SLE, as described by Amel-Kashipaz et al.26
Our study has certain limitations. The patients were from a single centre. The results must be interpreted cautiously in the general SLE population due to selection bias. Because our institution is a tertiary hospital in the capital city of the province, the number of patients free from immunosuppressive or immunomodulatory drugs was relatively small. There is a need to replicate this study with a larger sample size in a multicentre setting. The expression of ICOS on the Tfh cells in active SLE and the functions of these aberrant T cells and their potential mechanisms in SLE require further study.
In conclusion, we demonstrated a wide range of anomalies in the proportion of T cell subsets in SLE. The proportions of CD4+CD28− T cells, CD4+CXCR5−PD1+ T cells, CD8+HLADR+ T cells and CD8+CD38+HLADR+ T cells increased in patients with SLE and could be associated with disease activity and renal prognosis. Further in-depth research with large sample size is necessary to verify the role of these phenotypic changes for disease monitoring and precise control in SLE.
Supplemental material
Data availability statement
All data relevant to the study are included in the article or uploaded as supplementary information.availability statementavailability statement Data underlying the findings described in this manuscript are uploaded as supplemental information.
Ethics statements
Patient consent for publication
Ethics approval
Approvals were obtained from the Ethics Committee of Guangzhou First People’s Hospital with reference number K-2020-030-01. Participants gave informed consent to participate in the study before taking part.
Acknowledgments
The authors would also like to thank the patients who participated in this clinical study.
References
Supplementary materials
Supplementary Data
This web only file has been produced by the BMJ Publishing Group from an electronic file supplied by the author(s) and has not been edited for content.
Footnotes
SY, YZ and JL are joint first authors.
SY, YZ and JL contributed equally.
Contributors SY and JL initiated this study. SY and YZ wrote the manuscript. XC and NY revised our first draft and provided valuable comments. SY acted as the guarantor of this work. All of the authors contributed to the article and approved the submitted version.
Funding This study was supported by grants from the Science Foundation of Guangzhou First People’s Hospital and grants from the Scientific, Technological Planning Project of Guangzhou City (202102080445, 202206010047) and Natural Science Foundation of Guangdong Province (2022A1515010651).
Competing interests None declared.
Provenance and peer review Not commissioned; externally peer reviewed.
Supplemental material This content has been supplied by the author(s). It has not been vetted by BMJ Publishing Group Limited (BMJ) and may not have been peer-reviewed. Any opinions or recommendations discussed are solely those of the author(s) and are not endorsed by BMJ. BMJ disclaims all liability and responsibility arising from any reliance placed on the content. Where the content includes any translated material, BMJ does not warrant the accuracy and reliability of the translations (including but not limited to local regulations, clinical guidelines, terminology, drug names and drug dosages), and is not responsible for any error and/or omissions arising from translation and adaptation or otherwise.