Article Text

Abstract
Background Complement activation has been associated with adverse pregnancy outcomes (APO) in SLE. Pregnant women with SLE were studied to evaluate whether complement dysregulation within the first two pregnancy trimesters predicts APO.
Methods Pregnant women fulfilled classification criteria for SLE. APO included neonatal death, preterm delivery before 36 weeks and small for gestational age newborn. Pre-eclampsia was also evaluated. Erythrocyte complement receptor 1 (ECR1) and erythrocyte-bound C4d (EC4d) were measured by flow cytometry. Complement proteins C3 and C4 were measured by immunoturbidimetry and anti-double-stranded DNA by ELISA in serum. Statistical analysis consisted of t-test, confusion matrix-derived diagnostic analysis, and multivariate logistic regression.
Results Fifty-one women had 57 pregnancies and 169 visits during the study. Baseline visits occurred mainly in the first (n=32) and second trimester (n=21). Fourteen (24.6%) pregnancies resulted in 21 APO with preterm delivery being the most common (n=10). ECR1 <5.5 net mean fluorescence intensity in the first trimester predicted APO with a diagnostic OR (DOR) of 18.33 (95% CI: 2.39 to 140.4; t-test p=0.04). Other individual biomarkers did not reach statistical significance. To estimate the likelihood of APO, we developed an algorithm that included the week of pregnancy, ECR1 and EC4d. From this algorithm, a Pregnancy Adversity Index (PAI) was calculated, and a PAI >0 indicated an elevated likelihood of pregnancy complications (DOR: 20.0 (95% CI: 3.64 to 109.97)).
Conclusions Low levels of ECR1 in early or mid-pregnancy are predictive of an APO. Incorporating the weeks of gestation and both ECR1 and EC4d generated a PAI, which further predicted serious pregnancy complications.
- lupus erythematosus, systemic
- autoimmune diseases
- autoimmunity
Data availability statement
Data are available on reasonable request.
This is an open access article distributed in accordance with the Creative Commons Attribution Non Commercial (CC BY-NC 4.0) license, which permits others to distribute, remix, adapt, build upon this work non-commercially, and license their derivative works on different terms, provided the original work is properly cited, appropriate credit is given, any changes made indicated, and the use is non-commercial. See: http://creativecommons.org/licenses/by-nc/4.0/.
Statistics from Altmetric.com
WHAT IS ALREADY KNOWN ON THIS TOPIC
Despite improvement in management, pregnant women with SLE are at increased risk for adverse pregnancy outcomes (APO), including fetal and neonatal death, preterm labour, fetal growth restriction and pre-eclampsia.
By measuring soluble fragments of complement activation, previous studies have shown that complement activation is a predictor of APO in lupus pregnancies.
WHAT THIS STUDY ADDS
We evaluated in this study stable markers of the complement pathways and, in particular, the cell-bound complement activation product erythrocyte-bound C4d (EC4d) and the erythrocyte complement receptor 1 (ECR1) in pregnant women with SLE.
Low levels of ECR1 early or mid-pregnancy predicted APO with a high diagnostic OR.
The predictive ability of ECR1 was even higher when other factors were taken into account; in particular, we developed an algorithm that included the week of pregnancy, ECR1 and EC4d.
From this algorithm, a Pregnancy Adversity Index (PAI) was calculated.
A PAI >0 indicated an elevated likelihood of pregnancy complications.
HOW THIS STUDY MIGHT AFFECT RESEARCH, PRACTICE OR POLICY
Although these novel data should be validated in larger cohorts, identification of these early biomarkers supports consideration of closer management and reinforcement of already recommended preventive strategies, such as use of aspirin and hydroxychloroquine in pregnant patients with SLE.
Introduction
Systemic lupus erythematosus (SLE) affects mainly women of reproductive age.1 Despite improvement in management, pregnant women with SLE are at increased risk for adverse pregnancy outcomes (APO), including fetal and neonatal death, preterm labour, fetal growth restriction and pre-eclampsia (PE).2 3 The early identification of patients destined for poor pregnancy outcomes remains challenging but has the potential to impact the care of this population. Activation of the complement system, in particular the alternative pathway and formation of the terminal attack complex, has been associated with APO during lupus pregnancies,3 suggesting that excessive complement activation is contributory. In addition, animal studies have shown that excessive complement activation results in APO.4
The generation of complement split products via activation of the classical pathway may lead to the deposition of complement split products on blood cells.5–7 These cell-bound complement activation products (CB-CAPs), including erythrocyte-bound C4d (EC4d), B lymphocyte-bound C4d and platelet-bound C4d, can be measured reliably by flow cytometry8 and have demonstrated adjunctive diagnostic and monitoring value in SLE.9–14 CB-CAPs are currently commercially available in North America through the clinical laboratory of Exagen (Vista, California, USA).
This study was initiated to determine whether complement dysregulation early in pregnancy is predictive of the development of APO in pregnant women with SLE. This was accomplished by a single-centre prospective observational study and measurement of the levels of CB-CAPs and erythrocyte complement receptor 1 (ECR1), in addition to more traditional biomarkers such as complement proteins, anti-double-stranded DNA (anti-dsDNA), antiphospholipid antibodies and lupus anticoagulant (LAC).
Methods
Patient population
Pregnant women with SLE, evaluated at New York University Langone Health and Bellevue Hospital Center, were enrolled into the study between March 2016 and February 2020. Inclusion criteria comprised documentation of an intrauterine pregnancy, maternal age 16–45 years and fulfilment of either the American College of Rheumatology (ACR)15 and/or the Systemic Lupus International Collaborating Clinics (SLICC)16 classification criteria for SLE.
Screening evaluations included medical history, assessment of ACR and SLICC criteria, physical examination, complete blood count, comprehensive metabolic panel, urinalysis and random or 24-hour urine collection for protein-to-creatinine ratio (UPCR). Disease activity was evaluated at every visit by the SLE-Pregnancy Disease Activity Index (SLEPDAI)3 17 using two different definitions for scoring the proteinuria domain, Safety of Estrogens in Lupus Erythematosus National Assessment (SELENA) SLE Disease Activity Index (scores proteinuria only if UPCR increases by >500 mg/g) and hybrid SELENA (always scores proteinuria if UPCR >500 mg/g). This was done to capture any kidney flares but at the same time track patients with persistent proteinuria. The physician global assessment (PGA on a 0–3 scale increasing with severity) and the lupus low disease activity state (LLDAS)18 were collected as well. Completion of all activity indices, PGA and physician clinical determinations—including the assessment of APO—were made blinded to the biomarker results.
APO included neonatal death; fetal death after 12 weeks of gestation unexplained by chromosomal abnormalities, anatomical malformation or congenital infection; preterm delivery (<36 weeks, irrespective of cause) and small for gestational age newborn (<5th percentile).2 3 PE was defined based on the American College of Obstetrics and Gynecology practice guidelines19 and when occurring after 36 weeks was not considered as an APO given the consideration of it representing lesser severity, similar to the approach taken in Predictors of pRegnancy Outcome: bioMarkers In antiphospholipid antibody Syndrome and Systemic Lupus Erythematosus (PROMISSE).2 3 The clinical definition includes an elevated blood pressure (systolic ≥140 mm Hg or diastolic ≥90 mm Hg after 20 weeks of gestation on two occasions at least 4 hours apart in a previously normotensive woman) and proteinuria ≥300 mg/UPCR ≥0.3 mg/mg or dipstick urinalysis ≥1+ or, in the absence of proteinuria, new-onset hypertension with any of the following complications: platelet count <100 000/μL, renal insufficiency, serum creatinine concentration ≥1.1 mg/dL or a doubling of the serum creatinine concentration in the absence of other renal disease, impaired liver function, elevated blood levels of liver enzymes to twice normal concentrations, pulmonary oedema, cerebral or visual symptoms.
Biomarker analysis
Complement proteins and autoantibodies were measured at Exagen’s clinical laboratory in serum or plasma if serum was not available. Complement proteins C3 and C4 were measured by standard immunoturbidimetry assay (The Binding Site, San Diego, California, USA)8 and were considered low if below 81.1 and 12.9 mg/dL, respectively. Anti-dsDNA antibodies were measured by ELISA (QUANTA Lite, Werfen, San Diego, California, USA) and were considered positive if >301 units/mL.8 9 Anticardiolipin (aCL) and anti-β2 glycoprotein 1 (anti-β2-GP1) antibodies were measured with a chemiluminescent immunoassay (QUANTA Flash, Werfen) and were considered positive if >20 chemiluminescent units (CU) based on the manufacturer’s cut-off. Antiphosphatidylserine/prothrombin complex antibodies (anti-PS/PT) were measured by ELISA (QUANTA Lite) and were considered positive if >30 units based on the manufacturer’s cut-off.
EC4d and ECR1 were measured in Exagen’s clinical laboratory from EDTA-anticoagulated blood by quantitative flow cytometry and are expressed as net mean fluorescence intensity (MFI) throughout. EC4d was measured as described previously.8 For ECR1 determination, erythrocytes were isolated from 50 µL of EDTA-anticoagulated blood, washed with Dulbecco’s phosphate-buffered saline without Ca2+ and Mg2+ (PBS) and resuspended with 500 µL of PBS containing 1% bovine calf serum. Cells were labelled with 10 µL of anti-CR1 antibody clone E11 (LifeSpan Biosciences, Seattle, Washington, USA) diluted at 5 µg/mL in PBS containing 10% bovine calf serum. For the background isotype control, non-specific mouse antihuman IgG1 kappa antibody (clone MOPC-21, BD Biosciences, San Jose, California, USA) was used. After a 30 min incubation, cells were washed and incubated with a secondary goat antimouse antibody conjugated to fluorescein isothiocyanate (Jackson ImmunoResearch, West Grove, Pennsylvania, USA). After an additional 30 min incubation, cells were washed and resuspended in 250 µL of PBS containing 1% bovine calf serum. Flow cytometry acquisition and analyses were carried out using Beckman Coulter models FC500 or Gallios flow cytometers equipped with CXP software (Beckman Coulter, Brea, California, USA). The MFI for the isotype background control and ECR1 were collected from each specimen in separate tubes, and the net MFI was determined by subtracting the isotype control MFI from the anti-ECR1 MFI.
The optimum cut-off for ECR1 of 5.5 MFI was determined based on the maximum Youden’s Index of a receiver operating characteristic (ROC) curve for preterm delivery (area under the curve (AUC): 0.75 (95% CI: 0.64 to 0.86)). At this cut-off, ECR1 had sensitivity of 72% (95% CI: 51% to 88%) and specificity of 79% (95% CI: 71% to 86%). Preterm delivery, rather than other APO-related outcomes, was chosen for the ECR1 ROC curve analysis because it yielded the lowest threshold.
ECR1 and EC4d could not be measured for one baseline sample at the second trimester visit.
LAC was evaluated as described3 and was reported as positive or negative. Differently from the biomarkers described above, LAC was not measured at every visit, therefore, historical values were analysed.
Statistical analysis
Analysis was conducted in R (R Core Team, V.4.1.3, 2022) with salient packages pROC20 for ROC curve analysis and epiR (V.2.0.44, 2022; https://CRAN.R-project.org/package=epiR) for confusion matrix-derived calculations. The log-odds for an APO were estimated from a multivariate logistic regression (MLR) on the baseline visits that occurred within the first two trimesters. Optimal threshold for ECR1 was estimated based on the maximum Youden’s Index for a preterm delivery outcome, as discussed above. The MLR model was then shifted by the optimal threshold to be centred at zero and is defined henceforth as the Pregnancy Adversity Index (PAI), where a PAI >0 indicates an elevated likelihood of an APO.
Results
A total of 51 women were enrolled and evaluated during 57 pregnancies for a total of 169 visits. Six subjects (3 Hispanic, 2 Caucasians and 1 Asian) had 2 pregnancies during the study for a total of 57 pregnancies.
Baseline visits occurred mainly during the first (n=32, 56.1%) and second (n=21, 36.8%) trimester. Four (7.0%) baseline visits occurred in the third trimester. Since they were part of the study, these visits are included in the data presented in tables 1 and 2. As statistical analyses were conducted to predict risk of APO, only the baseline visits in trimesters 1 and 2 were included in calculation of the diagnostic OR (DOR) and in the MLR.
Demographic and clinical variables at baseline corresponding to the pregnancies with (n=14) or without (n=43) APO
Subjects in the study and t adverse outcomes
The demographic characteristics of the women with the 57 pregnancies with and without APO are reported in table 1. Average maternal age was 32.4 years (median: 33.0, IQR: 29.0–35.0) in the entire cohort. Maternal age was not different in women with and without APO (table 1). Among the 57 pregnancies, 3 APO occurred in the 14 pregnancies in women older than 35 years (range: 36–42), compared with 11 APO in 43 pregnancies in women aged ≤35 years (range: 17–35) (p=1).
Overall, the majority of patients had minimal to no disease activity with only 14 pregnancies (24.6%) having a SLEPDAI >4 and 6 pregnancies (10.5%) having a PGA >1 (table 1) at baseline. Fourteen (24.6%) pregnancies resulted in at least 1 APO with 21 APO in total. Among the APO, preterm delivery was the most common and occurred in 10 pregnancies (mean delivery: 32.2 weeks (IQR: 29.4–35.0)). Of the 14 pregnancies with APO, 7 had PE before the 36th week of gestation. Of the 14 pregnancies with APO, 1 had the baseline visit in the third trimester and, thus, was not included in the MLR analysis. In addition to the 14 pregnancies with APO, 4 pregnancies presented with PE after 36 weeks (table 2). As these four pregnancies did not fulfil the prespecified definitions of APO, they were not included in the calculation of the DOR or in the MLR analysis.
In out cohort, LLDAS at baseline was available for 56 visits; 8 of 42 pregnancies in LLDAS at baseline experienced an APO while 6 of 14 not in LLDAS experienced an APO (p=0.08915). We also evaluated LLDAS throughout the pregnancy: 39 pregnancies were in LLDAS for the entire pregnancy, 10 were never in LLDAS and 7 fluctuated. In agreement with published data,21 pregnancies were more likely not to result in APO when LLDAS was sustained over the entire pregnancy, compared with when it was not (p=0.01897). However, not being in LLDAS was not predictive of an APO (p=0.09977 for never in LLDAS and 0.3495 for fluctuation of LLDAS). These data indicate that APO are not necessarily due to higher disease activity implied by not being in LLDAS.
When ECR1 net MFI levels at the baseline visits in the first and second trimester were compared, ECR1 was significantly lower in the pregnancies with APO than those without (7.65 net MFI (SD: 5.86, n=12) vs 11.82 net MFI (SD: 6.03, n=40), t-test p=0.045). In contrast, EC4d and other biomarkers evaluated in SLE, including C3, C4, anti-dsDNA and three antiphospholipid antibodies (aCL, anti-β2-GP1 and anti-PS/PT) were not statistically different (t-test with p ≥0.05) between the pregnancies with and without APO (tables 3 and 4).
Analysis of baseline visits that occurred during trimesters 1 and 2 (n=53)
Analysis of baseline visits that occurred during trimester 1 (n=32)
T-test and DOR were calculated to assess individual biomarkers associated with APO by analysing the pregnancy baseline visits that occurred in the first and second trimesters (n=53), or those that occurred in the first trimester only (n=32).
When baseline visits in the first and second trimesters (n=53) were analysed, ECR1 <5.5 net MFI, as determined by maximised Youden’s Index, was statistically significant at predicting APO (t-test p=0.05) and approached significance for preterm delivery (t-test p=0.06) with DOR of 12.33 (95% CI: 2.41 to 63.10) and 12.19 (95% CI: 2.30 to 64.72), respectively (table 3). Other biomarkers, including EC4d, low C3, low C4, anti-dsDNA, LAC and antiphospholipid antibodies were not predictive of adverse outcomes (table 3).
Restricting the analysis to the 32 baseline visits within the first trimester, the ability of ECR1 to predict APO was even more evident: DOR was 18.33 (95% CI: 2.39 to 140.4) for all APO and 32.0 (95% CI: 2.63 to 389.3) for preterm delivery. DOR for APO, PE after 36 weeks or both was 10.0 (95% CI: 1.48 to 67.55), however it did not reach significance (t-test p=0.13). No other biomarker was statistically significant (table 4).
The sensitivity of ECR1 <5.5 net MFI for APO was suboptimal at 67% with the lower CI starting below 50% (95% CI: 30% to 93%). Thus, we decided to build a model to improve the performance characteristics of this biomarker. MLR was used to model the contribution of clinical and laboratory parameters to better predict the occurrence of APO. EC4d, although not reaching significance on its own, improved the sensitivity of the model, consistent with previous data showing that EC4d levels parallel disease activity in SLE.22 In addition, given that the ability of ECR1 to predict APO was stronger when only the baseline visits in the first trimester were analysed, the weeks of pregnancy were included in the model.
The model comprising the week of pregnancy, the quantitative value of EC4d in net MFI and the qualitative value of ECR1 (counted as 1 if <5.5 net MFI and counted as 0 if ≥5.5 net MFI), predicted APO with a sensitivity of 83% (95% CI: 52% to 98%), specificity of 80% (95% CI: 64% to 91%), DOR of 20.0 (95% CI: 3.64 to 109.97), AUC of 0.856 (95% CI: 0.747 to 0.965) and accuracy of 80% (95% CI: 67% to 90%). Thus, the model has improved sensitivity compared with ECR1 alone (from 67% to 83%) as well as an improved CI.
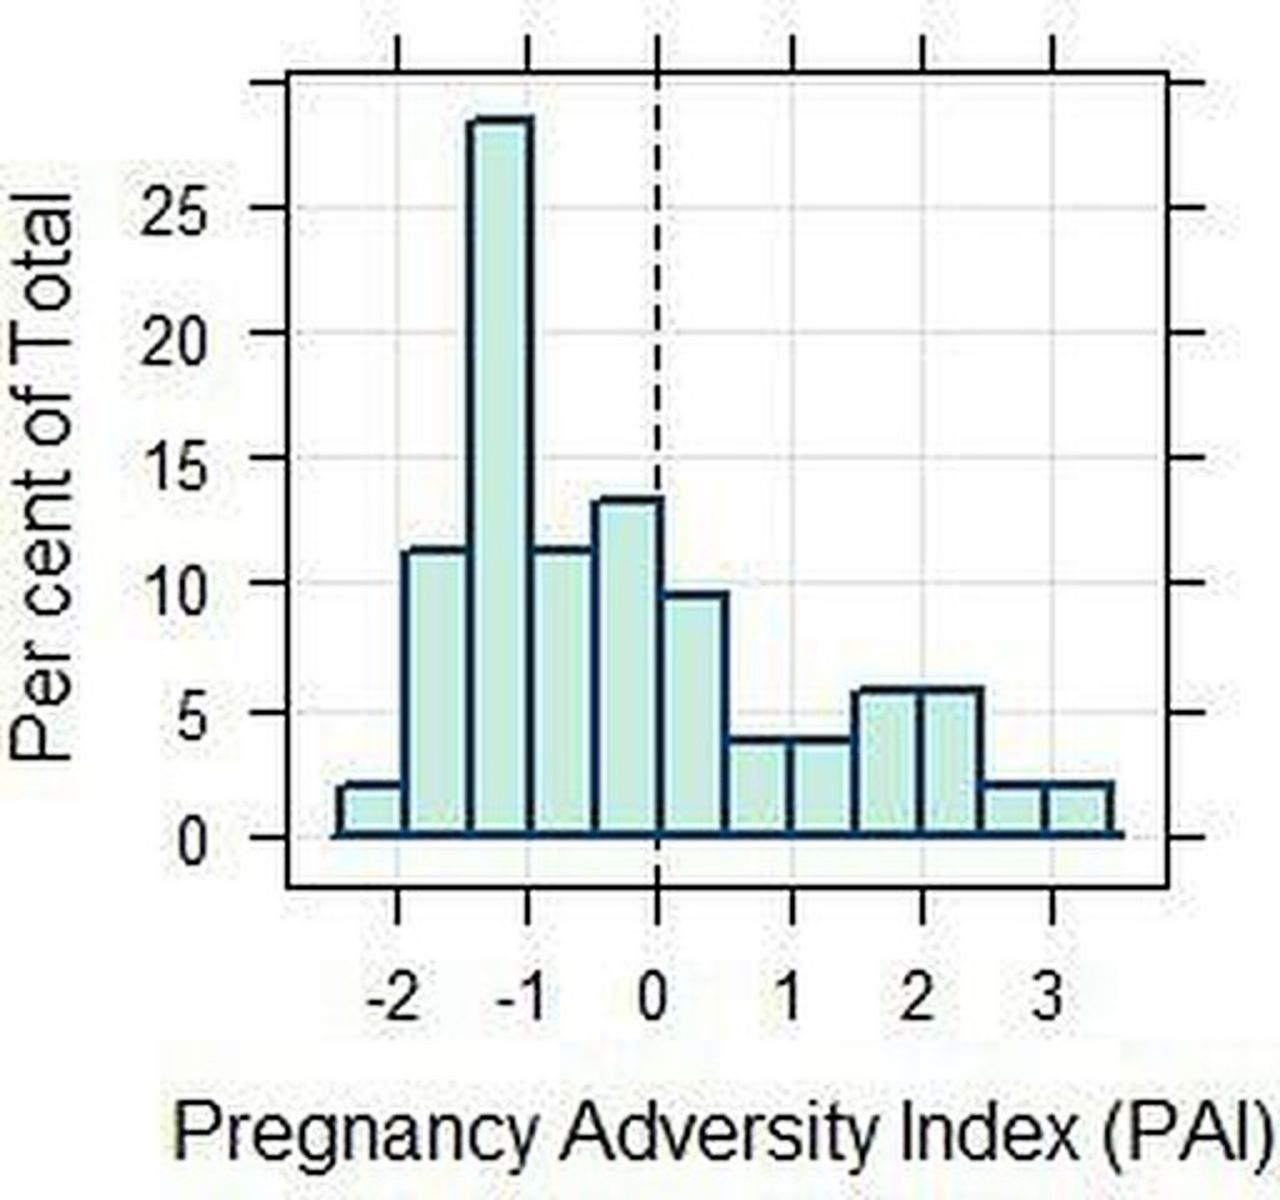
Estimates and intercept from the MLR were used in an algorithm to calculate the log-odds of APO. From this equation, the PAI was calculated by adding the threshold value derived from the maximum Youden’s Index of the ROC curve. The ROC curve, as well as the algorithms to calculate the log-odds and the PAI, are reported in figure 1. The PAI is centred at zero and, thus, an index >0 indicates an increased likelihood of APO, while an index <0 indicates a reduction of that likelihood. PAI was positive in 34.6% of pregnancies and the overall distribution in our cohort is reported in figure 2. Although PAI marginally increased with increasing SLEPDAI, linear regression yielded an adjusted R2 of 0.02271 and was not significant (p=0.1456), indicating no correlation between PAI and SLEPDAI.

Receiver operating characteristics curve for the Pregnancy Adversity Index (PAI). Estimates and intercept from the multivariate logistic regression, rounded to 4 significant figures, are used to calculate log-odds of adverse pregnancy outcomes (APO) from this equation: ((0.2083×week of pregnancy)+(0.03787×EC4d)+(−0.004688×week of pregnancy×EC4d)+(2.933×ECR1 <5.5)–4.456), where the erythrocyte-bound C4d (EC4d) and erythrocyte complement receptor 1 (ECR1) values are rounded to 2 decimal places. Odds for an APO can be calculated from the log-odds by elevating the constant e to the power of the log-odds. The odds against APO are obtained by dividing 1 by the odds. From the equation to calculate the odds, a PAI for APO can be derived by adding the constant 1.343 derived from the receiver operating characteristic curve as the threshold for the optimal Youden’s Index value. Thus, the equation to calculate the PAI is: (((0.2083×week of pregnancy)+(0.03787×EC4d)+(−0.004688×week of pregnancy×EC4d)+(2.933×ECR1 <5.5)–4.456)+1.343). For example, a person at the fifth week of pregnancy presenting with ECR1 of 3.05 net mean fluorescence intensity (MFI) and EC4d of 165.61 net MFI has log-odds of 1.908, corresponding to odds for an APO of 6.74:1 and odds against having APO of 0.148:1. The PAI is 3.25, suggesting an increased likelihood of a later APO. AUC, area under the curve.

Pregnancy Adversity Index (PAI) distribution. Distribution of the PAI score in the entire cohort.
Discussion
This study in pregnant women with SLE aimed to evaluate whether markers of complement activation and other biomarkers measured early in pregnancy are predictive of the occurrence of serious pregnancy complications.
Low expression of ECR1 in the first and second trimesters was significantly associated with an APO with a high diagnostic OR. In contrast, EC4d and the more traditional biomarkers commonly measured in SLE, including C3, C4, anti-dsDNA and antiphospholipid antibodies singularly were not predictive of adverse outcomes. A model comprising two laboratory markers (the quantitative levels of EC4d and the qualitative levels of ECR1) and one clinical parameter (the week of pregnancy) led to further increased DOR (ECR1 only: DOR=12.33 (95% CI: 2.41 to 63.10); model comprising ECR1, EC4d and week of gestation: DOR=20.0 (95% CI: 3.64 to 109.97)) and sensitivity (from 67% (95% CI: 30% to 93%) to 83% (95% CI: 52% to 98%)), indicating an improvement of the predictive ability of ECR1. Using the same model, we built an algorithm to calculate a PAI for ease of interpretation. As the PAI is a simple index centred at zero, a PAI >0 indicates increased likelihood of APO in SLE. As the number of APO in our cohort was small, it is not surprising that PAI was negative for the majority of patients while 34.6% of pregnancies had a positive PAI. The absence of a correlation between PAI and SLEPDAI indicates that the PAI provides information to predict APO in SLE that cannot be obtained with the SLEPDAI. In addition, maternal age >35 years and time not spent in LLDAS during pregnancy were not predictors of APO in our study. Overall, these data reinforce our conclusion that low ECR1 and the PAI are each independent predictors of APO in SLE.
The main finding of lowered levels of ECR1 in patients with subsequent APOs provides further insight into the contribution of complement activation. The complement receptor 1 (CR1; CD35), which is expressed on erythrocytes (ECR1) and immune cells, is the receptor for the complement fragments C3b and C4b.23 ECR1 clears immune complexes opsonised with C3b and C4b,23–25 with subsequent delivery to the liver and spleen for clearance.26 ECR1 also regulates complement activation by acting as a co-factor for factor I to inactivate deposited C3b and C4b and by accelerating the decay of the C3 convertase.24 Consistent with the results reported here, levels of ECR1 inversely correlate with disease activity in non-pregnant patients with SLE.27 Although genetic factors contribute to an individual’s ECR1 levels, correlation with disease activity in SLE implies that acquired factors are important in determining the levels of this receptor. Decreased levels of ECR1 in SLE do not seem to be the consequence of binding immune complexes. Rather, C3b-bearing erythrocytes may shed ECR1 when shuttling immune complexes to macrophages in the spleen or liver.27 As a consequence, lower ECR1 expression or levels may lead to decreased clearance of immune complexes allowing increased inflammatory responses and injury in tissues due to excess deposition of complexes.24
Other studies have also implicated complement activation as a predictor of APO in lupus pregnancies. Kim et al found that increased circulating levels of alternative pathway complement activation, product Bb and the terminal attack complex, sC5b-9, in the first trimester were significantly associated with APO while C5a, C4d and iC3b levels at 12–15 weeks and 16–19 weeks were not significantly associated with APOs. In addition, other biomarkers that may predict APO in SLE include elevated levels of angiogenic factors, such as soluble fms-like tyrosine kinase-1 (sFlt-1; also called soluble vascular endothelial growth factor) and lower levels of placental growth factor (PlGF), resulting in high Flt-1/PlGF ratios.28–30 Most recently, it has been reported that higher ratios of sFlt-1/PIGF are found in patients with SLE developing PE compared with those with nephritis.30 Taken together, previous studies and the current work suggest that complement activation and dysregulation of angiogenesis play a role in pregnancy complications in SLE.
This study has several limitations that warrant acknowledgement. The sample size was modest and consequently there were few adverse events. This may explain why LAC was not a predictor of APO in this study, although was observed as the greatest risk factor in the PROMISSE study. However, the APO rate overall of 24.6% in this study even slightly exceeded that observed in PROMISSE in which the rate was 19%.2 In this study, we did not find an association of APO with measures of disease activity, such as PGA, SLEPDAI or LLDAS, which could result from the small sample size and possibly a type II error. Since the analytes evaluated in our study were not measured prior to conception, it was not possible to determine whether complement activation was the result of lupus activity per se or was related to early placental inflammation. In addition, the study reported here did not include otherwise healthy pregnant women or pregnant women with autoimmune diseases other than SLE. Thus, it is unknown whether low ECR1 levels predict APO in women who do not have SLE. A previous study has shown that a genetic predisposition to ECR1 deficiency is present in some patients with PE.26 Thus, it cannot be excluded that low levels of ECR1 may predict PE in pregnant women who do not have SLE.
In conclusion, this prospective study demonstrates that low levels of ECR1 in the first and second trimester are predictive of pregnancy complications in patients with SLE. In addition, an algorithm that comprises ECR1, EC4d and the week of pregnancy is a practical way to evaluate risk of APO in SLE. Although the results of this study need to be confirmed in a larger patient population, the data support the association of complement activation with APO and suggest that screening for ECR1 and EC4d early in pregnancy may identify patients with increased risk of serious pregnancy complications.
Data availability statement
Data are available on reasonable request.
Ethics statements
Patient consent for publication
Ethics approval
This study was approved by New York University Institutional Review Board (Study #: s16-00077). Participants gave informed consent to participate in the study before taking part.
Acknowledgments
We thank Dr Jane E Salmon for her insight on APO definitions and critical review of the manuscript. The authors wish to thank the patients who participated in the study. We thank also Exagen’s laboratory personnel for technical assistance. Professor Jill Buyon is an editor of Lupus Science & Medicine.
References
Footnotes
JPB and RVA are joint senior authors.
Contributors JPB designed the study and enrolled patients in the study. TD initiated and oversaw the study for Exagen. MG and AE contributed to patient enrolment and clinical data collection. PI and HMB contributed to patient enrolment and participated with JPB in the clinical assessments. JC contributed to data collection and performed the data analysis. RVA organised the data collection and analysis. All authors contributed to the writing of the manuscript. All authors approved the final version of the manuscript. RVA assumes overall responsibility for the content and finished work.
Funding Exagen funded the study.
Competing interests JC and RVA are employees and stockholders of Exagen. TD is a stockholder of Exagen.
Patient and public involvement Patients and/or the public were not involved in the design, or conduct, or reporting, or dissemination plans of this research.
Provenance and peer review Not commissioned; externally peer reviewed.