Article Text

Abstract
Objective We investigated malignancy risk after renal transplantation in patients with and without systemic lupus erythematosus (SLE).
Methods Using the United States Renal Data System from 2001 to 2009, 143 652 renal transplant recipients with and without SLE contributed 585 420 patient-years of follow-up to determine incident cancers using Medicare claims codes. We calculated standardised incidence ratios (SIRs) of cancer by group using age, sex, race/ethnicity-specific and calendar year-specific cancer rates compared with the US population.
Results 10 160 cancers occurred at least 3 months after renal transplant. Overall cancer risk was increased in both SLE and non-SLE groups compared with the US general population, SIR 3.5 (95% CI 2.1 to 5.7) and SIR 3.7 (95% CI 2.4 to 5.7), respectively. Lip/oropharyngeal, Kaposi, neuroendocrine, thyroid, renal, cervical, lymphoma, liver, colorectal and breast cancers were increased in both groups, whereas only melanoma was increased in SLE and lung cancer was increased in non-SLE. In Cox regression analysis, SLE status (HR 1.1, 95% CI 0.9 to 1.3) was not associated with increased risk of developing cancer, adjusted for other independent risk factors for developing cancer in renal transplant recipients. We found that smoking (HR 2.2, 95% CI 1.2 to 4.0), cytomegalovirus positivity at time of transplant (HR 1.3, 95% CI 1.2 to 1.4), white race (HR 1.2, 95% CI 1.2 to 1.3) and older recipient age at time of transplantation (HR 1.0 95% CI 1.0 to 1.2) were associated with an increased risk for development of cancer, whereas shorter time on dialysis, Epstein-Barr virus or HIV were associated with a lower risk for development of cancer.
Conclusions Cancer risk in renal transplant recipients appeared similar in SLE and non-SLE subjects, aside from melanoma. Renal transplant recipients may need targeted counselling regarding surveillance and modifiable risk factors.
- SLE
- cancer after kidney transplant
- USRDS
- cancer risk SLE
- kidney transplant
This is an Open Access article distributed in accordance with the Creative Commons Attribution Non Commercial (CC BY-NC 4.0) license, which permits others to distribute, remix, adapt, build upon this work non-commercially, and license their derivative works on different terms, provided the original work is properly cited and the use is non-commercial. See: http://creativecommons.org/licenses/by-nc/4.0/
Statistics from Altmetric.com
Introduction
Lupus nephritis is among the most common and serious manifestations of systemic lupus erythematosus (SLE), affecting approximately 40% of blacks and 18.8% of whites with SLE, 10%–20% of whom will progress to end-stage renal disease (ESRD).1 Despite an up to 50% risk of recurrence of lupus nephritis in the transplanted kidney,1 ,2 graft survival, graft function and overall mortality are similar to those who undergo transplantation for other conditions.3 ,4
It has been shown that renal transplantation improves survival in SLE patients with ESRD.5 There is an increased risk of haematological malignancy, lung cancer, melanoma, thyroid cancer, vulvovaginal cancer and cancer of the lip associated with renal transplantation.6–9 For patients with SLE, who have an elevated risk of certain cancers at baseline, the risk of malignancy after renal transplantation may be even greater.10–14
To date, the risk of malignancy after renal transplantation in patients with and without SLE compared with the general population has not been quantified. We examined the risk of malignancy in renal transplant recipients with SLE and non-SLE recipients compared with the general population.
Methods
Data source
The United States Renal Data System (USRDS) is a national registry of people receiving renal replacement therapy due to ESRD.15 The USRDS is a unique and powerful tool as all renal transplants in the USA are included as mandated by law. The USRDS includes data on approximately 92% of patients receiving dialysis in the USA and 100% of the recipients of renal transplantation. As of 2013, the USRDS had tracked >2.4 million individuals, 413 493 of whom had undergone renal transplantation (USRDS 2013 report). Mandatory annual follow-up data are collected on all transplant recipients, including reporting of post-transplant malignancies, until graft failure or patient death. Available demographics include birth date, sex, race/ethnicity, date of renal transplantation (ie, date first entered into the registry at each site) and the indication for ESRD (with a specific category for SLE). Data from the USRDS have been validated with 90% agreement with source documents;16 however, smoking is known to be grossly under-reported.17 Deidentified clinical data were used from the USRDS, and this human subjects research falls under the exemption of Department of Health and Human Services (DHHS) regulation (46.101(b), #4).
Identification of cohort
A cohort of 143 652 renal transplant recipients contributing 585 420 patient-years of follow-up were identified between 2001 and 2009 from the USRDS. Patients were stratified by primary cause of ESRD into SLE (n=4289 (3%), contributing 18 435 patient-years) and non-SLE (n=139 363 (97%), contributing 566 985 patient-years).
Ascertainment of cancer outcomes
International Classification of Diseases (ICD)-9 codes for cancers were identified on the basis of a single Medicare claim code for cancer within billing and hospitalisation data from 2000 to 2009. Established algorithms were used to eliminate duplicate Medicare claims for the same patient. We excluded claims made in the first three months post-transplantation as these could include pre-existing undiagnosed malignancy. Cancers were identified from Medicare physician claims data using the following ICD-9 codes and their subcodes: 140–149, 150–159, 160–165, 170–176, 179–189, 190–199, 200–209 and 230–234. Cancer incidence was expressed per 100 000 patient-years. The expected number of cancers was derived from Surveillance Epidemiology and End Results program (SEER) general population cancer data from 2000 to 2009, accounting for age and sex.
Statistical analyses
Continuous variables are presented as means±SD. Standardised incidence ratios (SIRs) were calculated as the ratio of observed to expected cancer incidence. The observed incidence during the study interval was calculated using the total number of cancers observed. The expected incidence was calculated by multiplying each person-year at risk in the cohort by the general population age, sex and calendar year-specific SEER cancer rates. The person-years at risk for each subject were calculated by subtracting the entry dates (renal transplant) from the earliest of three exit dates (cancer, death or end of the cohort study interval). SIRs were generated for overall and for site-specific cancers according to SLE status (SLE or non-SLE), ethnicity (Hispanic or non-Hispanic) and race (white or non-white). The 95% CIs were calculated for the SIRs using Poisson parameters. We also performed Cox regression analysis to compare time from renal transplant to cancer diagnoses between SLE and non-SLE groups, adjusted for other independent risk factors for developing cancer in renal transplant recipients. p<0.05 was considered statistically significant.
Study power
The power calculations were based on a cohort of 150 000 renal transplant subjects, with a median duration of follow-up of 5 (maximum 11) years and an annual overall malignancy incidence of 0.005 per year in the general population. This study was powered to detect a 1.15-fold increase in overall cancer risk in all renal transplant patients (compared with the general population) with >95% power, with a two-sided type 1 error of 5%. We based our power calculations on an estimate that 1650 patients in the USRDS would have undergone renal transplantation for SLE-related renal disease. This was based on estimations that 1 in 2000 Americans may have SLE, and 10% of patients with SLE may require renal transplantation as a result of SLE-related renal disease. Thus, a twofold increased cancer risk (compared with the remainder of the renal transplant population) for this subgroup would be detected with a power of >95%, and a 1.75-fold increased cancer risk with a power of >85%, with a two-sided type 1 error of 5%.
Results
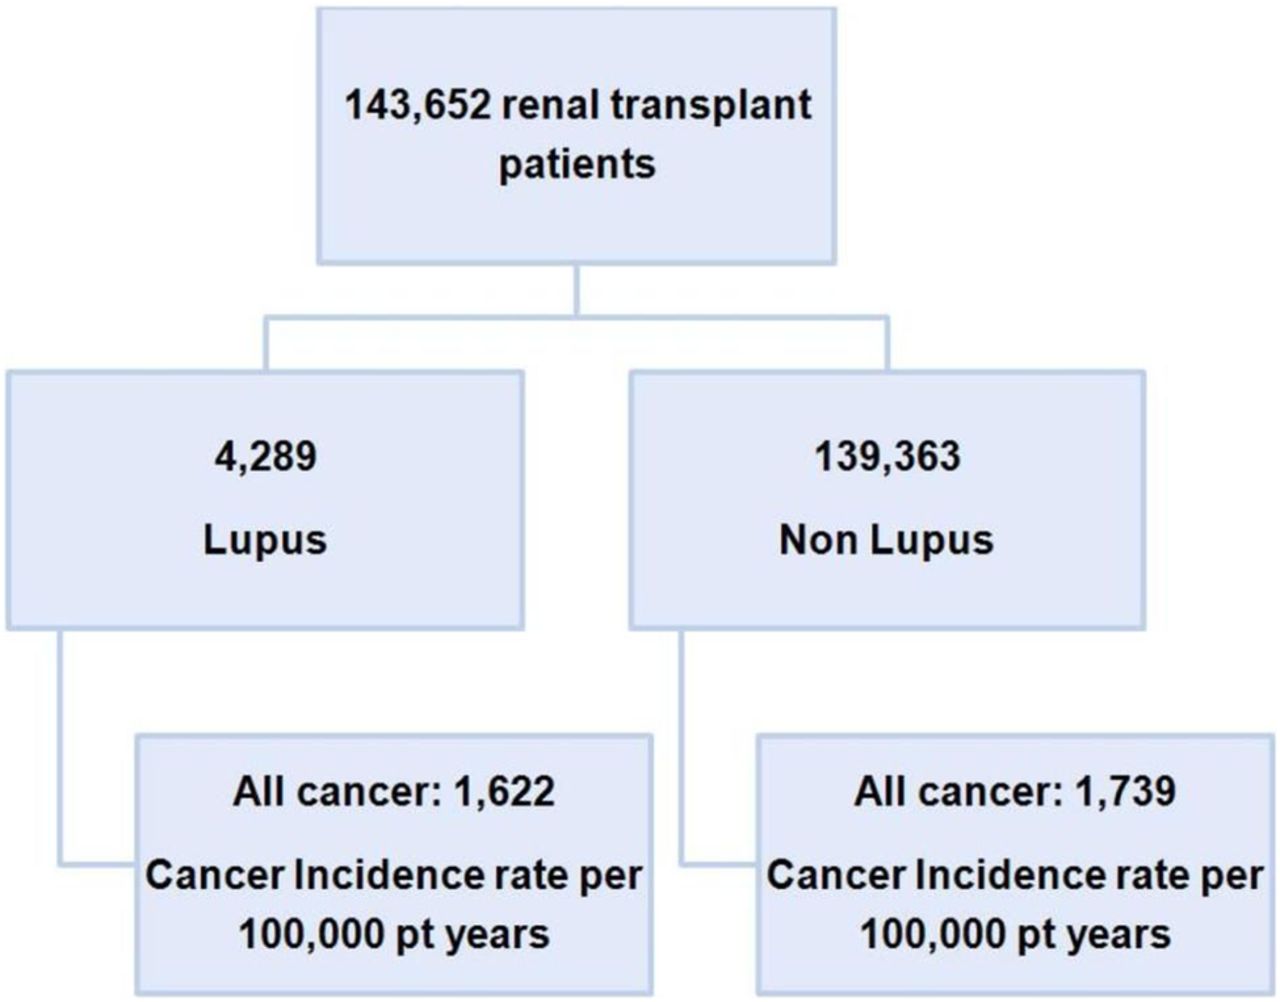
In total, 143 652 subjects, including 4289 with SLE, were observed for a total of 585 420 patient-years, an average of 4 years per patient. Also, 10 160 cancers (299/4289, 7% in SLE and 9861/139 363, 7.1% in non-SLE transplant recipients) occurred at least three months after renal transplantation. There were significant differences in characteristics between the SLE and non-SLE renal transplant cohort recipients as shown in table 1. The SLE cohort was significantly younger at age of transplantation with a lower body mass index (BMI), less likely to be white, more likely to be Hispanic, less likely to be male, less likely to test positive at time of transplant for hepatitis C virus (HCV) or HIV, more likely to test positive at time of transplant for Epstein-Barr virus (EBV) and cytomegalovirus (CMV), and had been on dialysis longer than the non-SLE cohort. Figure 1 gives the flow diagram of the study design.
Baseline characteristics in systemic lupus erythematosus (SLE) and non-SLE renal transplant recipients in the USA (2001–2009)

Flow diagram of the study design. Further subdivided by cancer type and standard incidence ratios were calculated as the ratio of observed to expected cancer incidence rates in each cancer type.
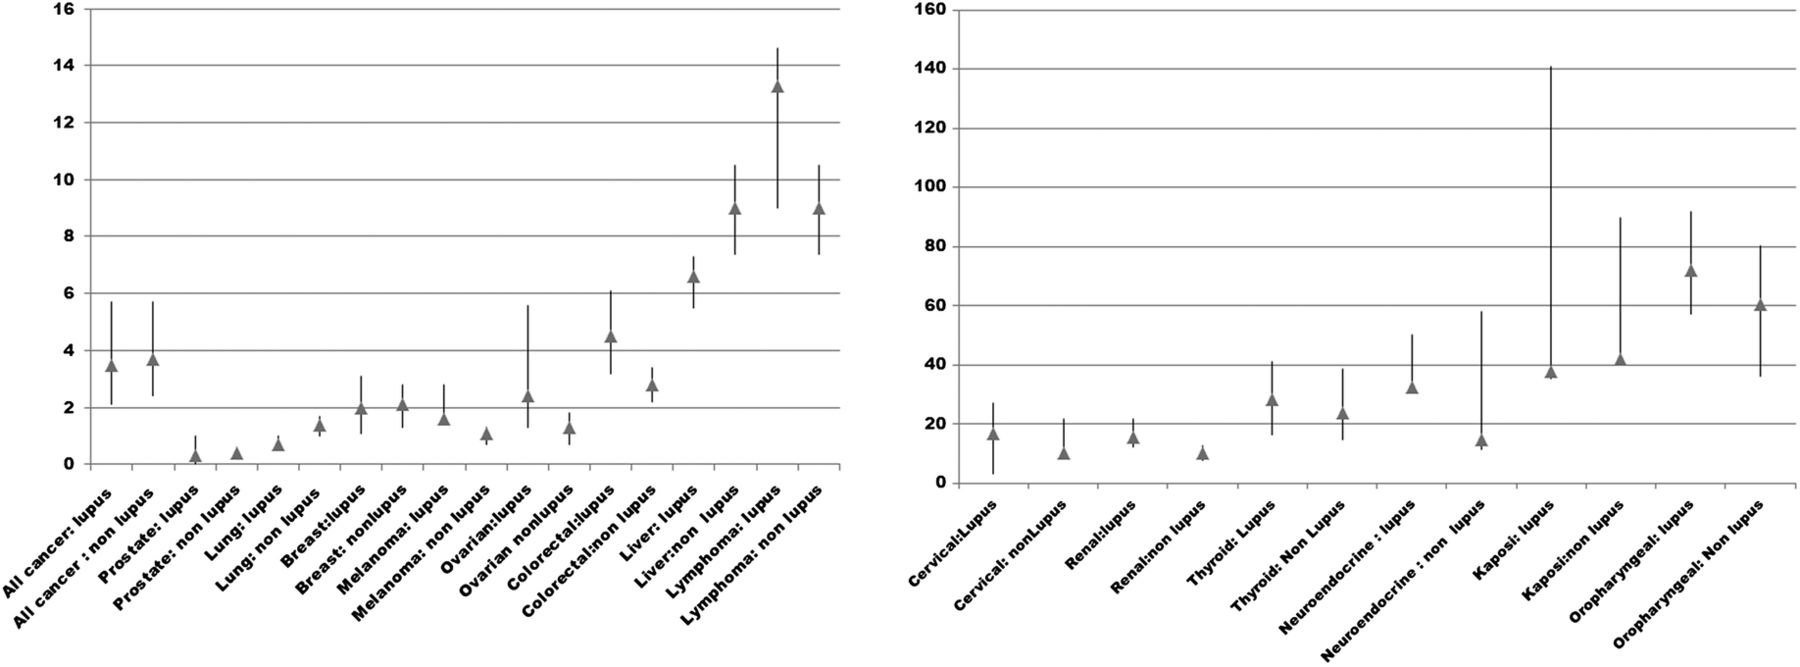
As shown in figure 2 and table 2, compared with the US general population, overall cancer risk was increased in both SLE and non-SLE groups, SIR 3.5; 95% CI 2.1 to 5.7 and SIR 3.7; 95% CI 2.4 to 5.7, respectively. Lip/oropharyngeal, Kaposi, neuroendocrine, thyroid, renal, cervical, lymphoma, liver, colorectal and breast cancers were increased in both the SLE and non-SLE compared with the general US population. Non-SLE subjects had increased risk for lung cancer compared with the US general population.
Standardised incidence ratios (SIRs) and 95% CIs in US renal transplant recipients compared with the US general population
Standardised incidence ratios in US renal transplant recipients, categorised by lupus versus non-lupus. X-axis: type of cancer; Y-axis: standardised incidence ratio.
As shown in tables 3 and 4, when stratifying by race or ethnicity in the SLE groups, most of the subgroups had evidence of increased risk, and because of wide CIs, we were unable to detect any differences in cancer risk among the race/ethnic SLE groups. However, in the non-SLE group, there was evidence of an increased risk of thyroid, renal and melanoma cancers in the non-white group versus whites, and increased ovarian cancer risk in Hispanics versus non-Hispanics.
Standardised incidence ratios (SIRs) and 95% CIs) in US systemic lupus erythematosus renal transplant recipients compared to the US general population stratified by race/ethnicity
Standardised incidence ratios (SIRs) and 95% CIs in US non-systemic lupus erythematosus renal transplant recipients compared with the US general population stratified by race/ethnicity
In Cox regression analysis, SLE status (HR 1.1, 95% CI 0.9 to 1.3) was not associated with increased risk of developing cancer, adjusted for other risk factors identified in the descriptive analyses (table 5). We found that smoking (HR 2.2, 95% CI 1.2 to 4.0), CMV positivity at time of transplant (HR 1.3, 95% CI 1.2 to 1.4), white race (HR 1.2, 95% CI 1.2 to 1.3) and older recipient age at time of transplantation (HR 1.0, 95% CI 1.0 to 1.2) were associated with an increased risk for development of cancer, whereas shorter time on dialysis, EBV or HIV were associated with a lower risk for development of cancer.
Adjusted Cox regression analysis estimating independent risk factors for the development of cancer in systemic lupus erythematosus (SLE) and non-SLE renal transplant recipients
Additional analysis by sex showed no significant difference in the proportions of men by overall cancer status in the SLE group (with cancer 38.1% vs without cancer 39.2%; p=0.759) or the non-SLE group (with cancer 61.0% vs without cancer 61.0%; p=0.995). We examined risk of liver cancer or lymphoma based on HCV or EBV status as time of transplant and were unable to detect a clear association between these viral infections and risk of these malignancies in the SLE or the non-SLE groups. HIV status was not further explored due to the small sample size of those infected with this virus. Although there was a significant statistical difference between the BMI in the SLE versus non-SLE, the difference was not clinically significant and not further examined by subgroups of BMI. There was no difference in average time to cancer occurrence following transplant in the SLE group (2.2±1.7) versus non-SLE group (2.1±1.7) years.
Discussion
Our study is the first to use a large national database to examine cancer risk after renal transplantation in patients with and without SLE. The data suggest that, with an average of 4 years of follow-up, patients with SLE have an increased overall risk of cancer that is similar to the risk in the non-SLE renal transplantation population. We did find a suggestion of an increased risk of melanoma in SLE versus non-SLE renal transplant recipients. Smoking, increased recipient age at time of transplantation, CMV positivity at time of transplantation and white race were associated with higher risk for development of cancer, whereas SLE status did not modify the risk of cancer.
A strength of our study was the large number of patients with SLE. Although the total sample size of 143 652 renal transplant recipients fell short of the original estimate of 150 000, the overall sample size was large, with >500 000 patient-years of follow-up. Still, this resulted in only an average of 4 years of follow-up per patient (with some patients only contributing 1 or 2 years of follow-up), which does not adequately describe long-term events.
Although there were differences in baseline variables, the absolute differences were often small. For example, although HIV and HCV positivity occurred less frequently and EBV positivity more frequently in the SLE group compared with the non-SLE group, the absolute differences were small. Furthermore, the risks of EBV-related malignancy, namely lymphoma,18 HIV-related malignancies such as Kaposi's sarcoma and human papillomavirus (HPV)-related malignancies such as cervical cancer and lip/oropharyngeal cancer,19 were not significantly different when patients with SLE and non-SLE patients were each compared with the general population. We do note that both the SLE and non-SLE groups had similarly increased risk of liver cancer compared with the general population, despite small differences in HCV positivity between the two groups (less frequently in SLE).20 The HIV-related malignancies such as Kaposi's sarcoma and HPV-related malignancies such as cervical cancer and lip/oropharyngeal cancer19 were not clearly different between patients with SLE and non-SLE patients. Likewise, both the SLE and non-SLE groups had similarly increased rates of Kaposi's despite HIV being more frequent in the non-SLE group.
The SLE group as a whole had a greater increase in risk of melanoma than non-SLE renal transplant recipients. When stratified by race or ethnicity, this increased risk was noticeable primarily in non-whites and Hispanics from the non-SLE transplant group. Since in the general population non-whites are less likely than whites to develop melanoma, we suspect that some risk factor in the renal transplant population is driving melanoma risk in this subset.21 Furthermore, additional analysis showed similar overall cancer by sex (data not shown), suggesting that sex was not a significant confounder or effect modifier. CMV positivity at time of renal transplantation was higher in the SLE versus the non-SLE group, 55.3% vs 52.5%, p=0.0001. CMV positivity was associated with higher risk of cancer.
Due to the limitations of the USRDS database, we were unable to assess certain relevant variables. We were unable to adjust for differences in other donor/recipient characteristics except as documented in table 1. We were only able, for example, to estimate current (not past) smoking, but we still noted a significant association of smoking with cancer overall.17 Non-transplanted patients with SLE have an increased incidence of some types of cancer;10 the use of the general population as the reference group may be a confounding factor. In this study, we compared cancer incidence rates with the general population because of the need of reliable estimates for the cancer rates in each age/gender groups (as used in the SIR calculations), which requires large data set, unavailable for lupus patients only.
At baseline, patients with SLE are in fact less likely than the general population to undergo breast, colorectal and cervical cancer screening than patients without SLE.22 Better cancer screening follow-up after transplantation may partially explain the increased incidence of breast cancer in this study, whereas other studies have demonstrated a decreased breast cancer risk in the general SLE population.23 It should be kept in mind that the follow-up of our current study was relatively short (since the average duration of follow-up is half of the average follow-up in most general SLE cohort studies).
Another limitation of this study is the absence of data on medications used prior to and after renal transplantation, including immunosuppressive regimen post-transplant. We were also unable to assess duration of lupus or temporal trends in its treatment. Azathioprine and cyclophosphamide, often used for the treatment of lupus nephritis, have been linked to haematological malignancy and hepatobiliary cancer in transplant populations,24–26 although these have not been clearly linked to cancer in the general SLE population. Cyclophosphamide is associated with bladder cancer, non-melanoma skin cancers and haematological malignancies.27 ,28 Furthermore, calcineurin inhibitors used in renal transplant patients may interfere with the antiviral mechanisms of natural killer cells,29 leading to the proliferation of HPV, which causes cervical and oropharyngeal cancers.30 A newer class of immunosuppressives, the mammalian target of rapamycin inhibitors, is hypothesised to have tumour-suppressive effects.31 ,32
The cancer SIRs for SLE transplant recipients are higher than the SIRs estimated from the general SLE population.10 This is most likely because in the current study we used Medicare claims data to ascertain cancer, which may overestimate cancer risk compared with cancer registry linkage (which has standardly been used in studies of cancer risk in the general SLE population). As well, much of the cancer risk data in the literature comes from clinically confirmed patients with SLE, we did not have clinical confirmation of SLE in the current study. Other potential explanation for the higher SIR in our current study is that patients with SLE who undergo transplantation may truly be at higher risk for cancer than the general SLE population, possibly because of their specific profiles of disease activity and drug exposures.
We have shown that the SLE group had an increased risk of melanoma versus the non-SLE group. In the SLE group, non-whites had an increased risk of melanoma and thyroid and renal cancers compared with other races, and Hispanics had an increased risk of ovarian cancer compared with non-Hispanics. Additional research is needed to elucidate the mechanisms underlying the increased risk of malignancy after renal transplantation, in particular the effect of race and ethnicity on post-transplant cancers. Prospective trials will be needed to study the cost-effectiveness of cancer surveillance in both SLE and non-SLE transplant groups.
References
Footnotes
Prior presentations: Portions of this work have previously been presented at the October 2013 American College of Rheumatology Annual Meeting, San Diego, California, USA.
Contributors All authors have participated in the study design, analysis and writing of the paper.
Funding This study was supported by the National Cancer Institute (NCI) (R03-CA173822).
Disclaimer The data reported have been supplied by the United States Renal Data System (USRDS). The interpretation and reporting of these data are the responsibility of the authors and do not reflect the position or policy of the Department of Veterans Affairs, Department of Health and Human Services, National Cancer Institute, Department of Defense, US government or other organisations with which authors are affiliated.
Competing interests None declared.
Ethics approval Northwestern University, IRB project number: STU00065141.
Provenance and peer review Not commissioned; externally peer reviewed.
Data sharing statement No additional data are available.