Article Text

Abstract
Background The relationship between cell-bound complement activation products (CB-CAPs: EC4d, EC3d), anti-C1q, soluble complement C3/C4 and disease activity in systemic lupus erythematosus (SLE) was evaluated.
Methods Per protocol, at baseline all SLE subjects enrolled in this longitudinal study presented with active disease and elevated CB-CAPs. At each monthly visit, the non-serological (ns) Safety of Estrogens in Lupus Erythematosus: National Assessment (SELENA-SLEDAI) and the British Isles Lupus Assessment Group (BILAG)-2004 index scores were determined as was a random urinary protein to creatinine ratio (uPCR). Short-form 36 (SF-36) questionnaires were also collected. All soluble markers were determined using immunoassays, while EC4d and EC3d were determined using flow cytometry. Statistical analysis consisted of linear mixed models with random intercept and fixed slopes.
Results A total of 36 SLE subjects (mean age 34 years; 94% female) were enrolled and evaluated monthly for an average 11 visits per subject. Clinical improvements were observed during the study, with significant decreases in ns-SELENA-SLEDAI scores, BILAG-2004 index scores and uPCR, and increases in all domains of SF-36 (p<0.01). The longitudinal decrease in ns-SELENA-SLEDAI and BILAG-2004 index scores was significantly associated with reduced EC4d and EC3d levels, reduced anti-C1q titres and increased serum complement C3/C4 (p<0.05). The changes in uPCR significantly correlated with C3, C4, anti-C1q and EC4d, with EC4d outperforming C3/C4 by a multivariate analysis. The reduced EC4d or EC3d was associated with improvements in at least six out of the eight domains of SF-36 and outperformed C3/C4. Anti-dsDNA titres did not correlate with changes in disease activity.
Conclusions These data indicate that CB-CAPs and anti-C1q are helpful in monitoring patients with SLE.
- Systemic Lupus Erythematosus
- Disease Activity
- Treatment
This is an Open Access article distributed in accordance with the Creative Commons Attribution Non Commercial (CC BY-NC 4.0) license, which permits others to distribute, remix, adapt, build upon this work non-commercially, and license their derivative works on different terms, provided the original work is properly cited and the use is non-commercial. See: http://creativecommons.org/licenses/by-nc/4.0/
Statistics from Altmetric.com
Introduction
Systemic lupus erythematosus (SLE) is a chronic autoimmune rheumatic disease resulting in autoantibody-mediated tissue damage and potentially life-threatening multi-organ failure.1 Over the past two decades, significant efforts in understanding SLE have led to the paradigm that deregulation of the classical complement system is central to disease pathogenesis2 inclusive of the generation of anaphylatoxins and through mechanisms associated with defective clearance of apoptotic materials,3 ,4 alteration in the negative selection of autoreactive B cells5 and the development of an environment conducive to autoimmunity due to alterations in T-cell functions.6 ,7
SLE disease activity can be monitored using validated instruments such as the Safety of Estrogens in Lupus Erythematosus: National Assessment (SELENA-SLEDAI) or the British Isles Lupus Assessment Group (BILAG) index.8 ,9 However, these formal instruments are generally applied only in a research setting, and are difficult to implement in clinical practice. Traditionally, the physician's overall clinical assessment of SLE disease, inclusive of history, physical examination and routine laboratory evaluation, is often accompanied by monitoring anti-dsDNA antibodies and serum complement C3 and C4 proteins that tend to be consumed when the disease is active. However, because C3 and C4 are also acute-phase reactants, these markers have limitations as their production during systemic inflammatory processes can mask their consumption. As an alternative, many investigators have proposed that the determination of complement activation products could have utility both in monitoring response to therapy and in predicting flares.10 ,11 However, the relative instability of these products in their soluble forms (eg, C3a, C5a, C4d and C3d) and their short half-lives in blood considerably limit their usage in clinical practice.12–14
More recently, stable deposits of complement activation products on haematopoietic cells were identified as valuable tools for the diagnosis and monitoring of SLE disease.15–18 These cell-bound complement activation products (CB-CAPs) include complement C4d-derived and C3d-derived ligands deposited on erythrocytes as well as other haematopoietic cells.15 ,18 ,19 In addition, patients with SLE have reduced levels of the CR1 receptor (CD35)15 on erythrocytes (ECR1) and an increased likelihood of accumulation of pathogenic immune complexes at sites such as the kidney. It follows that measurements of C4d and C3d deposition on cells together with determination of ECR1 expression may improve monitoring of SLE activity.18 ,20 Moreover, biomarkers, such as anti-C1q antibodies that target the first component of the classical complement pathway, have proven valuable in the assessment of SLE subjects presenting with nephritis.21
Accordingly, this study was initiated to prospectively determine the value of these biomarkers as disease-monitoring tools during longitudinal follow-up of active patients. This was approached by enrolment of patients who had clinically active disease as assessed by the SELENA-SLEDAI and BILAG and elevations of CB-CAPs with monthly follow-up for a year.
Methods
Adult SLE subjects fulfilling the 1982 American College of Rheumatology (ACR) criteria modified in 199722 ,23 were enrolled in this multicentre prospective study. Internal review boards at each site approved the study, and all subjects provided informed consent. Patients were initially screened for abnormally elevated levels of CB-CAPs (EC4d>14 mean fluorescent intensity (MFI) or BC4d>60 net MFI) and active disease.24 Active disease was defined as a Systemic Lupus Erythematosus Disease Activity Index SELENA modification (SELENA-SLEDAI)8 greater than 5 points, or the presence of BILAG A score in at least one domain or B scores in at least two domains.9
After screening, all subjects presenting with active disease and elevated CB-CAPs (as defined above) were enrolled and followed monthly. At each visit, blood was collected and shipped to the central research laboratory for testing, while the non-serological (ns) SELENA-SLEDAI (without anti-dsDNA and low complement components) and BILAG-2004 index scores25 were determined as was a random urinary protein to creatinine ratio (uPCR) (expressed in g/g). The patient-reported outcomes consisting of short-form 36 (SF-36) questionnaires were also collected at each visit and each of the eight domains was scored individually. Serum complement C3 and C4 and anti-dsDNA levels were determined using standard immunochemistry techniques at each of the sites and were available to clinicians as part of the clinical assessments and disease activity scoring. Cell surface markers, consisting of EC4d, EC3d and ECR1, were determined using quantitative flow cytometry as per the standard operating procedures in use in the central research laboratory accredited by the College of American Pathologists.17 As previously reported, these markers are stable during transportation of blood from remote sites to the central clinical laboratory.13 Representative histograms for EC4d, ECR1 and EC3d are provided in online supplementary figure S1, in which results are expressed as net MFIs. All clinicians were blinded to these flow cytometric markers throughout the study. Anti-dsDNA (Quanta Lite, Inova Diagnostics, San Diego, California, USA) were also assayed at the central clinical laboratory in addition to the local laboratories at each site and anti-C1q (Inova Diagnostics) levels were determined using ELISA. Treatments were recorded at each visit, and corticosteroids dosage (methylprednisolone and prednisone) was converted to prednisone equivalent (1 mg methylprednisone is equivalent to 1.25 mg prednisone) and expressed in mg/kg/day.
supplementary figures and tables
The statistical analysis consisted of linear mixed models with random intercept and fixed slopes. EC4d, EC3d and ECR1 expressions (net MFIs) were log-normalised for the statistical analysis. In this model, the dependent variables were the disease activity measures (ns-SELENA-SLEDAI and BILAG-2004 index scores and uPCR) or each of the eight domains of SF-36, and the independent variables (predictors) were the biomarkers and prednisone dosage. Multivariate analyses were used as appropriate, as were non-parametric Wilcoxon and Mann-Whitney tests.
Results
A total of 59 subjects (93% women, mean age 34 years) fulfilling the 1982 ACR criteria revised in 1997 were screened for enrolment between March 2013 and June 2014. Four institutions participated in the enrolment with adjudication independently conducted by a clinician affiliated with another institution (KK). Of these 59 subjects, 18 did not meet the criteria for enrolment. The reasons for screen failures were as follows: 16 subjects did not fulfil the criteria for active disease (11 of whom did have abnormal CB-CAPs), and two subjects presented with active disease but without elevated CB-CAPs. Thus, 95% of subjects (41/43) screened with active disease had abnormal CB-CAPs. Of the 41 eligible subjects, 36 (94% women, mean age 34 years) were evaluated for a minimum of two follow-up visits (total of 385 visits, average of 10.7±0.5 (SEM) visits per patient). The baseline characteristics of the 36 SLE subjects are presented in table 1. The online supplementary tables I–IV describe ACR classification features, baseline organ involvement, treatment information and SF-36 scores.
Baseline characteristics of the 36 SLE subjects
There were significant decreases in disease activity measures between baseline and last follow-up visit (10.7±0.5 months, average±SEM from baseline). The mean ns-SELENA-SLEDAI score decreased by 4.3±1.1 points (6.8±0.8 vs 2.6±0.7 points, p<0.001), the mean BILAG-2004 index score decreased by 6.4±1.1 points (15.2±1.7 vs 8.8±1.2 points, p<0.001), and the mean uPCR decreased by 1.4±0.6 g/g (2.4±0.6 vs 0.8±0.02 g/g, p=0.03) from baseline to the last visit. The linear mixed model effects revealed similar trends during follow-up visits. There was an estimated 0.13±0.04 point (p=0.004) decrease in ns-SELENA-SLEDAI for each month the patient was followed (intercept=4.7±0.6 points), and similarly a 0.29±0.08 point (p<0.001) decrease in the BILAG-2004 index score (intercept 12.2±1.0 points). The estimate for the decrease in uPCR was 0.6±0.2 g/g (intercept=1.8±0.3 g/g) (p<0.01). These clinical improvements were also reflected in all domains of SF-36 (see online supplementary table IV). Mean prednisone equivalent dosage decreased by 0.06± mg/kg/day from baseline to the last visit (0.18± vs 0.12± mg/kg/day, p<0.001).
Significant reductions in C4d and C3d levels bound to erythrocytes were observed between baseline and last follow-up visits. The baseline EC4d was 52.3±19.8 net MFI compared with 24.9±3.7 net MFI at the last visit (average change was −27.4±18.0 net MFI, p=0.006). Similarly, EC3d decreased from 14.4±9.2 net MFI to 3.8±0.6 net MFI (average change was −10.8±9.0 net MFI, p=0.047). Conversely, increases were observed in complement C4 and C3 levels between baseline and last follow-up visits. For C4, the baseline level was 15.4±1.3 mg/dL compared with 18.4±1.4 mg/dL at the last follow-up (average change +3.0±1.2 mg/dL, p=0.01). C3 levels were 76.5±5.4 mg/dL and 85.8±5.1 mg/dL at the initial and last visits, respectively (change was +8.7±3.7 mg/dL, p=0.021). The anti-C1q titres decreased between baseline and last visit (58.8±11.3 vs 23.9±5.7 units, change was −34.9±10.5 units, p<0.001). The change between the baseline and last visit for ECR1 (13.2±1.0 net MFI vs 14.3±1.4 net MFI, change was +1.1±1.2 net MFI, p=0.774) was not statistically significant. Similarly, the changes in anti-dsDNA levels determined at each of the sites, or anti-dsDNA levels determined in our clinical laboratory (498.5±61.2 vs 530.9±66.2 units, change was 32.4±43.4 units, p=0.625), were not significantly different between the first and the last visits.
The relationship between the changes in disease activity and these biomarkers was evaluated. The linear mixed models indicated that the decrease in ns-SELENA-SLEDAI score was associated with increases in serum C3 (estimate: −0.03±0.01, p=0.004) and C4 levels (estimate: −0.13±0.04; p=0.001), and conversely with decreases in EC4d (estimate: 0.9±0.4, p=0.036) and EC3d levels (estimate: 0.8±0.3, p=0.013). Clinical improvements were also associated with an increase in ECR1 expression, and decreases in anti-C1q and anti-dsDNA titres (p<0.05) (figure 1 and online supplementary table V). In the multivariate analysis, serum C4 levels remained associated with the change in ns-SELENA-SLEDAI (p<0.01), while the changes in EC4d (p=0.13) and EC3d (p=0.06) levels were no longer statistically significant. The linear mixed modelling effects also revealed that the improvements in ns-SELENA-SLEDAI paralleled the reduction in prednisone equivalent dosage (estimate: 0.43±0.1, p<0.001, online supplementary figure S2).

Change in non-serological (ns) Safety of Estrogens in Lupus Erythematosus: National Assessment (SELENA-SLEDAI) as a function of serum C4, C3, anti-C1q, EC4d, EC3d and ECR1. Linear mixed model effects indicated that the decrease in ns-SELENA-SLEDAI was associated with an increase in C4 (p=0.001) and C3 level (p=0.004) and ECR1 (p=0.027). Conversely, the decrease in ns-SELENA-SLEDAI was associated with a decrease in EC4d (p=0.036), EC3d (p=0.013), anti-C1q (p=0.010) and anti-dsDNA (Quanta Lite) (p=0.022). Each data point represents the mean at each given study visit.
The decrease in the BILAG-2004 index scores was associated with increased C3 (estimate: −0.06±0.02, p=0.007) and C4 (estimate: −0.31±0.07, p<0.001) levels, decreased EC4d (estimate: 1.7±0.8, p=0.026), EC3d (estimate: 2.4±0.6, p<0.001) and anti-C1q (estimate: 0.03±0.01, p=0.01). Anti-dsDNA was not associated with the change in BILAG-2004 index scores (figure 2 and online supplementary table VI). The multivariate analysis indicated that increased serum C4 (p=0.001) and reduced EC3d (p=0.001) levels were independently associated with the BILAG-2004 index scores. However, the reduction in EC4d was not significantly associated with the decrease in BILAG-2004 index score after adjusting for serum C4 levels (p=0.13). The linear mixed modelling effects also revealed that the improvements in the BILAG-2004 index scores paralleled the reduction in prednisone equivalent dosage (estimate: 9.9±2.0, p<0.001).

Change in British Isles Lupus Assessment Group (BILAG)-2004 index scores as a function of C4, C3, anti-C1q, EC4d, EC3d and ECR1. Linear mixed model effects indicated that the decrease in BILAG-2004 index score was associated with an increase in C4 (p<0.001) and C3 level (p=0.007), and ECR1 (p=0.088). Conversely, the decrease in BILAG-2004 index score was associated with a decrease in EC4d (p=0.026), EC3d (p<0.001) and anti-C1q (p=0.001). Anti-dsDNA (Quanta Lite) was not associated with the change in BILAG-2004 index score (p=0.669). Each data point represents the mean at each given study visit.
The increases in C3 (estimate: −0.02±0.01 g/g; p=0.004) and C4 (estimate: −0.06±0.02 g/g; p=0.004) as well as elevations in ECR1 were associated with decreased proteinuria (estimate: −0.7±0.2 g/g, p=0.006). The reductions in EC4d (estimate: +0.9±0.2 g/g, p<0.001) and anti-C1q titres (estimate: 0.006±0.003 g/g, p=0.026) were also associated with reductions in proteinuria (figure 3 and online supplementary table VII). The changes in anti-dsDNA and EC3d were not associated with changes in proteinuria (p>0.2). A multivariate analysis with four predictors, soluble complement protein C3/C4, EC4d and ECR1 expression, revealed that the changes in C3 and C4 were not associated with the change in proteinuria, while reduced EC4d (p<0.02) and increased ECR1 (p<0.001) were associated with a reduction in uPCR (table 2). There was no relationship between the reduction in prednisone dosage and the decrease in uPCR (p=0.43).
Multivariate linear mixed models effects of uPCR with biomarkers
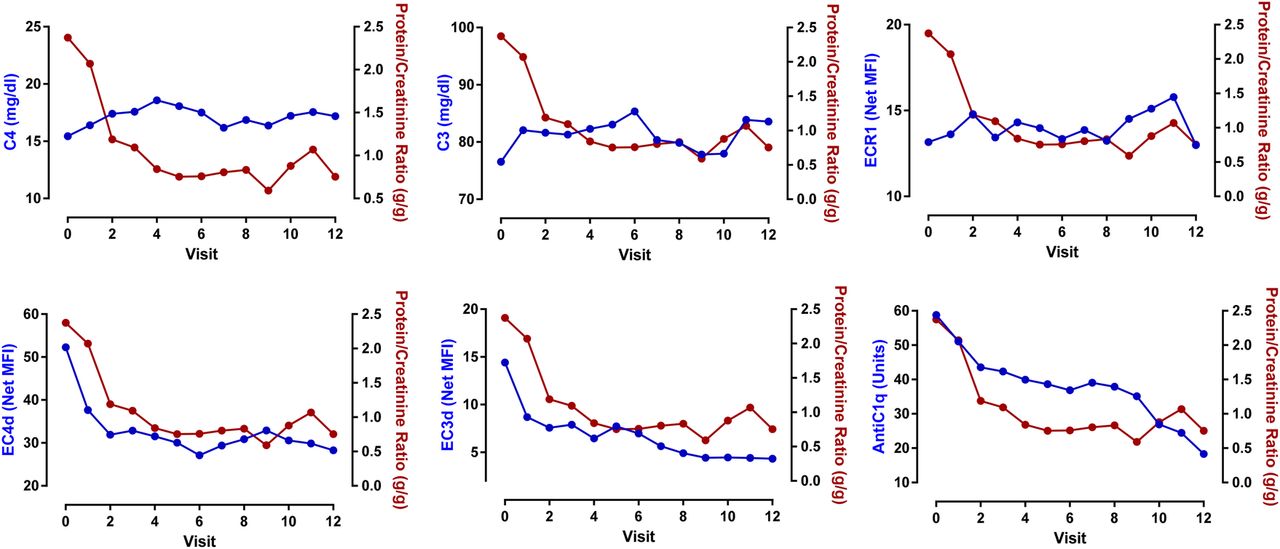
Change in urinary protein to creatinine ratio (uPCR) as a function of serum C4, C3, anti-C1q, EC4d, EC3d and ECR1. Linear mixed model effects indicated that the decrease in uPCR was associated with an increase in C4 (p=0.004) and C3 level (p=0.004), and ECR1 (p=0.006). Conversely, the decrease in uPCR was associated with a decrease in EC4d (p<0.001) and anti-C1q (p=0.026). Anti-dsDNA (Quanta Lite) and EC3d were not associated with the change in uPCR (p>0.24). Each data point represents the mean at each given study visit.
Finally, the analysis with patient-reported outcomes revealed that reduced EC4d or EC3d was associated with improvements in at least six out of the eight domains of SF-36. In contrast, the other markers were each associated with two or fewer SF-36 domains. The results are summarised in table 3.
Linear mixed model estimates for the biomarkers and the eight domains of SF-36
Discussion
We previously confirmed that CB-CAPs are valuable tools in SLE diagnosis17 as excessive C4d complement deposition on erythrocytes and B cells is generally several-fold higher in SLE compared with other rheumatic diseases.15 ,17 ,24 In addition, our cross-sectional data revealed that CB-CAPs were associated with high disease activity as assessed using ns-SELENA-SLEDAI, a finding consistent with the previous data from other groups.18 ,19
The objective of this multi-centred study was to prospectively validate and confirm the relationship between complement activation products and SLE disease activity. We specifically designed this monitoring study by selecting a population of patients with SLE having active disease and abnormal CB-CAPs as we hypothesised that decreases in complement activation products would follow clinical improvements. As predicted, the vast majority of subjects presenting with active disease during screening had elevated CB-CAPs. Our results indicate that the reduction in complement activation products (C4d and C3d) deposited on erythrocytes paralleled clinical improvements as determined using validated disease activity indices (ns-SELENA-SLEDAI and the BILAG-2004 index scores). Conversely, the increases in C3 and C4 were associated with decreased disease activity. However, the multivariate analysis indicated that complement C4 (whose levels were available to clinicians throughout the study) outperformed EC4d in its association with ns-SELENA-SLEDAI and BILAG-2004 index scores. Yet, a similar analysis with BILAG-2004 index score revealed that EC3d was associated with clinical improvements after adjusting for C4 levels, thereby indicating that both serum C4 and EC3d have independent and additive values in tracking changes in disease activity.
In this cohort of patients with SLE, the improvements in uPCR were associated with increased complement C3/C4 levels, decreased EC4d levels and increased ECR1 expression. These data are consistent with the notion that immune deposits in the kidney can activate complement and augmented expression of ECR1 may facilitate their clearance. As already proposed, the determination of EC4d may have value in the assessment of lupus nephritis,20 and our data confirm that this non-invasive biomarker is informative of renal involvement. Interestingly, the multivariate analysis with serum complement proteins, EC4d and ECR1 densities revealed that EC4d and ECR1 outperformed traditional complement measures. While additional data will be required to confirm the association with ECR1, EC4d is emerging as a useful marker in the management of lupus nephritis.
A wealth of data26 ,27 suggests that anti-C1q titres are associated with renal involvement, and our data confirm that this biomarker is valuable in the assessment of renal disease. In this study, the changes in anti-C1q titres were associated with the changes in ns-SELENA-SLEDAI and BILAG-2004 index score, thereby indicating more general utility of this marker in the assessment of overall lupus disease activity. The anti-dsDNA titres determined at each site or in our clinical laboratory were less reliable markers of disease activity and clinical improvements. We are currently evaluating the performance characteristics of other anti-dsDNAs in monitoring SLE disease.
Many investigators have recognised the limitations of current SLE measures as part of the SLE assessment in clinical trials. Patient-reported outcomes are emerging as valuable instruments in the assessment of lupus. The data in this study establish that complement activation measures outperformed traditional complement measures, and reductions in EC4d and EC3d were generally associated with significant improvement in the quality of life.
The strength of this study includes the prospective design with patients followed monthly during follow-up for a period of 11 months. The biomarkers were correlated with two different SLE outcome measures in addition to patient-reported outcomes. Overall, the data are consistent with those from another study, which established EC4d and EC3d as valuable disease-monitoring tools.18 However, there are limitations owing to the study design, and about a third of SLE subjects screened did not fulfil our criteria for enrolment (active disease in the context of elevated CB-CAPs). As such we cannot assume generalisability of the findings to patients with SLE who are without active disease or to those with minimal complement activation at baseline. It will be important to establish the performances of these markers in this context. Moreover, because the majority of subjects enrolled had a history of lupus nephritis (64%), the contributions of CB-CAPs to disease activity indices may be primarily dependent on renal involvement. Other studies will be required to establish the performances of these markers in subjects without nephritis. Finally, we monitored clinical improvements in this population of patients all presenting with disease exacerbations, and it is not known whether clinical worsening and emergence of flares are associated with earlier elevations in complement activation products. While additional studies will be required to establish the predictive values of EC4d and EC3d in the development of flares, our data support the notion that these biomarkers can be helpful in tracking disease activity. In conclusion, a panel of biomarkers consisting of soluble C3/C4 complement proteins, C3d/C4d complement activation products deposited on erythrocytes and anti-C1q are promising candidates for the monitoring of SLE disease. The relationship between EC4d and proteinuria is particularly promising.
Acknowledgments
We thank all subjects for participating in the study and Claudia Ibarra for the management of our clinical laboratory. We also thank Tyler O'Malley, Joanne Ligayon, Leilani Wolover and the clinical coordinators at each of the sites for technical assistance and management of the clinical protocol.
References
Footnotes
Contributors All authors participated in the collection of data and data interpretation. TD wrote the first draft of the manuscript in collaboration with JB and all authors approved the final manuscript.
Funding JB, KK, RR-G, RF and CP have received research grants from Exagen Diagnostics. TD, DB and JC are employed by Exagen Diagnostics.
Competing interests Exagen Diagnostics.
Patient consent Obtained.
Ethics approval Internal review boards approved the study.
Provenance and peer review Not commissioned; externally peer reviewed.
Data sharing statement No additional data are available.