Article Text

Abstract
Objectives Interferon (IFN)-α is thought to be central in the pathogenesis for lupus nephritis (LN) and recent studies also indicate a role for IFNλ. Little is known about these cytokines in the context of treatment response. We studied levels of IFNα and IFNλ in patients with LN in association with clinical and histological response (HR) to treatment.
Methods Fifty-six patients with active LN were included. Renal biopsies were performed at baseline and after immunosuppressive therapy. Serum levels of IFNα and IFNλ were analysed at both biopsy occasions and in 163 controls. The biopsies were evaluated according to the International Society of Nephrology/Renal Pathology Society classification. Clinical response was defined according to recent definitions. HR was defined as class I, II or III/IV-C on repeat biopsies. The expression of IFNλ in renal tissue was assessed by immunohistochemistry.
Results At baseline, serum levels of both IFNα and IFNλ were higher in patients versus controls (p=0.01 and p=0.03, respectively). There was no correlation between IFNα and IFNλ. Overall, IFNα decreased after treatment (p=0.003) but IFNλ remained unchanged. However in patients with HR, IFNλ decreased (p=0.01). The highest levels of IFNλ were seen in patients with poor HR. Immunostaining of renal tissue revealed expression of IFNλ, particularly in crescent formations, inflammatory infiltrates and tubular cells.
Conclusions The study supports a role for IFNλ in LN, both in circulation and at a tissue level. Levels of IFNα and IFNλ did not correlate and were affected differently by immunosuppression, indicating that they are differently involved in subgroups of LN. Persistent increased levels of IFNλ were associated to an unfavourable HR to treatment.
- Interferon
- Lupus Nephritis
- Systemic Lupus Erythematosus
This is an Open Access article distributed in accordance with the Creative Commons Attribution Non Commercial (CC BY-NC 4.0) license, which permits others to distribute, remix, adapt, build upon this work non-commercially, and license their derivative works on different terms, provided the original work is properly cited and the use is non-commercial. See: http://creativecommons.org/licenses/by-nc/4.0/
Statistics from Altmetric.com
Introduction
Lupus nephritis (LN) is a severe manifestation of SLE, affecting up to 60% of the patients at some point of the disease.1 The pathogenesis for LN is not completely understood and involves multiple components of both the innate and adaptive immune systems. Interferon (IFN)-α is claimed to be central in the pathogenesis and several studies support that many of the typical immunological and pathological features of lupus are a consequence of a persistent self-directed immune reaction driven by IFNα. In addition, many patients with SLE have an increased expression of IFNα-regulated genes in mononuclear cells in the peripheral blood (the IFN signature).2 ,3
Type III IFNs are the most recently described members of the IFN family and comprise IFNλ-1 (also called interleukin (IL)-29), IFNλ-2 (IL-28A) and IFNλ-3 (IL-28B). In infected individuals, both type I and III IFNs are important cytokines in antiviral immune responses. Although IFNλ and IFNα share many biological activities, there are also important differences between these IFNs.4 While IFNα is mainly produced by plasmocytoid dendritic cells (pDCs), IFNλ can be produced by various cell types, mainly by antigen-presenting cells. Additionally, IFNα has a variety of target cells while IFNλ acts through a distinct receptor restricted to epithelial cells and some leucocytes (B cells and pDCs).5 ,6 Some recent studies indicate that IFNλ is involved in the pathogenesis of SLE. Increased levels of IFNλ have been demonstrated in patients with SLE, the highest levels were found in patients with renal involvement and arthritis and levels also correlated with disease activity.7 IFNλ was also expressed in skin lesions from patients with SLE.8
Although IFNα is considered central in SLE, and recent data support a role also for IFNλ, not much is known about how these cytokines correlate or how they are affected by immunosuppressive treatment in LN. We aimed to study serum levels of IFNα and IFNλ in patients with LN, both at active disease and after induction immunosuppressive treatment, in association with routine laboratory and histopathological findings as well as in relation to treatment response. As a pilot, we also performed immunohistochemistry staining of IFNλ in renal tissue from nine patients with LN.
Methods
Patients
Fifty-six patients with biopsy-proven active LN who were followed at the department of rheumatology at the Karolinska University Hospital between 1996 and 2011 were included. All patients met at least four of the 1982 American College of Rheumatology classification criteria for SLE.9 The patients were treated in accordance with the standard therapy for LN, corticosteroids combined with intravenous cyclophosphamide (CYC) (n=40), mycophenolate mofetil (n=9) or rituximab (n=6). One patient was treated with azathioprine. The treatment regimen for CYC was 0.5–1 g/m2 monthly as modified from the National Institutes of Health protocol10 or the low-dose CYC regimen according to the EURO-lupus protocol.11 As part of the clinical routine at our unit, all patients except one underwent a second renal biopsy after induction therapy. Repeated renal biopsies were performed after a median time of 7 months (range 5–15). Clinical data, blood and urinary samples were collected on both biopsy occasions. Serum samples were stored at −80°C.
At the time point for the first renal biopsy, 38/56 (68%) of the patients were treated with prednisolone, median dose 20 mg/day (range 2.5–60). At the start of immunosuppressive therapy, all but one (98%) were treated with prednisolone, median dose 40 mg/day, doses ranging from 2.5 to 80 mg/day as decided by the treating physician, and were thereafter successively tapered. At repeat biopsies, 98% of the patients were still treated with prednisolone, median dose 10 mg/day (range 2.5–30). The clinical characteristics of patients and nephritis data at baseline and follow-up are presented in table 1.
Clinical, laboratory and histopathological characteristics at the first and second biopsies
One hundred and sixty-three healthy controls were used as a control group for the IFN analyses. The controls were recruited as population controls for our other larger cohort study in SLE described elsewhere.12 Informed consent was obtained from all subjects and the regional ethics committees in Stockholm approved the study protocol (KI Forskningsetikkommitte Nord, Karolinska sjukhuset; Regionala etikprövningsnämnden i Stockholm).
Evaluation of renal function, histopathology and renal activity
Renal evaluation at the time of both biopsies included urine analyses (dip-slide procedure and urinary sediment) and investigation of 24-hour urine albumin excretion. Renal function was determined by serum creatinine levels (µmol/L).
Renal biopsies were evaluated by light microscopy, immunofluorescence microscopy and electron microscopy. The biopsies were classified according to the International Society of Nephrology/Renal Pathology Society (ISN/RPS) classification,13 and scored for activity and chronicity indices.14
Renal response was defined according to a consensus statement by Gordon et al.15 A complete clinical response (CR) was defined as inactive urinary sediment, proteinuria ≤0.2 g/day and normal glomerular filtration rate >90 mL/min or stable (within 10% of normal if previously abnormal) renal function. Partial response (PR) was defined by inactive sediment, proteinuria ≤0.5 g/day and normal or stable (<10% deterioration from baseline if previously abnormal) renal function. Patients not reaching these criteria were regarded as clinical non-responders (NR).
We also assessed histopathological response; transformation into class I, II or III/IV-C was considered HR whereas persistent class III/IV-A or III/IV-A/C and persistent, or transformation into, class V was considered as histopathological non-response (HNR).
Serology and complement measures
Anti-double-stranded DNA antibodies were analysed using Luminex Bioplex 2200 (Bio-Rad Laboratories, California, USA) according to the routines of the laboratory, cut-off <5 IU/mL. The complement components C3 and C4 were determined by nephelometry. Antibodies against complement component C1q were analysed by ELISA (Alegria, Orgentec Diagnostika GmbH, Germany), cut-off <14 IU/L.
The detection of IFNα and IFNλ
ELISA was performed as indicated by the manufacturer, IFNα was measured by a pan IFNα ELISA detecting kit and the detected IFNα subtypes were 1/13, 2, 4, 5, 6, 7, 8, 10, 14, 16 and 17 (product code 3425-1A-20, Mabtech AB, Nacka, Sweden). IFNλ was measured using a monoclonal mouse IgG2A capture antibody that recognises IFNλ-1 (catalogue number MAB15981, R&D Systems, Minneapolis, Minnesota, USA). For the detection of affinity, purified goat polyclonal anti-IFNλ-1 IgG antibodies were used (catalogue number BAF1598, R&D Systems). In short, high-binding 96 well plates (Nunc) were coated with capture antibody at a concentration of 4 and 8 μg/mL, respectively, for IFNα and IFNλ in a carbonate buffer, pH 9.6 and kept in +4°C overnight. The plates were blocked with 5% (w/v) fat-free milk in Tween for 60 min, washed and incubated with patient sera, diluted ×2 for the detection of IFNα and ×4 for the detection of IFNλ in a dilution buffer (catalogue number 3652-D2, Mabtech AB) and were kept overnight at +4°C. For the derivation of standard curve for IFNα, a standard reagent included in the kit was used; for IFNλ, a recombinant human IL-IFNλ-1 was purchased (R&D Systems, catalogue number 1598-IL). Ten serial dilutions were performed and negative controls were obtained by adding only buffer. All samples were run in duplicates. After washing, biotinylated detection antibodies were diluted in the dilution buffer at a concentration of 1 and 0.4 μg/mL for IFNα and IFNλ, respectively, and incubated for 1 hour at room temperature (RT). After washing, streptavidine–alkaline phosphatase diluted at a ratio of 1:1000 was added and incubated for 1 hour at RT. Afterwards, a substrate solution was added and optical density was measured after 1 hour, 2 hours and overnight, at 405 nm. The detection levels were set according to the manufacturer's recommendation: 0.036 ng/mL for IFNα and 0.3 ng/mL for IFNλ.
Immunohistochemistry
Immunohistochemical (IHC) stainings were performed on formaldehyde-fixed paraffin-embedded serial sections of nine renal biopsies from patients with LN. Six of the renal biopsies were baseline biopsies and three were from repeated biopsies after treatment. All steps were performed at RT, unless otherwise stated. The slides were deparaffinised in xylene and rehydrated to water with ethanol in decreasing concentrations. Antigen retrieval was achieved by microwave irradiation in 10 mM Tris (KEBO) buffer containing 0.5 mM EDTA (Sigma), pH 9.0. Endogenous peroxidase activity was blocked with 3% H2O2 in 0.05 M tris-buffered saline (TBS), pH 7.6. Sections were subsequently treated with an avidin-biotin blocking system (DakoCytomation) to block endogenous biotin-binding sites followed by a 60 min serum block with 3% skim-milk, 7% donkey sera, 3% human AB sera, 3.2 mg/mL poly-L-lysine hydrobromide (Sigma) in TBS. The slides were thereafter incubated overnight at 4°C with primary antibodies (1 μg/mL rabbit anti-IL29, Santa Cruz Biotechnology, or 0.5 μg/mL rabbit anti-CD3, Thermo Fisher Scientific) and isotype controls (rabbit mAb Ig, cell signalling) diluted in TBS supplemented with 0.5% skim-milk and species-specific serum. After washing, a biotinylated donkey anti-rabbit antibody (Jackson ImmunoResearch Laboratories) diluted in TBS with 0.5% skim-milk and species-specific serum was used for detection of the corresponding primary antibody and isotype controls. For signal amplification, the slides were treated with Vectastain ABC complex (Vector Laboratories, Burlingame, California, USA), diluted in 0.1 M Tris buffer containing 0.15 M NaCl and 0.5% (w/v) Du Pont blocking reagent. After washing, biotinylated tyramide (TSA indirect; NEL 700) diluted at a ratio of 1:50 in an amplification buffer (NEN; PerkinElmer Life Sciences, Boston, Massachusetts, USA) was added followed by a second treatment with the Vectastain ABC complex. The stainings were developed using 3,3′-diaminobenzidine tetrahydrochloride (Sigma) dissolved in TBS and counterstained with haematoxylin. The sections were dehydrated and mounted in Pertex (Histolab AB, Sweden).
Statistics
The levels of IFNs were calculated as a ratio from the standard curve. The distribution of values was not normal (D'Agostino-Pearson omnibus normality test), therefore respective non-parametric tests were used when calculating associations with levels of IFNs. We performed the Wilcoxon matched pair test to compare variables at baseline and follow-up. We used the Mann-Whitney U test for comparisons between the two groups. For categorical variables, the χ2 test was used. Correlations were calculated using Spearman's rank correlation. Statistical significance was set at the level of p<0.05. The statistical evaluation was performed using STATISTICA V.9, StatSoft, Tulsa, Oklahoma, USA.
Results
Histopathology and renal activity
All patients had an active nephritis at baseline, 45/56 had proliferative nephritis (PN), class III-A or III-A/C (n=13), class IV-A or IV-A/C (n=26) and class III–IV/V (n=6), and 11/56 had class V membranous nephritis (MN). Follow-up biopsies revealed class I (n=1), class II (n=14), class III-C (n=5), class IV-C (n=1), class III-A or III-A/C (n=8), class IV-A or IV-A/C (n=6), class III–IV/V (n=3) or class V (n=16). One patient developed a renal vasculitis.
There was a decrease in proteinuria at follow-up (p<0.001) whereas no overall difference in creatinine levels was found (data presented in table 1).
CR or PR was observed in 33/56 (59%) patients at the time of repeated biopsies. Nineteen patients had CR (34%), 14 had PR (25%) and 23 had NR (41%).
Twenty-one patients (38%) were regarded as HRs and 34 (62%) as HNRs according to the definition used. The renal activity index decreased significantly (<0.001) whereas there was an increase in the chronicity index (p<0.001).
Serology and complement
At the time point of follow-up biopsies, anti-DNA antibodies had decreased (p<0.001). Anti C1q antibodies also decreased (p<0.001), whereas levels of C3 and C4 increased (p<0.001) (table 1).
Levels of IFNs in patients and controls
Thirty-seven of 56 (66%) patients had detectable levels of IFNα and 17/56 (30%) had detectable levels of IFNλ.
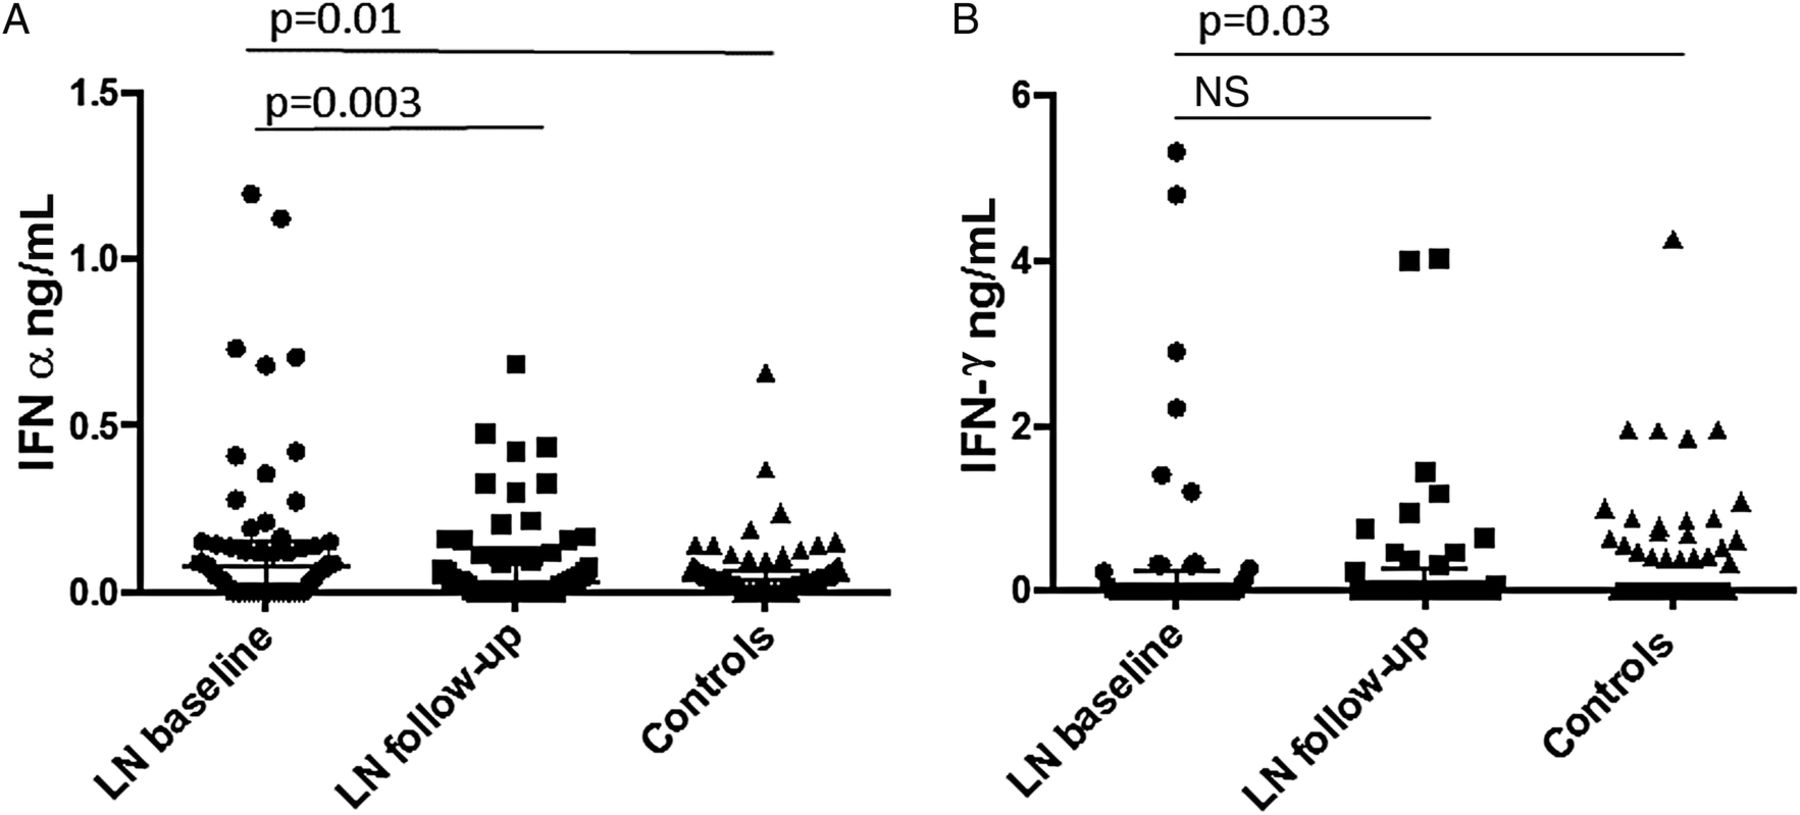
At baseline, serum levels of both IFNα and IFNλ were higher in patients versus controls (p=0.01 and 0.03, respectively) (table 2, figure 1). At follow-up, the levels of IFNα had decreased (p=0.003) but the levels of IFNλ remained unchanged (table 1, figure 1).
Baseline levels of interferon (IFN)-α and IFNλ in patients versus controls

Serum levels of (A) interferon (IFN)-α and (B) IFNλ , at baseline and follow-up, in patients and controls. LN, lupus nephritis; NS, not significant.
There was no correlation between the levels of IFNα and IFNλ either at baseline or at follow-up (data not shown).
Associations between IFN levels, laboratory findings and CR
At baseline, IFNα was positively correlated with anti-DNA (r=0.6) and anti-C1q antibodies (r=0.3, p<0.05 for both) and inversely correlated with C3 and C4 (r=−0.4 for both, p<0.05). No correlations were seen between IFNλ and antibodies or complement levels. Neither IFNα nor IFNλ correlated with proteinuria or creatinine at either baseline or follow-up, and there was no clear association with CR (data not shown).
Associations between IFN levels and HR
At baseline biopsies, there was a trend, although not significant, towards higher levels of IFNα in patients with PN versus patients with MN (p=0.06) and higher levels of IFNλ in patients with MN versus patients with PN (p=0.052). In PN, 73% of the patients had detectable IFNα versus 36% in MN (p=0.02). In PN, 27% of the patients had detectable IFNλ versus 45% in MN (NS).
Overall, the levels of IFNλ had not decreased at follow-up. However, in the subgroup of patients with an HR, the levels of IFNλ decreased after treatment (p=0.01), while those remained unchanged in the subgroup of patients with a HNR (figure 2). No difference in IFNα levels was seen in HR versus HNR. Increasing levels of IFNλ after treatment were only seen in HNR.
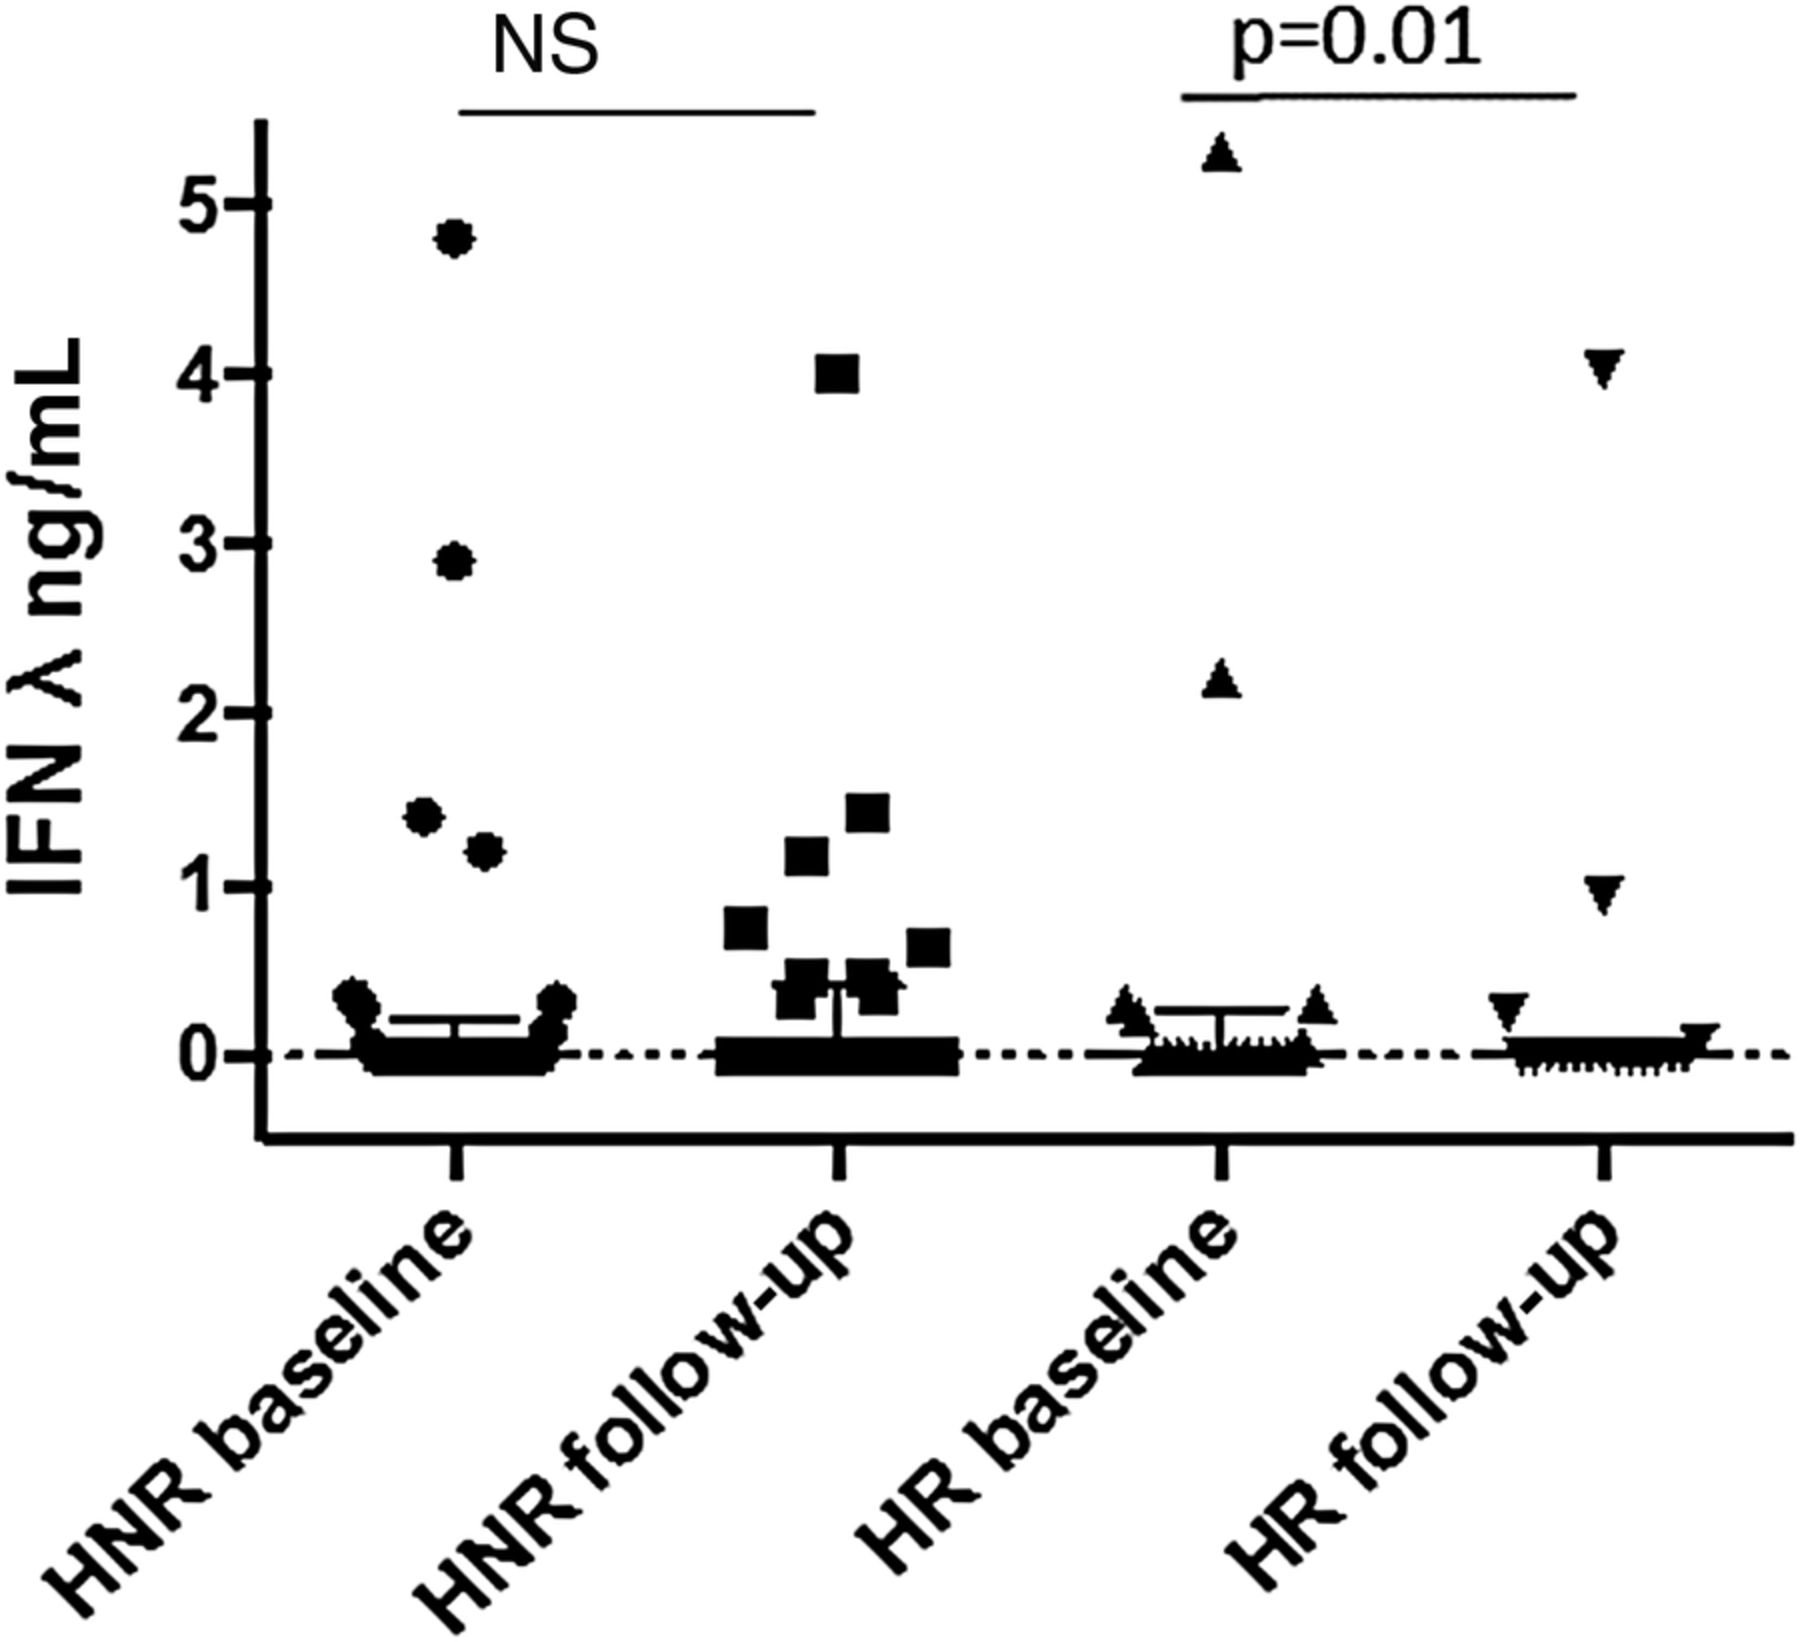
Serum levels of interferon λ, at baseline and follow-up, in patients with histological response and histological non-response. HNR, histological non-response; HR, histological non-response; IFN, interferon; NS, not significant.
IFNλ expression in renal tissue
Immunostaining revealed expression of IFNλ in all the examined renal biopsies from patients with LN. The staining was most pronounced in glomeruli with cellular crescent formations and was also expressed in areas of inflammatory infiltrates of CD3+ T cells and in tubular cells (figures 3 and 4).
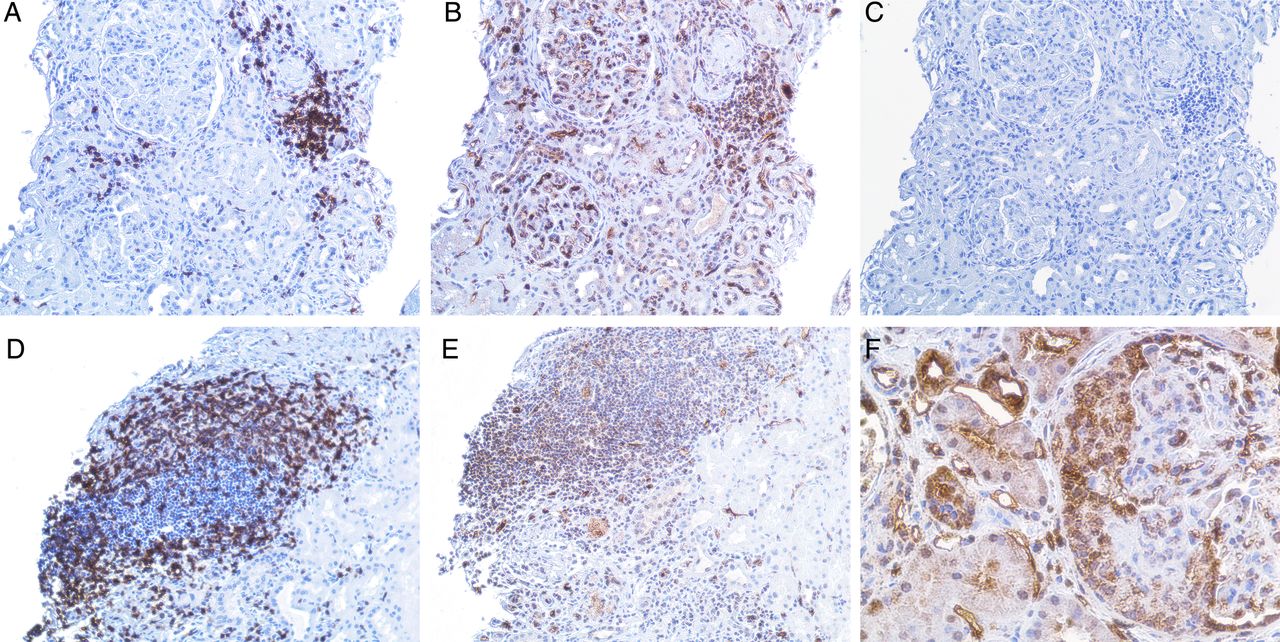
(A–E) demonstrate a kidney biopsy from a patient with lupus nephritis (LN) class V. Representative micrographs: (A), an inflammatory infiltrate with T cells as demonstrated by a positive CD3 staining. (B), demonstration of interferon (IFN)-λ staining, predominantly found in the inflammatory infiltrate shown in (A) but also present in the glomeruli. (C), the same infiltrate from a consecutive section, stained with irrelevant isotype control antibody. (D), another part of the biopsy from the same patient, showing an inflammatory infiltrate with T cells as demonstrated by positive CD3 staining. (E), demonstration of IFNλ staining in that infiltrate. Original magnifications: ×20. (F), predominant expression of IFNλ in a cellular crescent formation in the glomeruli (original magnifications: ×40) in a kidney biopsy from a patient with LN class IV.
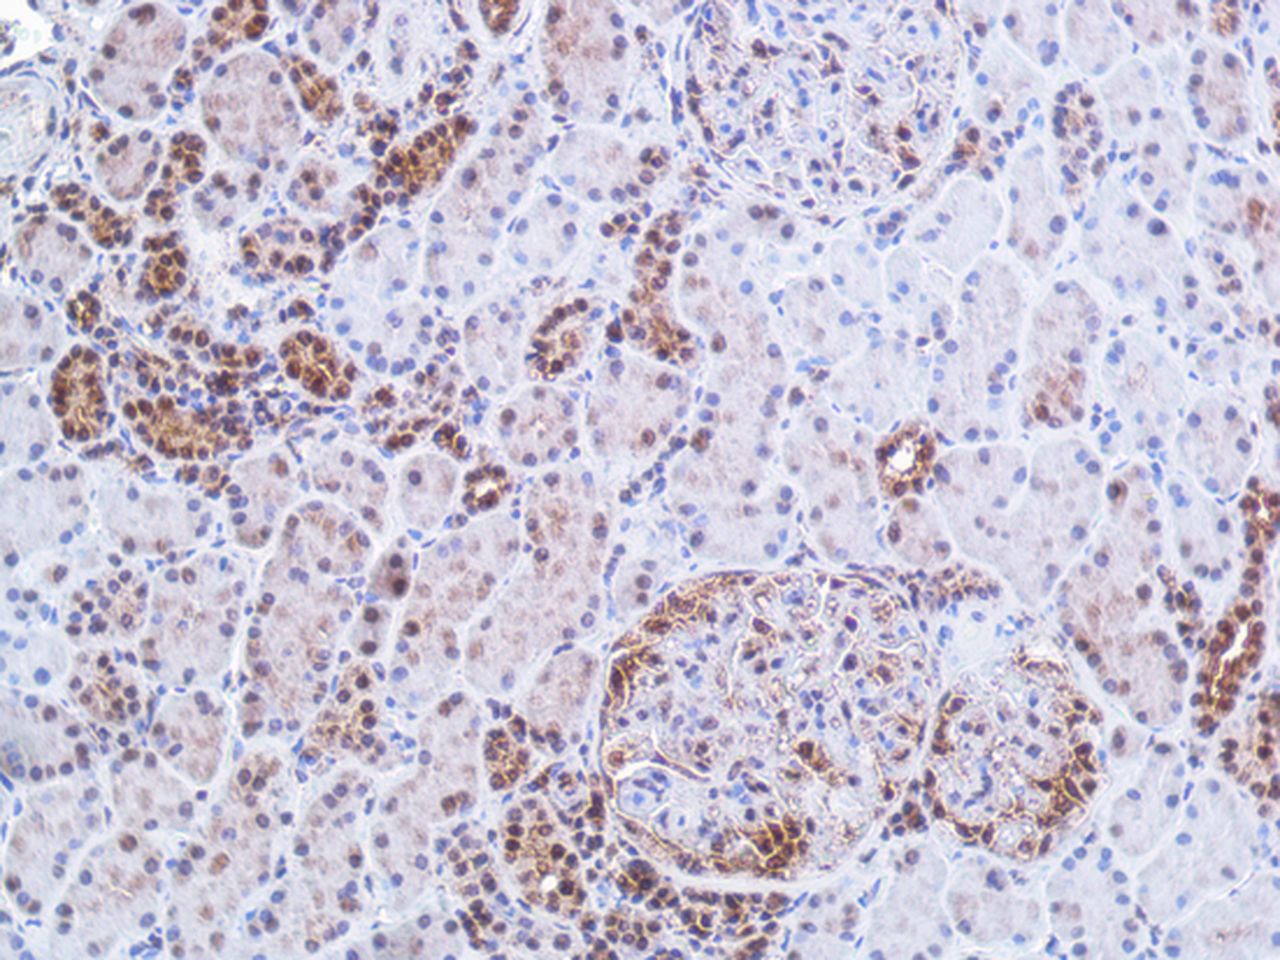
Immunohistochemistry staining of interferon (IFN)-λ in renal tissue. The figure demonstrates a kidney biopsy from a patient with lupus nephritis class IV. The representative micrograph displays IFNλ staining predominantly found in tubular cells and in an incipient cellular crescent in the glomeruli. In the glomeruli without crescent, the staining is sparse. Original magnifications: ×20.
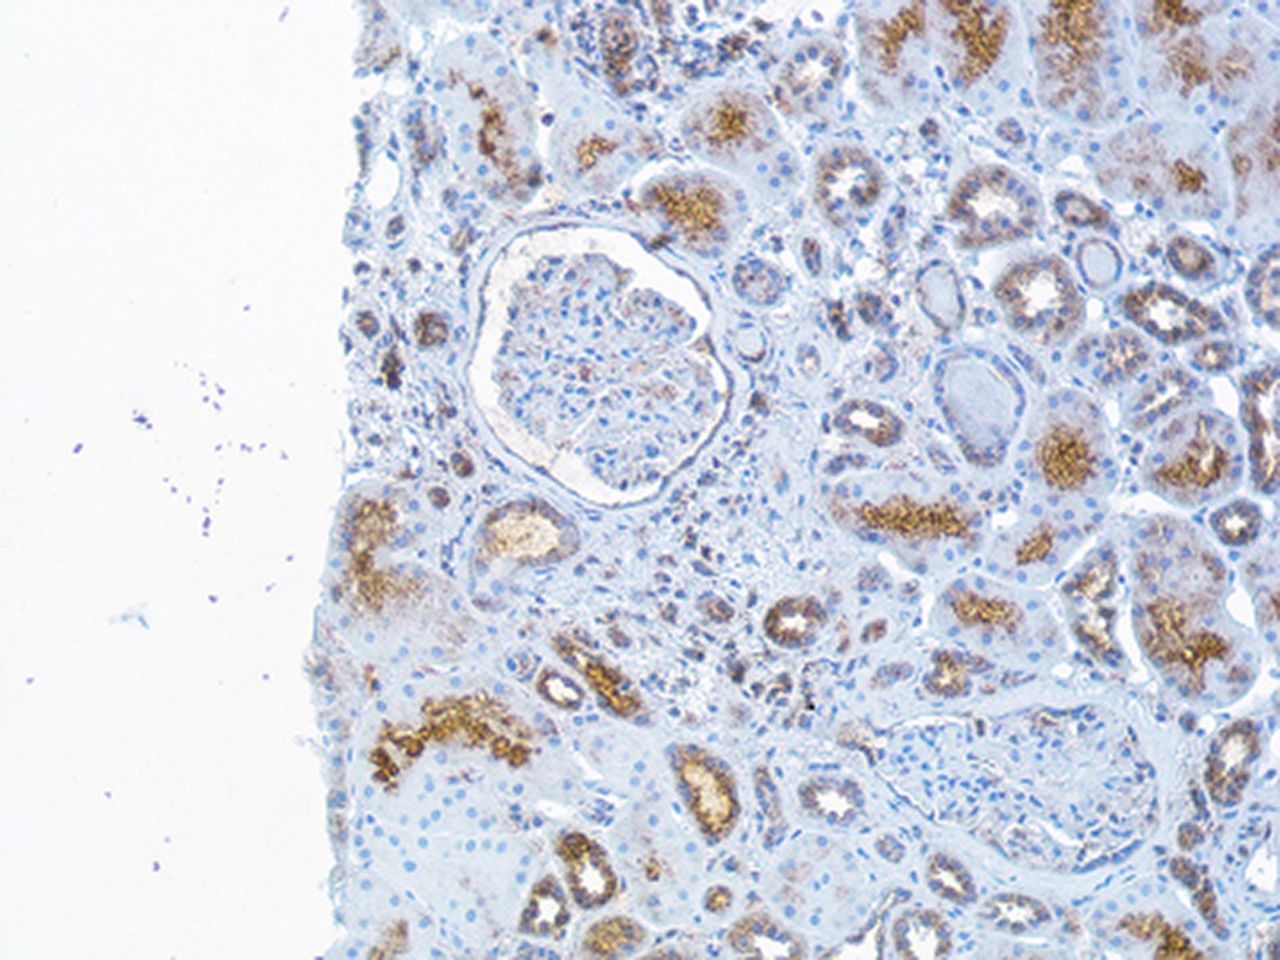
The sample size was too small to perform any statistical analysis, but the presence of IFNλ was observed in all nephritis classes (class III, IV or V) at baseline biopsies. In the renal biopsy specimens obtained at follow-up, the patients with HR (both class II) had no clear glomerular staining although the tubular staining was still present (figure 5).
Immunohistochemistry (IHC) staining of interferon (IFN)-λ in renal tissue The figure demonstrates a repeated renal biopsy obtained from a patient after immunosuppressive therapy and now lupus nephritis class II. The IHC staining for IFNλ is here sparse in tubular cells and not expressed in the glomeruli. Original magnifications: ×20.
Discussion
We report that levels of IFNλ declined after treatment in patients with LN with a favourable HR, while remained unchanged in HNRs. In renal tissue, IFNλ was expressed in crescent formations within the glomeruli, and also in inflammatory infiltrates, which indicates that IFNλ may be involved in the inflammatory process in LN.
IFNα and IFNλ were both increased in patients with LN but did not correlate with each other and levels were affected differently by an immunosuppressive treatment. Thus, our study supports a role for IFNλ and confirms previous findings regarding the importance of IFNα, in LN.
The lack of correlation between levels of IFNα and IFNλ indicates differences between these cytokines regarding both regulation and involvement in the subgroups of LN. While IFNα correlated with routine LN biomarkers, such as anti-DNA antibodies and complement levels, no such correlations were seen for IFNλ. In addition, IFNα decreased after immunosuppressive treatment while the overall levels of IFNλ remained unchanged. Interestingly, in patients with LN with HR, levels of IFNλ decreased after treatment while in patients with LN with HNR the levels were unchanged or even increased. Our results thus indicate that unaffected levels of IFNλ are associated with a more severe LN, which does not respond to currently used immunosuppressives.
Current available biomarkers for clinical assessment of renal disease activity and treatment response in lupus are insufficient and patients with LN may have inflammatory activity in the renal tissue without clinical signs of renal involvement, or despite good CR to therapy.16–19 Thus, new biomarkers to assess treatment response in LN are needed. Our findings on persisting levels of IFNλ in patients with an active nephritis after immunosuppression indicate that it may be a potential biomarker for treatment response in LN.
The observation that IFNλ was expressed in all the examined renal biopsies further supports a role for IFNλ in LN. The staining was most pronounced in glomeruli and in areas of inflammatory infiltrates but was also expressed in tubuli. Interestingly, there was no glomerular expression in the biopsies from the repeated biopsies with a favourable histological outcome after treatment (class II nephritis). The increased expression in glomerular crescents may be of special importance. The crescent formation mainly consists of proliferating epithelial cells that originate from the Bowman's capsula20 and is a feature of severe nephritis and renal vasculitis. The pronounced staining of IFNλ in the crescent formations thus supports that IFNλ receptors are mainly located on epithelial cells.5 One previous study on mice found that epithelial cells were the only cells within the kidney that responded to IFNλ.21 However, with the present staining method, we could not discriminate circulating from receptor-bound IFNλ.
It has been shown that Th17 cells are important local sources of IFNλ in psoriasis skin lesions.22 We observed renal expression of IFNλ in the CD3 positive cell infiltrates. In an earlier study, we demonstrated that IL-17 is also expressed in renal infiltrates and associated with poor LN outcome.23 Altogether, these findings may suggest that the infiltrating CD3+, possibly Th17 cells, are also the source of IFNλ in LN. Taken together, the results from the IHC-staining support a role for IFNλ in more severe LN. However, the number of tissue stainings in this study was limited and larger studies of renal biopsies from different LN classes are needed to confirm our findings.
The prognosis of LN has improved but all patients do not respond to standard immunosuppressive treatment, side effects are a concern and renal relapses are common. Thus, there is a need for new therapies in LN. Treatment strategies targeting IFNα have been the focus of many studies on drug development for lupus in recent years.24 ,25 However, initial results from a study on the monoclonal antibody sifalimumab were somewhat disappointing. Although inhibition of the type I IFN gene signature was documented, no statistically significant differences in clinical activity between the sifalimumab and placebo groups were observed.26 A more recent study reported promising data on sifalimumab, however patients with active nephritis were not included.27
Recently, it was suggested that persistent disease activity despite inhibition of IFNα could be the result of IFNλ receptor signalling, and that drugs targeting IFNλ ought to be developed and tried in SLE.6 Our data support this view indicating that IFNλ could also be of interest as a drug target in LN.
Although patients with LN had overall higher levels of IFNλ as compared with controls, only one-third of the patients were positive for of IFNλ according to the method used. The same ELISA assay was used by Zahn et al,8 who reported increased serum levels of IFNλ in patients with cutaneous SLE lesions. They observed IFNλ levels within a similar range as in the current study. Our study suggests that IFNλ may be important in a subgroup of patients with LN. Whether the finding that only a subgroup of patients had circulating levels of IFNλ is due to a genetic polymorphism, insensitive assays or other causes cannot be answered by the present study. Further studies on larger groups of patients are needed to address these issues.
The focus of this study was LN and non-renal manifestations have not been taken into consideration, but may also to some extent have influenced the serum IFN levels. Although this study is not able to define the pathogenic role of IFNλ in LN, the expression of IFNλ in the renal tissue clearly points to its involvement in LN.
In conclusion, our findings suggest that IFNλ and IFNα are involved in the pathogenesis for LN although the exact role of these cytokines remains to be elucidated. We report that IFNλ may drive LN independently of IFNα, and that persistent high levels of IFNλ were associated with poor response to the available treatment regimens. Based on our results and previous data, we suggest that IFNλ might be one of the driving molecules in severe LN. IFNλ signalling may thus also be of interest when tailoring new therapies for patients with LN.
Acknowledgments
The authors thank Birgitta Sundelin for histopathological evaluation of the renal biopsies, and Eva Jemseby and Eva Malmquist for management of the blood samples.
References
Footnotes
Contributors AZ: original idea, patient characterisation, acquisition of data, statistical analyses, interpretation of results and manuscript writing. VO: cytokine measurements, interpretation of results and manuscript writing. IP: patient characterisation and acquisition of data. ES: interpretation of results and manuscript writing. YS: Immunostaining of renal tissue and manuscript writing. IG: original idea, study design, interpretation of results and manuscript writing.
Funding Financial support was provided by grants from the King Gustaf V 80th Birthday Fund, the Karolinska Institute Foundation, the Swedish Association against Rheumatism, the Swedish Medical Research Council and the Swedish Kidney Association and through the regional agreement on medical training and clinical research between the Stockholm County Council and the Karolinska Institute.
Competing interests None.
Ethics approval KI Forskningsetikkommitte Nord, Karolinska sjukhuset; Regionala etikprövningsnämnden i Stockholm.
Provenance and peer review Not commissioned; externally peer reviewed.
Data sharing statement No additional data are available.