Article Text

Abstract
Objective To characterise patients with active SLE based on pretreatment gene expression-defined peripheral immune cell patterns and identify clusters enriched for potential responders to abatacept treatment.
Methods This post hoc analysis used baseline peripheral whole blood transcriptomic data from patients in a phase IIb trial of intravenous abatacept (~10 mg/kg/month). Cell-specific genes were used with a published deconvolution algorithm to identify immune cell proportions in patient samples, and unsupervised consensus clustering was generated. Efficacy data were re-analysed.
Results Patient data (n=144: abatacept: n=98; placebo: n=46) were grouped into four main clusters (C) by predominant characteristic cells: C1—neutrophils; C2—cytotoxic T cells, B-cell receptor-ligated B cells, monocytes, IgG memory B cells, activated T helper cells; C3—plasma cells, activated dendritic cells, activated natural killer cells, neutrophils; C4—activated dendritic cells, cytotoxic T cells. C3 had the highest baseline total British Isles Lupus Assessment Group (BILAG) scores, highest antidouble-stranded DNA autoantibody levels and shortest time to flare (TTF), plus trends in favour of response to abatacept over placebo: adjusted mean difference in BILAG score over 1 year, −4.78 (95% CI −12.49 to 2.92); median TTF, 56 vs 6 days; greater normalisation of complement component 3 and 4 levels. Differential improvements with abatacept were not seen in other clusters, except for median TTF in C1 (201 vs 109 days).
Conclusions Immune cell clustering segmented disease severity and responsiveness to abatacept. Definition of immune response cell types may inform design and interpretation of SLE trials and treatment decisions.
Trial registration number NCT00119678; results.
- autoimmune diseases
- DMARDs (biologic)
- systemic lupus erythematosus
This is an Open Access article distributed in accordance with the Creative Commons Attribution Non Commercial (CC BY-NC 4.0) license, which permits others to distribute, remix, adapt, build upon this work non-commercially, and license their derivative works on different terms, provided the original work is properly cited and the use is non-commercial. See: http://creativecommons.org/licenses/by-nc/4.0/
Statistics from Altmetric.com
Introduction
SLE is a chronic relapsing autoimmune disease affecting multiple organs, with variable manifestations and severity.1 2 Multiple components of the immune system have been implicated in the pathogenesis of SLE, including B cells, T cells, cytokines and innate immunity including the complement system.3–8 Conventional treatments for SLE can be effective in some patients, yet rarely induce prolonged remissions and are too often associated with adverse events.9 10 Targeted biological agents represent a promising therapeutic approach, but many SLE trials have failed to meet their primary endpoint.11 12 This failure may reflect intrinsic immunological heterogeneity between patients with SLE and challenges with study outcomes, which make it difficult to design, generate and interpret data in otherwise unselected populations.11 13 Consequently, there is considerable need for alternative clinical trial designs, including novel patient identification methods to improve the discriminating capabilities of interventional clinical trials of novel treatments for SLE. These insights could also translate into useful predictors of response in clinical practice.
Abatacept is a fully human fusion protein that selectively modulates the CD80/CD86:CD28 costimulatory signal required for full T-cell activation.14–16 Abatacept is indicated for use in adult patients with moderate-to-severe rheumatoid arthritis and in patients with polyarticular juvenile idiopathic arthritis aged 6 years and older. Since T-cell activation plays an important role in the pathogenesis of SLE,3 6 7 abatacept may have potential as a treatment of this disease.
A preliminary investigation of the efficacy and safety of abatacept on standard SLE medication and background oral glucocorticosteroids in patients with active SLE, whose primary manifestations were active polyarthritis, discoid skin lesions or serositis, was conducted in a 12-month, multicentre, exploratory, randomised, double-blind, placebo-controlled phase IIb trial (NCT00119678).17 The primary endpoint of the trial was not met, with no significant difference between abatacept and placebo in the rate of new British Isles Lupus Assessment Group (BILAG) A or B SLE flares after the initiation of steroid taper over 1 year. Post hoc analyses suggested that methodological problems in patient and outcome selection, specifically clinical heterogeneity, insufficient endpoint robustness and confounding concomitant therapies, may have contributed to the failure to identify significant differences between treatment groups. The proportions of abatacept-treated and placebo-treated patients (95% CI) with a BILAG A flare over 1 year after initiation of steroid taper were 40.7% (31.8 to 49.5) versus 54.4% (41.5 to 67.3). The proportions of patients (95% CI) with blinded physician-assessed flare over 1 year were 63.6% (54.9 to 72.2) with abatacept versus 82.5% (72.6 to 92.3) with placebo. Treatment differences (95% CI) between abatacept and placebo groups in BILAG A and physician-assessed flares were greatest in patients with a primary SLE disease manifestation of polyarthritis: −26.1 (−47.4 to −4.8) and –28.3 (–46.1 to –10.5), respectively. Additionally, a favourable treatment benefit for abatacept over placebo was seen in prespecified exploratory patient-reported outcomes, such as the Short Form-36 health survey, sleep problems and fatigue. Although non-conclusive, these exploratory post hoc analyses aid the understanding of disease heterogeneity in SLE.
Here we report the outcomes of additional post hoc analyses of this phase IIb study to gain insights into the results in response to abatacept treatment, by grouping patients using a molecular-based approach rather than dominant SLE clinical manifestations, to overcome the issue of clinical heterogeneity in this patient population. It was thought that such an approach could provide evidence-based insights into disease pathogenesis and response to targeted therapy. The aim of this analysis was to segment patients based on gene expression-defined immune cell patterns18 using a deconvolution algorithm19 on whole blood transcriptomic data. It was hoped this could enable the identification of patient subsets with unique clinical characteristics and, therefore, subgroups of potential responders to abatacept treatment.
Methods
Study design and patient population
The design of this phase IIb study has been described previously.17 Briefly, patients with non-life-threatening SLE and a primary manifestation of active polyarthritis, discoid skin lesions or serositis (pleuritis and/or pericarditis) were randomly assigned (2:1) to receive intravenous abatacept (~10 mg/kg/month) or placebo. Prednisone (30 mg/day or equivalent) was given for 1 month, after which the dosage was tapered. Permitted background treatments were non-steroidal anti-inflammatory drugs, azathioprine, mycophenolate mofetil, chloroquine, hydroxychloroquine or methotrexate, as well as proteinuria therapies and statins, provided that a stable dose had been maintained for at least 1 month prior to screening. The current analysis included all randomised and treated patients for whom whole blood transcriptomic data were available.
Clinical and computational analyses
Peripheral whole blood transcriptomic profiles were obtained by gene chip analysis of PAXgene mRNA (Qiagen, Hilden, Germany) from patient samples at baseline prior to the first dose of randomly assigned treatment. Briefly, whole blood was collected in PAXgene RNA tubes and total RNA was extracted using 96 Blood RNA kit (Qiagen, Valencia, California, USA); 200 ng of total RNA was then amplified and labelled with HT 3' IVT Express Kit (Affymetrix, Santa Clara, California, USA). Labelled cRNA was hybridised on Affymetrix HT_HG-U133_PLUS_PM (Affymetrix). All target labelling processes, array hybridisation, washing and scanning were performed according to the manufacturer's recommendations. Scanned images were inspected visually, and a chip quality report was generated by Expression console (Affymetrix). The image data were processed using the robust multiarray average method to determine the specific hybridising signal for each gene. All chip data were loaded into the Bristol-Myers Squibb gene expression database for further analysis.
Published cell-specific gene expressions, identified for key immune cell types by fluorescence-activated cell sorting,18 were used in conjunction with a deconvolution algorithm19 20 to estimate the proportions of different immune cells and produce an immune cell pattern for each patient. Deconvoluted patient-level cell abundance data were used in an unsupervised analysis to generate consensus clustering for the identification of patient subtypes. Assessment of stability of clusters was performed,21 and the most representative immune cell types for each cluster were identified based on significant over-representation of relative proportions of immune cell types for a given cluster compared with all other clusters, using one-way analysis of variance. Finally, clinical data from the phase IIb trial were evaluated by SLE deconvolution clusters. Clinical data included demographic data and clinical outcome measures, such as BILAG disease activity score (using a numerical scoring system where A=9, B=3, C=1, D or E=0)22, time to new adjudicated SLE flare A (severe) or B (moderate) in any organ system after the start of steroid taper, and levels of antidouble-stranded DNA (anti-dsDNA) autoantibodies and complement components 3 and 4.
Statistical analyses
Treatment difference in BILAG score was evaluated using an analysis of covariance model with treatment and randomisation strata as factors, and baseline value as a covariate. To ensure consistency with the primary manuscript, which had a 66.3% (116/175) 1-year completion rate,17 the last observation carried forward method was used for imputing missing data when analysing the BILAG score over time. Time to first occurrence of new SLE flare was analysed using Kaplan-Meier plots. All analyses were exploratory in nature; no formal calculations of statistical significance were performed.
Results
Patient population
Primary results from the phase IIb trial have been published previously.17 This post hoc analysis was focused on 144 patients who had transcriptomic data available and received abatacept (n=98) or placebo (n=46). Data from five randomised and treated patients were excluded due to site non-compliance. Baseline demographic data and clinical characteristics for the remaining 139 patients (abatacept (n=95) and placebo (n=44), table 1) were largely similar to the overall phase IIb study population of 175 patients (abatacept (n=118], placebo (n=57)). The majority of the patients were white (table 1). Other than corticosteroids, the most common concomitant medications were antimalarials, which were being taken by more than two-thirds of patients (data not shown). Estimated immune cell proportions generated from baseline whole blood gene expression data using the deconvolution approach are presented in online supplementary appendix figure S1 .
Demographic data and clinical characteristics—by cluster
SLE deconvolution cluster analyses
Consensus clustering grouped patients in this analysis into four major clusters based on immune cell abundance at baseline. The four clusters were characterised by a dominance of the following cell types: cluster 1 (C1)—neutrophils only; cluster 2 (C2)—cytotoxic T cells, B-cell receptor-ligated B cells, monocytes, immunoglobulin G memory B cells and activated T helper cells; cluster 3 (C3)—plasma cells, activated dendritic cells, activated natural killer cells and neutrophils; cluster 4 (C4)—activated dendritic cells and cytotoxic T cells (figure 1A). The distribution of patients by treatment group within these four clusters is shown in figure 1B and C. A fifth cluster was identified; however, as this included only two patients (one of whom was excluded due to site non-compliance), it was excluded from subsequent analyses.

SLE deconvolution patient clusters and representative immune cell types (A), and distribution of patients by SLE deconvolution cluster and treatment group—all randomised and treated patients* (B, C). *Data from five randomised and treated patients excluded due to site non-compliance. Ig, immunoglobulin.
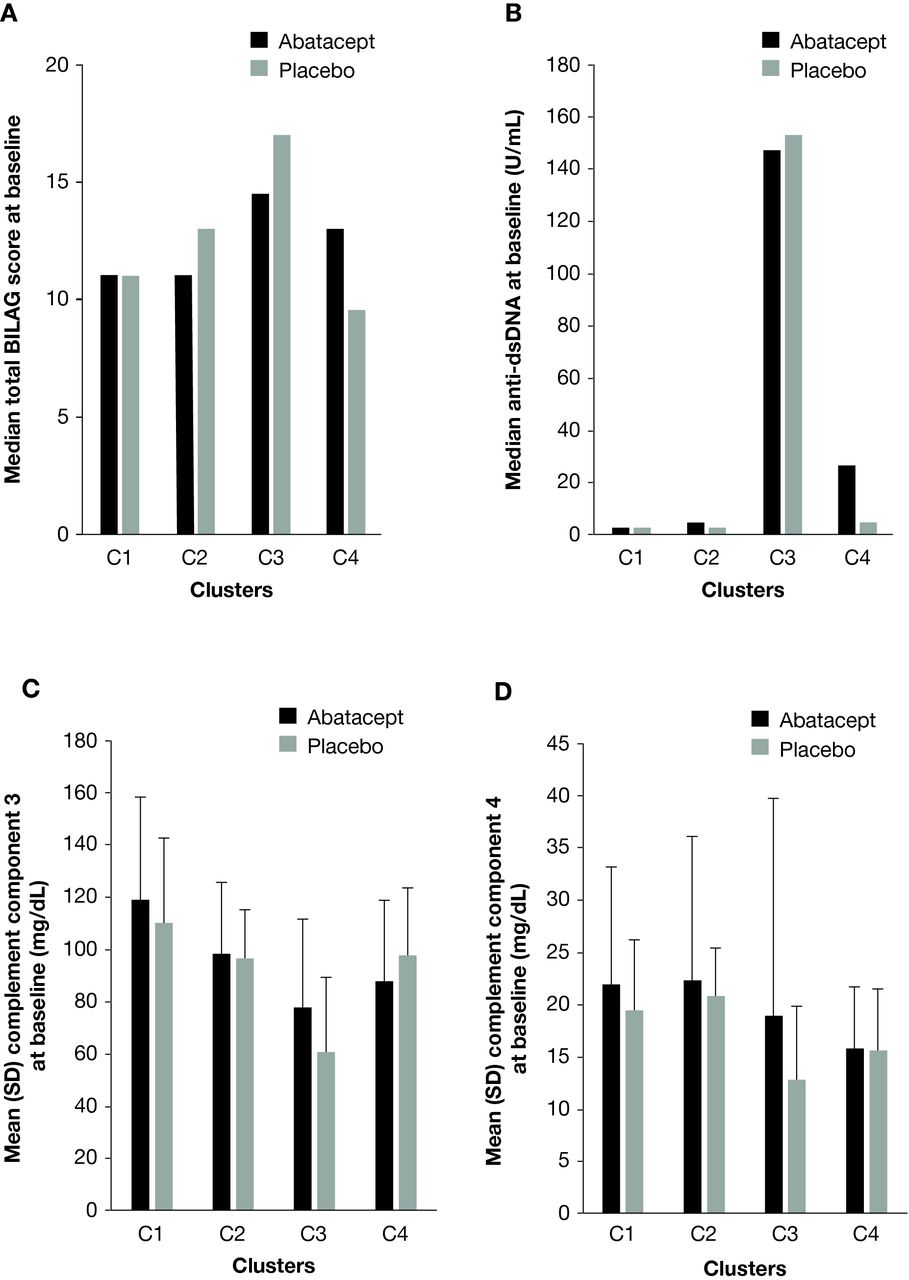
Patients in C1 were slightly older than patients in the other main clusters (table 1). The proportion of patients in C3 with a cutaneous, discoid lesion primary flare manifestation at screening was over twice as high in abatacept-treated versus placebo-treated patients (table 1). Of the four main clusters, patients in C3 (plasma cells, activated dendritic cells, activated natural killer cells and neutrophils) had the highest total BILAG disease activity scores (figure 2A) and highest levels of anti-dsDNA autoantibodies (figure 2B) at baseline. These patients also had the lowest baseline levels of complement components 3 (figure 2C) and 4 (figure 2D), though levels within this cluster were higher for abatacept-treated versus placebo-treated patients. Indeed, abatacept-treated patients in C3 had higher baseline levels of complement component 4 than abatacept-treated patients in C4.

Total BILAG score (A), anti-dsDNA autoantibodies* (B), complement component 3 (C) and complement component 4 (D) at baseline. *Positive if >5.4 U/mL. Anti-dsDNA, anti-double-stranded DNA; BILAG, British Isles Lupus Assessment Group.
Baseline SLE deconvolution clusters over time
Mean change in BILAG disease activity score from baseline over time, adjusted for baseline BILAG score, by SLE deconvolution cluster and treatment group is shown in figure 3. Abatacept-treated patients in C3 had a numerically greater mean decrease in disease activity over time versus those who received placebo. In C3, the adjusted mean (SE) change in BILAG score at year 1 was −5.64 (1.83) for the abatacept group versus −0.85 (3.25) for the placebo group; the treatment difference (95% CI) was –4.78 (–12.49 to 2.92). Abatacept-treated patients in C2 demonstrated a smaller decrease in disease activity versus placebo-treated patients. In C1 and C4, the improvement in disease activity was similar in both treatment groups (figure 3).
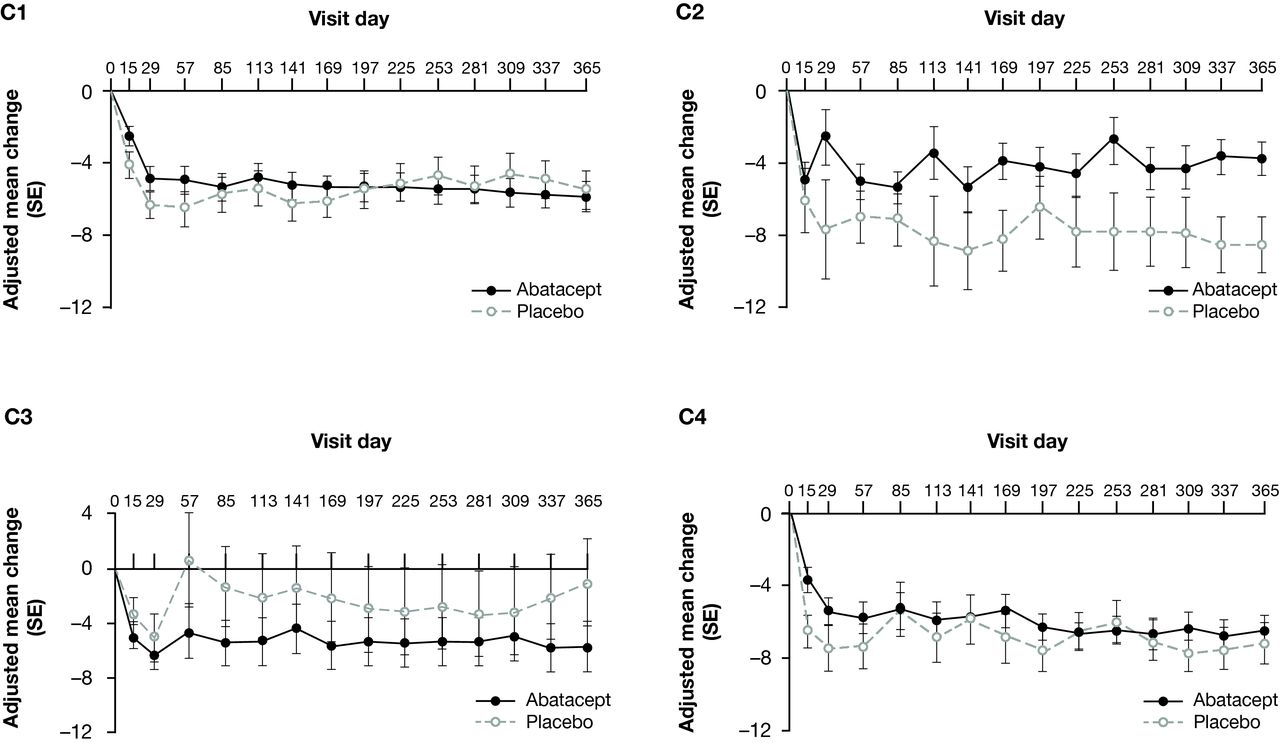
Mean change from baseline over time in BILAG score,* adjusted for baseline BILAG score, by SLE deconvolution cluster (LOCF analysis)—all randomised and treated patients.† *Using a numerical scoring system: A=9, B=3, C=1, D or E=0. †Data from five randomised and treated patients excluded due to site non-compliance. BILAG, British Isles Lupus Activity Group; LOCF, last observation carried forward.
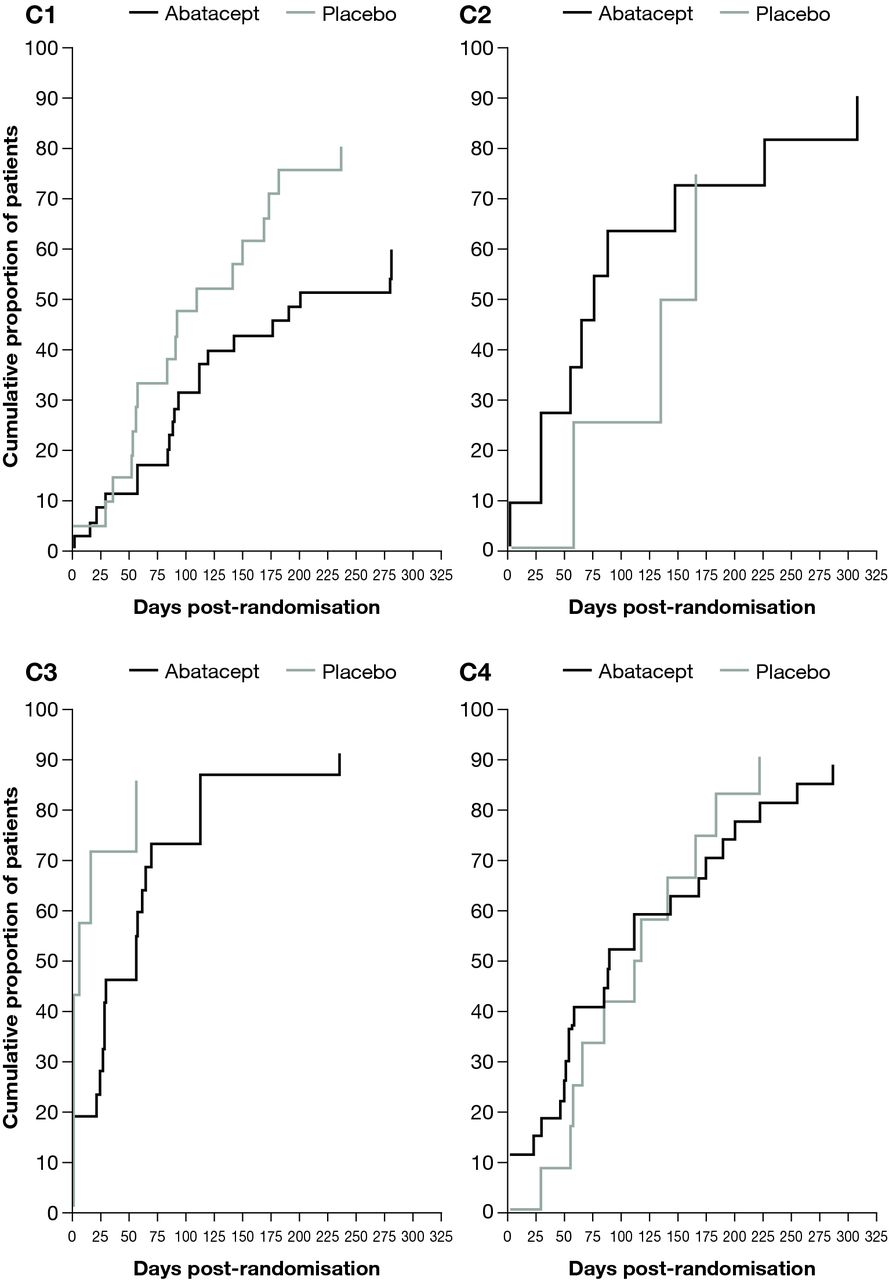
Patients in C3 had the shortest median time to first occurrence of new SLE flare as seen in Kaplan–Meier plots (figure 4). The median (95% CI) time to flare was prolonged for patients treated with abatacept versus placebo in C1 (201 (112 to –) vs 109 (56 to 173) days) and in C3 (56 (24 to 69) vs 6 (1 to 56) days; figure 4). In contrast, the median (95% CI) time to flare was shorter with abatacept versus placebo in C2 (75 (28 to 225) vs 150 (57 to –) days) and in C4 (89 (51 to 175) vs 115 (56 to 184) days).

Kaplan–Meier plot of time to first occurrence of new SLE flare in the double-blind period by SLE deconvolution cluster—all randomised and treated patients.* *Data from five randomised and treated patients excluded due to site non-compliance.
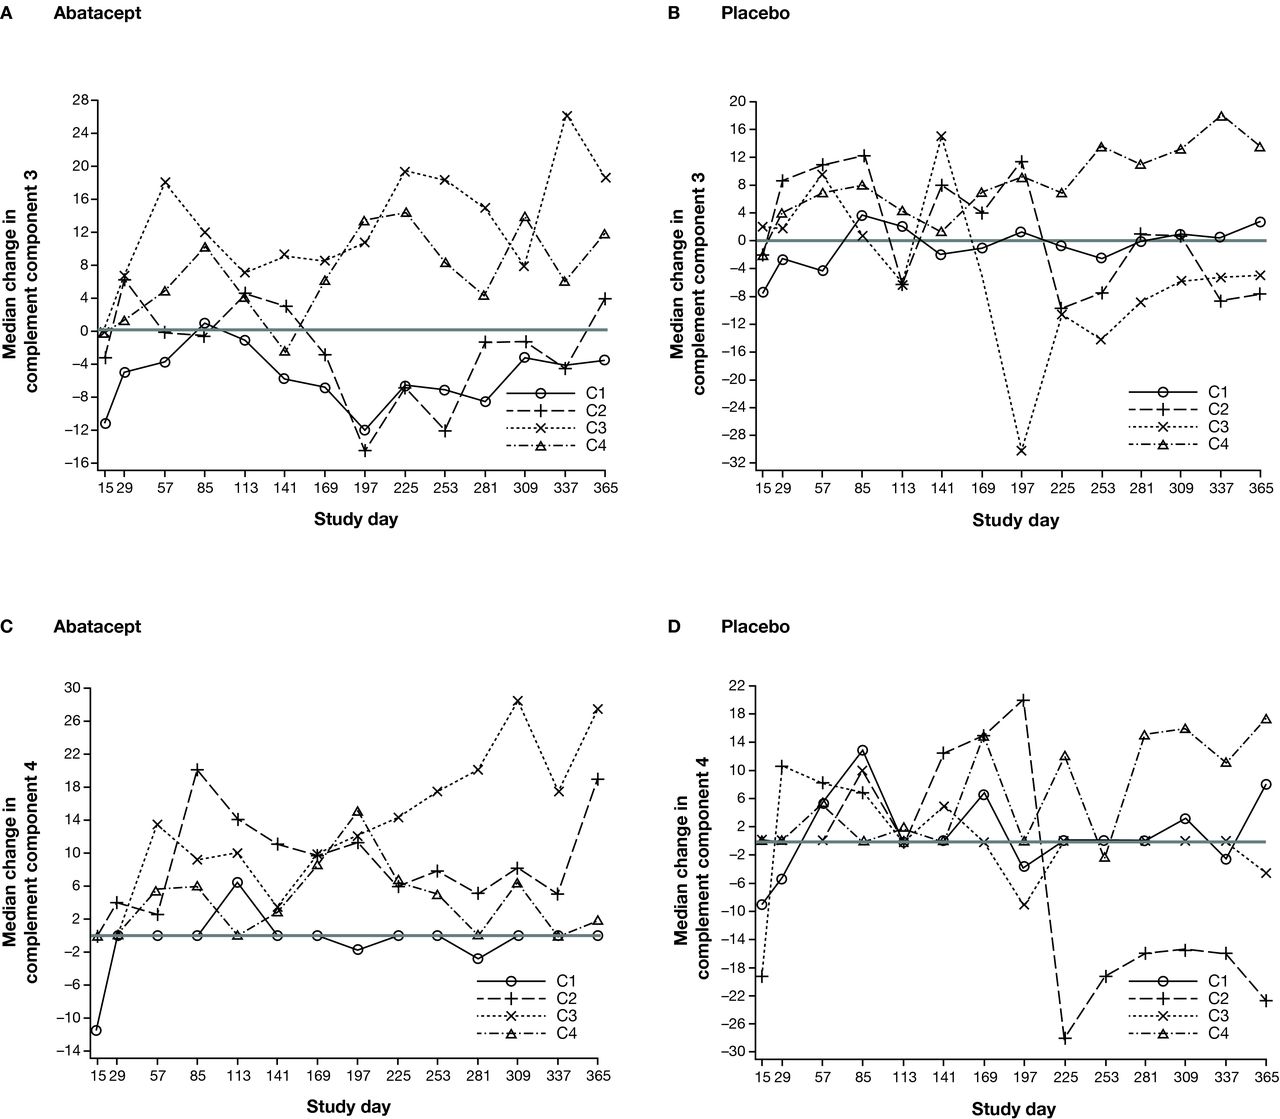
When analysing the levels of complement components 3 or 4, the greatest elevations towards normal levels over time were seen in abatacept-treated patients in C3 (figure 5A and C). Furthermore, there was a differential treatment effect in favour of abatacept compared with placebo in the improvement in both complement components for this cluster (figure 5A–D).
Median percentage change in complement components 3 and 4 over time by SLE deconvolution cluster—all randomised and treated patients.* *Data from five randomised and treated patients excluded due to site non-compliance.
Discussion
In a phase IIb trial of abatacept in patients with active SLE, this post hoc analysis of peripheral whole blood mRNA expression using a deconvolution algorithm identified four distinct immunophenotypic clusters of patients at baseline. Patients in the C3 cluster, whose immune cell pattern was characterised by high levels of plasma cells, activated dendritic cells, activated natural killer cells and neutrophils, had the highest total BILAG scores and highest levels of anti-dsDNA autoantibodies at baseline, lowest baseline levels of complement component 3 and 4, and the shortest time to flare. In the C3 cluster, benefits with abatacept treatment over placebo were observed in terms of greater improvement in BILAG score, longer time to flare and improvement in levels of complement components 3 and 4 over time. A trend in favour of abatacept over placebo in time to flare was also observed in the C1 cluster, which was characterised by high levels of neutrophils only.
This type of analysis can generate novel hypotheses to guide treatment strategies for patients with SLE. The enhanced response to abatacept seen in patients in cluster C3 is consistent with the mode of action of abatacept, which blocks CD28 costimulation via CD80/86 binding.14 16 Cluster C3 exhibited the highest level of B-cell activity, as shown by enrichment for plasma cells and elevated autoantibody titres. B-cell activation and differentiation is assisted by activated T cells, which in turn depend on CD28-mediated costimulation. In rheumatoid arthritis, patients with high autoantibody titres had the greatest clinical improvement on treatment with abatacept, a finding which appears to parallel what we found in the abatacept C3 cohort.23 Additionally, beneficial treatment effects with abatacept were seen only in clusters C3 and C1, both of which were characterised by neutrophils. A higher proportion of patients received concomitant steroid medication in C1 and C3 versus C2 and C4. In C3, the proportion of patients with concomitant steroid use was similar in both treatment groups; therefore, background steroid use may have contributed to the positive abatacept treatment effect observed in this cluster. In C1, the proportion of patients receiving concomitant steroids was greater in abatacept-treated versus placebo-treated patients. Consequently, in C1, steroid use may have enhanced the observed abatacept treatment effect, or merely indicated a patient population with more active disease.
It is not fully understood why, in cluster C2 (which contains activated B cells and T helper cells), abatacept treatment appears less beneficial than placebo in terms of change in BILAG score and time to new flare. However, it should be noted that the contrasting between-treatment effects seen in C2 and C3 appear more due to variation in placebo effect in the two patient clusters than in abatacept effect. Another possible reason for the observed lack of positive treatment effect in the C2 and C4 clusters is the high level of CD8-positive cytotoxic T cells, which generally express less CD28 than CD4-positive T helper cells.24 Indeed, it has been reported that, after 6 months of abatacept treatment, patients with rheumatoid arthritis (RA) who had low baseline levels of CD28-negative CD8 T cells (<87 cells/µL) had a more than fourfold higher probability of achieving remission (Disease Activity Score 28 (C reactive protein)<2.6 for at least two consecutive visits) versus patients with higher levels of these cells.25 Therefore, the higher levels of CD8-positive cytotoxic T cells in clusters C2 and C4 may indicate lower overall CD28 T-cell expression and thus lower responsiveness to abatacept treatment.
SLE is a clinically complex disease, with a myriad of clinical manifestations and associated immunological markers.11 For example, all patients with SLE produce autoantibodies yet the type produced differs across the majority of patients. This holds true in the case of autoantibodies that are highly specific to SLE, such as anti-Smith/ribonucleoprotein antibodies.26 27 Additionally, the level of complement components 3 and 4 may or may not decrease in association with disease flares; furthermore, some patients display genetically determined low levels of complement components 3 and 4.28–30 All of this suggests that the underlying pathogenic process, and therefore response to targeted therapies, could vary for different subsets of patients. It could also suggest, as recently observed,31 that baseline characteristics identified as potential biomarkers may drive differential response to therapy. Our findings, which contribute to the evolving understanding of SLE pathogenic processes, may lead to more limited expectations of improvement from novel therapies. The deconvolution strategy reported here explored whether analysis of peripheral whole blood transcriptomic data is able to produce a cohesive and informative description of the disease state of individual patients with active SLE. This type of analysis may provide important clinical implications, despite the limitations imposed by a heterogeneous disease.
The approach described here is of considerable interest to many who are investigating potential biomarkers to identify subtypes of patients with SLE and thereby predict which patients may gain the greatest benefit from treatment with investigational agents.32 33 We aimed to establish a predictive biomarker of response, rather than a diagnostic biomarker of disease activity.32 33 Our findings suggest that this aim may have been achieved and could have clinical application in the prediction of response/non-response to abatacept or other treatment. A recent prospective clinical and transcriptional immunophenotyping study in SLE identified seven patient groups using a similar approach to the one described here.34 In that study, each patient group displayed a specific combination of five immune signatures correlating with the SLE disease activity index: erythropoiesis, interferon response, myeloid lineage/neutrophils, plasmablasts and lymphoid lineage. However, the study analysed data from paediatric patients, whereas our analyses evaluated data from adult patients with SLE, which could account for the differences seen between identified patient subsets. Genome-wide association studies are providing insights into more fixed SLE subtypes that may also have implications for the development of treatment strategies.35 36
Further analyses on larger, prospective patient cohorts using prespecified outcomes should be conducted to assess and validate the robustness of these findings, which are descriptive and hypothesis-generating in nature. For reference, these data could provide an SD of BILAG score change from baseline of approximately 8.5. To detect a 4.78 reduction in total BILAG score at day 365 with 80% power, the study would need a total of approximately 100 patients with C3 transcriptomic profile data with a 1:1 treatment assignment ratio. Limitations of this analysis must also be considered. The size of the clusters prevents any meaningful evaluation of between-cluster effect of background medication or subgroup analyses. Furthermore, due to the complex nature of immune system interactions, and potential cross-talk between background immune-modulating agents used in the trial, this analysis cannot distinguish between direct and indirect effects of therapy. Finally, this methodology may not be translatable nor practical in a clinical setting, so its utility may be limited to discovery with a more practical biomarker derived for routine use.
In summary, this whole blood deconvolution analysis of data from a phase IIb abatacept trial in patients with SLE suggested four distinct immunophenotypic clusters at baseline, which appeared to demarcate distinct clinical characteristics and potential response to abatacept therapy. Whole blood deconvolution may provide insights into specific immune cell-driven disease mechanisms, thereby informing treatment selection for patients and the interpretation of SLE trial data for abatacept and other treatments.
References
Footnotes
Contributors All authors meet the authorship requirements and have seen and approved the final version of the manuscript for submission.
Funding This study was sponsored by Bristol-Myers Squibb. Professional medical writing and editorial assistance was provided by Carolyn Tubby, PhD, at Caudex and was funded by Bristol-Myers Squibb.
Competing interests SB, SEC, OJ, SK, MAM and RMT are employees and shareholders of Bristol-Myers Squibb. JY is an employee of Bristol-Myers Squibb. RW has received grant/research support from Roche and UCB, is a consultant for Bristol-Myers Squibb, Galapagos and Janssen, and has participated in a speakers’ bureau for Bristol-Myers Squibb. PN has no conflicts of interest. JTM has received consulting fees from Abbott, Amgen, Astellas, Bristol-Myers Squibb, Cephalon, Eisai, EMD Serono, Genentech/Roche, Human Genome Sciences/GlaxoSmithKline, Lilly, MedImmune/AstraZeneca, Ono, Pfizer, Questcor, UCB, and research grants from Genentech/Roche, Pfizer and UCB.
Provenance and peer review Not commissioned; externally peer reviewed.