Article Text

Abstract
Objective We investigated the mechanistic and pharmacological properties of anifrolumab, a fully human, effector-null, anti-type I interferon (IFN) alpha receptor 1 (IFNAR1) monoclonal antibody in development for SLE.
Methods IFNAR1 surface expression and internalisation on human monocytes before and after exposure to anifrolumab were assessed using confocal microscopy and flow cytometry. The effects of anifrolumab on type I IFN pathway activation were assessed using signal transducer and activator of transcription 1 (STAT1) phosphorylation, IFN-stimulated response element–luciferase reporter cell assays and type I IFN gene signature induction. The ability of anifrolumab to inhibit plasmacytoid dendritic cell (pDC) function and plasma cell differentiation was assessed by flow cytometry and ELISA. Effector-null properties of anifrolumab were assessed in antibody-dependent cell-mediated cytotoxicity (ADCC) and complement-dependent cytotoxicity (CDC) assays with B cells.
Results Anifrolumab reduced cell surface IFNAR1 by eliciting IFNAR1 internalisation. Anifrolumab blocked type I IFN-dependent STAT1 phosphorylation and IFN-dependent signalling induced by recombinant and pDC-derived type I IFNs and serum of patients with SLE . Anifrolumab suppressed type I IFN production by blocking the type I IFN autoamplification loop and inhibited proinflammatory cytokine induction and the upregulation of costimulatory molecules on stimulated pDCs. Blockade of IFNAR1 suppressed plasma cell differentiation in pDC/B cell co-cultures. Anifrolumab did not exhibit CDC or ADCC activity.
Conclusions Anifrolumab potently inhibits type I IFN-dependent signalling, including the type I IFN autoamplification loop, and is a promising therapeutic for patients with SLE and other diseases that exhibit chronic dysfunctional type I IFN signalling.
- cytokines
- dmards (biologic)
- interferon
- systemic lupus erythematosus
- treatment
This is an Open Access article distributed in accordance with the Creative Commons Attribution Non Commercial (CC BY-NC 4.0) license, which permits others to distribute, remix, adapt, build upon this work non-commercially, and license their derivative works on different terms, provided the original work is properly cited and the use is non-commercial. See: http://creativecommons.org/licenses/by-nc/4.0/
Statistics from Altmetric.com
Introduction
Systemic lupus erythematosus (SLE) is a chronic, multisystem autoimmune disease characterised by reoccurring flares and remissions.1 Clinical manifestations of SLE range in severity and presentation and include life-threatening renal and neuropsychiatric morbidity as well as pathogenic secondary complications.2 Numerous environmental and genetic factors trigger SLE in predisposed individuals, contributing to the complex epidemiology of affected populations.3 A previous review examined the immunopathogenesis of SLE in detail.4 An important serological hallmark of the disease is the presence of autoantibodies that bind to circulating nuclear antigens. A strong association also exists between the presence of anti-double-stranded DNA (anti-dsDNA), anti-Ro and anti-ribonucleoprotein, and type I interferon (IFN) activity in autoimmune patients.5 6 The primary source of type I IFNs appears to be plasmacytoid dendritic cells (pDCs), which uptake immune complexes containing DNA/RNA through Fcγ receptor (FcγR) IIA (CD32A). DNA/RNA uptake, in turn, activates intracellular nucleic acid-sensing toll-like receptors (TLRs), which trigger the induction of type I IFNs.7 8
In murine models of lupus and scleroderma, targeted deletion or transcriptional impairment of pDCs reduces the autoimmune pathology observed in vivo. Additionally, depletion of pDCs in a pre-established model of scleroderma attenuates skin fibrosis, emphasising the role for pDCs in both the establishment and the maintenance of autoimmune disease.9–11
A growing body of evidence supports the roles of type I IFNs in the immunopathogenesis of SLE and other interferonopathies.12–14 Multiple genetic polymorphisms increase type I IFN signalling and are associated with increased susceptibility to SLE.15 Increased type I IFN expression and type I IFN-induced cell signalling correlate with SLE severity,16 17 and therapeutic use of type I IFNs for patients with viral hepatitis can induce a lupus-like syndrome.18
The family of type I IFNs includes 13 IFN-α subtypes, IFN-β, IFN-δ, IFN-ε, IFN-κ and IFN-ω. Type I IFN and the IFN alpha receptors 1 (IFNAR1) and 2 (IFNAR2) form a functional IFNAR complex, leading to tyrosine phosphorylation of signal transducer and activator of transcription 1 (STAT1) and 2 (STAT2).19 20 Phosphorylated STAT1 and STAT2 translocate with IFN regulatory factor 9 (IRF9) to the nucleus and drive IFN-stimulated response element (ISRE) activation. ISRE promotes transcription of multiple IFN-stimulated genes, which leads to the production of hundreds of proinflammatory and immunomodulatory proteins involved in the host innate immune response to viral infection.21 22 IFNAR activation also mediates cell-intrinsic induction of ISRE to produce more type I IFN and thereby autoamplify the IFN response.23–25 Thus, in autoimmune diseases, immune cells can rapidly produce large amounts of IFN at localised sites that ultimately can lead to tissue damage and disease exacerbation.26 Medicines targeting the type I IFN pathway may provide a therapeutic benefit in SLE and other diseases with a prominent type I IFN gene signature.
Anifrolumab (also known as MEDI546) is a fully human, effector-null, Ig G1 κ monoclonal antibody that binds to IFNAR1 and blocks type I IFN signalling. Anifrolumab is currently in clinical development for treatment of SLE and lupus nephritis. Crystal structure and docking analyses confirm that anifrolumab sterically inhibits type I IFN binding to IFNAR1.27 Anifrolumab was engineered with a triple mutation L234F/L235E/P331S in the heavy chain to reduce engagement with the cell surface receptor FcγR and potential Fc-mediated effector functions (ie, effector null), such as antibody-dependent cell-mediated cytotoxicity (ADCC) and complement-dependent cytotoxicity (CDC).28
In this study, we profiled the mechanistic and pharmacological characteristics of anifrolumab. To this end, we assessed the ability of anifrolumab to elicit IFNAR1 internalisation and block type I IFN-induced STAT1 phosphorylation and ISRE activity. We also examined the impact of anifrolumab on the type I IFN autoamplification loop by assessing IFN-α production and the activation and function of stimulated pDCs. Finally, we evaluated the status of anifrolumab as an effector-null antibody in CDC and ADCC assays.
Methods
Additional details are provided in the online supplementary appendix.
Supplementary file 1
IFNAR1 internalisation and cell surface expression
Fresh human monocytes were isolated from healthy donors by positive selection (Miltenyi Biotec, Bergisch Gladbach, Germany). Monocytes were Fc blocked for 15 min and then washed once prior to staining. For confocal imaging, we stained monocytes for 30 min at 4°C with 5 µg/mL of fluorophore-labelled anti-IFNAR1 antibodies, A488-labelled anifrolumab and A594-labelled H3K1 (molecule derived from patent sequence of Medarex/Bristol-Myers Squibb, New York, New York, USA), along with an allophycocyanin-conjugated antibody against CD11b (ICRF44, BioLegend, San Diego, California, USA). Cells were washed twice and then either imaged immediately or incubated at 37°C in culture media (X-Vivo; Lonza, Basel, Switzerland) with 5% carbon dioxide (CO2) for 30–60 min to examine IFNAR1 internalisation. H3K1 binds to IFNAR1 at an epitope that is different from the epitope for anifrolumab. To determine surface expression of IFNAR1 after internalisation, cells were incubated with 5 µg/mL of A594-labelled H3K1 antibody for 30 min at 4°C, washed twice and then imaged immediately using a Leica SP5 confocal microscope (Leica Microsystems Inc., Buffalo Grove, Illinois, USA). Surface IFNAR1 expression was quantified at 30 min after anifrolumab treatment using Imaris (Bitplane, Belfast, UK) image analysis software. For image quantification of IFNAR1 internalisation, a membrane mask was created using CD11b-APC fluorescence to define individual cell membranes, and the amount of IFNAR1-A488-labelled or CD11b-APC‒labelled spots detected at the cell membrane, and inside individual cells, was assessed using Imaris.
To assess surface IFNAR1 expression after treatment with anifrolumab by flow cytometry, monocytes were incubated without (untreated control) and with 20 µg/mL of unlabelled anifrolumab at 37°C for 0.5, 1, 4 or 24 hours. Cells were then chilled on ice to stop internalisation and acid washed (500 mM of glycine HCl, pH 2.7) to remove residual surface-bound anifrolumab. To detect surface IFNAR1, cells were Fc blocked and then stained with 1 µg/mL of A647-labelled anifrolumab at 4°C for 60 min. For the background control, identical aliquots were preincubated with excess anifrolumab (100 µg/mL) prior to staining with 1 µg/mL of A647-labelled anifrolumab. Cells were washed and acquired using a BD FACSCanto II (BD Biosciences, San Jose, California USA). Fifteen minutes before acquisition, 7-aminoactinomycin D was added for dead cell discrimination. A647 fluorescence intensities were determined using FlowJo software version 9.9.4. Cell surface expression of IFNAR1 after anifrolumab exposure was quantified as a percentage of the untreated control after background control subtraction. Prism 6 software (GraphPad, La Jolla, California, USA) was used for graphical representation.
Type I IFN-induced STAT1 phosphorylation
Peripheral blood mononuclear cells (PBMCs) from healthy human donors were purified using lymphocyte separation medium (MP Biomedical, Santa Ana, California, USA). pDCs were purified from PBMCs using positive selection (Miltenyi Biotec). pDCs were treated with 0.5 µM of the TLR9 agonist CpG-A oligonucleotide (ODN) 2216 (InvivoGen, San Diego, California, USA). We quantified total IFN-α concentrations by ELISA (PBL Assay Science, Piscataway Township, New Jersey, USA) and extrapolated leucocyte IFN activity from a linear correlation of the luciferase activity of a recombinant leucocyte IFN reference standard.
PBMCs were incubated with 10 µg/mL (67.7 nM) of anifrolumab or isotype control antibodies at 37°C and 5% CO2 for 20 min. Cells were then stimulated with human pDC-derived IFN at a concentration of 1000 IU/mL or different concentrations of recombinant human IFN-α2 for 5–20 min. Cells were lysed and denatured, and lysates electrophoresed on NuPage 10% bis–tris polyacrylamide gels (Invitrogen, Carlsbad, California, USA). Proteins were transferred to a nitrocellulose membrane and blocked overnight at 4°C. Gels were incubated overnight with anti-human STAT1 pTY701 or β-actin antibodies (Cell Signaling Technology, Danvers, Massachusetts, USA), and then treated with horseradish peroxidase-conjugated anti-rabbit secondary antibody (Cell Signaling Technology), followed by Pico SuperSignal West reagent (Pierce, Waltham, Massachusetts, USA). A Kodak X-Omat 1000A Processor (Kodak, Rochester, New York, USA) was used to visualise chemiluminescent bands.
Type I IFN-induced ISRE signalling
293H cells (ATCC, Manassas, Virginia, USA) were stably transfected with pHTS-ISRE luciferase reporter gene plasmid (Biomyx, San Diego, California, USA) using LipofectAMINE 2000 (Invitrogen). The cells were maintained in Dulbecco’s modified eagle medium and 10% fetal bovine serum (FBS; Life Technologies, Carlsbad, California, USA) containing Geneticin (Invitrogen), cultured (n=40 000) in 100 µL of medium per well in a 96-well plate and incubated with serially diluted anifrolumab or IgG1 isotype control antibodies in the presence of 100 IU/mL of recombinant type I IFNs (PBL Assay Science). After incubation, we lysed the cells and assessed luciferase activity using the ISRE-luciferase assay system (Promega, Madison, Wisconsin, USA). Non-linear regression analyses, calculation of half-maximal inhibitory concentrations (IC50) and Welch’s paired t-tests were performed using Prism 6 software.
Type I IFN-induced ISRE signalling was also assessed by incubating cells with serially diluted antibodies and increasing concentrations of IFN-α2 or unpurified supernatants derived from pDCs treated with TLR9 agonist or DNA/IgG–immune complexes (DNA-IC). DNA-IC was prepared by mixing 10 µg/mL of anti-DNA clone E11 antibody with 1 µg/mL of DNA containing 50 copies of a cytosine-guanine immunostimulatory sequence (CG50) in RPMI 1640/GlutaMAX supplement (Life Technologies) with 10% FBS and 1% penicillin/streptomycin as previously described.29 The specific activity of IFN-α protein was approximately 7.3×10⁸ U/mg (approximate activities: 100 000 U=137 ng). IFN-α concentration was approximately 37 ng/mL in CpG-A-stimulated pDC medium and 1.2 ng/mL in DNA-IC-stimulated pDC medium.
Type I IFN activity was examined in the sera of patients with SLE using the PIL-5 monocytic cell line transfected with the ISRE-luciferase reporter gene. We acquired human serum samples (n=20) from patients with SLE from BioreclamationIVT (Hicksville, New York, USA) or from William Stohl (University of Southern California, Los Angeles, California, USA) with institutional review board approval and informed consent. Leucocyte IFN activity of the serum samples was determined as described previously. Antibody potency was examined by incubating PIL-5 ISRE-luciferase cells overnight at serial dilutions of anifrolumab or isotype antibodies in the presence of 50% serum from IFN-positive serum samples from patients with SLE.
Cytokine production, pDC activation and type I IFN gene signature
PBMCs and pDCs were preincubated with anifrolumab or isotype control antibody at various concentrations for 1 hour, and then stimulated for 18 hours with CpG-A ODN 2216 or DNA-IC as described above. Supernatants were collected for cytokine measurements, and cells were collected either for flow cytometry or to analyse the type I IFN gene signature.
IFN-α in culture supernatants was measured by ELISA; interleukin (IL)-6, IL-8 and tumor necrosis factor (TNF)-α in pDC culture supernatants were measured using a multiplex assay (Meso Scale Discovery, Rockville, Maryland, USA). For assessment of IFN-inducible gene signatures, RNA from PBMCs was isolated using RNeasy Plus Purification Kit (Qiagen, Hilden, Germany). We measured the 21-gene IFN gene signature as previously described.30
Cells from pDC culture assays were resuspended in buffer (1% bovine serum albumin (BSA) and 0.1% sodium azide in - phosphate buffered saline (PBS)) for analysis of surface marker expression. Fc receptors were blocked and surface antigens were stained with BioLegend antibodies against CD80 (clone 2D10), CD83 (clone HB15E) and CD123 (clone 6H) and assessed by flow cytometry as described previously.
Plasma cell differentiation assays
PBMCs and pDCs were isolated using the methods described above. B cells were negatively selected from PBMCs of the same donor using a kit from STEMCELL Technologies according to the manufacturer’s instructions. Cells were plated in 96-well round-bottom plates. Each well contained 1×10⁵ B cells (50 µL), 1×10⁴ pDCs (50 µL), 1.5 nM of mega CD40L (to prime pDC and B cell activity; Enzo Life Sciences, Farmingdale, New York, USA), 10 ng/mL of IL-3 (for pDC survival; R&D Systems, Minneapolis, Minnesota, USA), 33 ng/mL of IL-21 (MedImmune) and 0.5 µM of CpG-A ODN 2216, with or without anifrolumab or control antibody. The number of CD19+CD27highCD38high plasma cells was determined by flow cytometry at Day 6 or 7. Cells were acquired on the flow cytometer for a fixed time and rate; therefore, the number of events displayed in fluorescence-activated cell sorting plots is reflective of the relative cell number.
Results
Anifrolumab induces sustained reduction of surface IFNAR1 and abrogates STAT1 phosphorylation
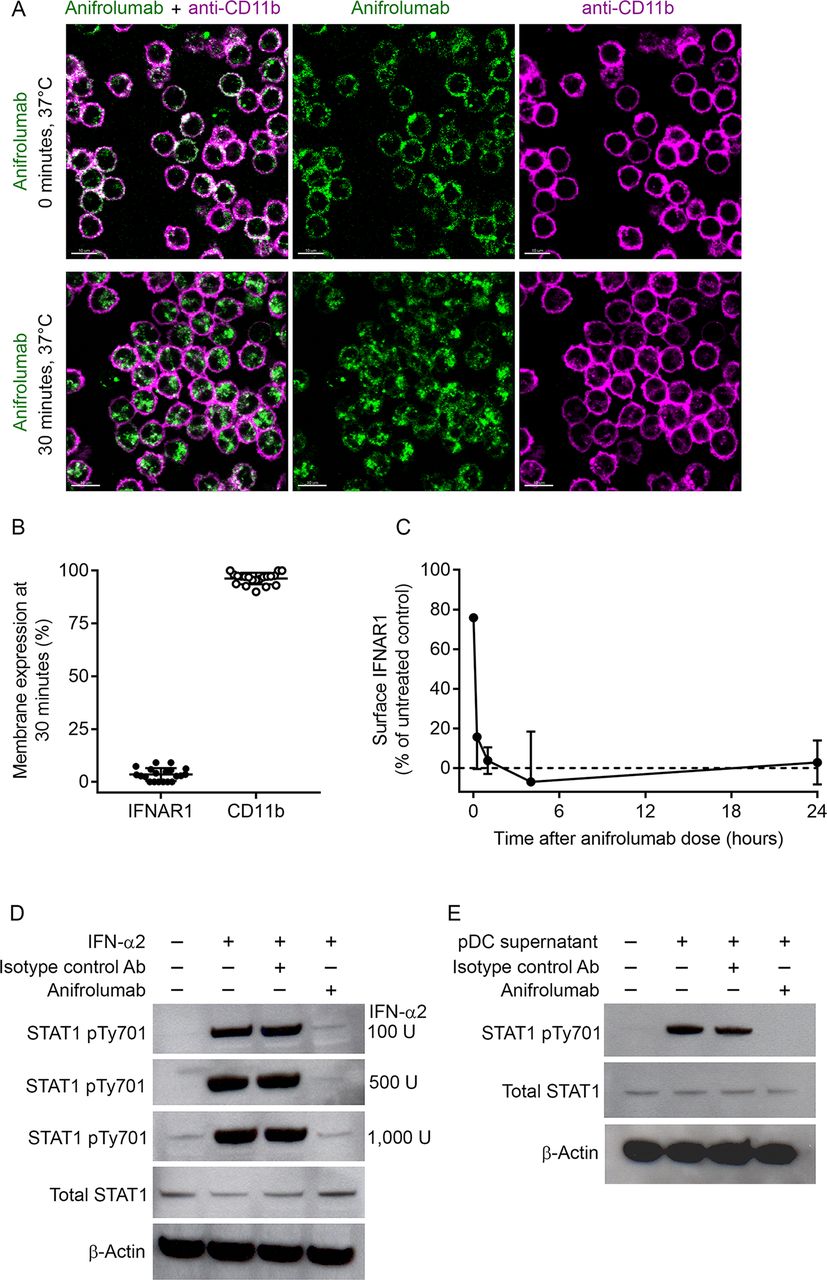
Based on the results of confocal microscopy, anifrolumab rapidly (within 30 min) internalised IFNAR1 (95%) from the surface of monocytes, whereas surface CD11b expression remained unchanged (figure 1A and B). We verified IFNAR1 internalisation with a non-competing anti-IFNAR1 antibody, anti-H3K1 (online supplementary figure 1). IFNAR1 surface expression was approximately 3% of that detected for the untreated control at 24 hours after the addition of anifrolumab (figure 1C). IFN-α2 and pDC supernatants induced signalling downstream of IFNAR1 activation, as evidenced by increased STAT1 phosphorylation relative to negative controls (figure 1D and E). IFN-α2-dependent and pDC supernatant-dependent STAT1 phosphorylation did not occur in the presence of anifrolumab (figure 1D and E). These data demonstrate that anifrolumab drives internalisation of IFNAR1 and inhibits IFN-mediated signalling.

Anifrolumab induces sustained interferon alpha receptor 1 (IFNAR1) internalisation and inhibits downstream signal transducer and activator of transcription 1 (STAT1) phosphorylation. (A) Membrane binding of A488-labelled anifrolumab to IFNAR1, and the APC-labelled membrane marker CD11b antibody, on primary human monocytes at 0 and 30 min after placing cells under internalisation conditions of 37°C and 5% carbon dioxide (CO2). (B) Membrane expression of IFNAR1 and CD11b on the surface of monocytes after 30 min incubation at 37°C quantified by confocal microscopy. (C) Membrane expression of IFNAR1 on monocytes after 0, 0.5, 1, 4 and 24 hours of treatment with anifrolumab under internalisation conditions quantified by flow cytometry. (D) IFN-α2-induced STAT1 phosphorylation in peripheral blood mononuclear cells (PBMCs) with and without incubation with anifrolumab or an isotype control antibody quantified. (E) Plasmacytoid dendritic cell (pDC)-derived type I IFN-induced STAT1 phosphorylation in PBMCs with and without incubation with anifrolumab or an isotype control antibody. Values are means and SDs from experiments completed with four individual donors of monocytes.
Anifrolumab inhibits type I IFN-induced ISRE signalling
Recombinant and pDC-derived type I IFN-induced signalling can be measured using HEK293-ISRE luciferase reporter activity (online supplementary figure 2). Anifrolumab potently inhibited ISRE reporter activity induced by 100 IU/mL of 14 recombinant type I IFNs, with IC50s ranging from 0.004 to 0.3 nM for the IFN-α subtypes, and 0.03 nM and 0.07 nM for IFN-β and IFN-ω, respectively (table 1). Diluted culture supernatants from pDCs stimulated with TLR9 ligand ODN 2216 (CpG-A) or DNA-IC induced a dose-dependent increase in ISRE activity (online supplementary figure 2B,C). Anifrolumab completely and potently inhibited ISRE activity induced by up to 100 000 IU IFN-α2-stimulated, CpG-A-stimulated or DNA-IC-stimulated pDC culture supernatants (figure 2A–2C). IC50 values for anifrolumab inhibition of IFN-induced or pDC medium-induced ISRE reporter activity were in the low to sub-nM range (online supplementary Table 1). Anifrolumab inhibited ISRE-luciferase activity induced by serum of a patient with SLE in a dose-dependent manner (figure 2D). At 10 µg/mL, anifrolumab completely neutralised IFN-induced luciferase activity from sera of 20 type I IFN-positive patients with SLE by more than 96% (figure 2E). These data demonstrate that anifrolumab potently inhibits a broad range of type I IFNs.

Anifrolumab inhibits type I interferon (IFN)-induced IFN-stimulated response element (ISRE) signalling. Type I IFN-induced luciferase activity in HEK293-ISRE reporter cells elicited by (A) recombinant IFN-α2 protein (100 (triangles), 1000 (squares), 10 000 (circles) or 100 000 (diamonds) U/mL); (B and C) CpG-A-stimulated and DNA/IgG–immune complexes (DNA-IC)-stimulated pDC supernatant (diluted 1:10 (triangles), 1:100 (squares) or 1:1000 (circles)), with preincubation with anifrolumab (black symbols) or isotype control antibody (white open circles). Type I IFN-induced luciferase activity in pIL5-ISRE reporter cells elicited by sera from patients with SLE with and without preincubation with anifrolumab or isotype control antibody; (D) representative assay with a single serum sample and anifrolumab IC50 of 0.05 nM and (E) relative IFN activity of 20 serum samples. Mean IC50 for sera from three patients with SLE was 0.32±0.50 nM. Values are means and SDs.
Anifrolumab potently inhibits ISRE signalling induced by 100 IU/mL of human recombinant type I IFNs in a luciferase reporter cell assay
Anifrolumab abrogates type I IFN production from primary human PBMCs and pDCs
IFNAR activation mediates cell-intrinsic induction of type I IFN, allowing pDCs to amplify their IFN production.23–25 PBMCs and enriched pDCs from healthy donors were preincubated with anifrolumab or control antibody and stimulated overnight with CpG-A or DNA-IC, and IFN-α production was quantified. One million PBMCs or 10 000 pDCs (approximately the amount found in 1 million PBMCs) produce comparable amounts of IFN-α, confirming that, under these conditions, pDCs are the major producers of IFN-α in PBMCs (figure 3A and B). Anifrolumab specifically inhibited CpG-A-induced or DNA-IC-induced IFN-α production by human PBMCs in a dose-dependent manner (figure 3A, left and centre). At a concentration of 10 µg/mL (67.7 nM), anifrolumab specifically inhibited approximately 82–87% of IFN-α produced by primary human PBMCs (figure 3A, right). Similarly, anifrolumab dose-dependently inhibited IFN-α production from pDCs in response to CpG-A or DNA-IC stimulation, inhibiting 87–95% of IFN-α production at 10 µg/mL (67.7 nM) (figure 3B).
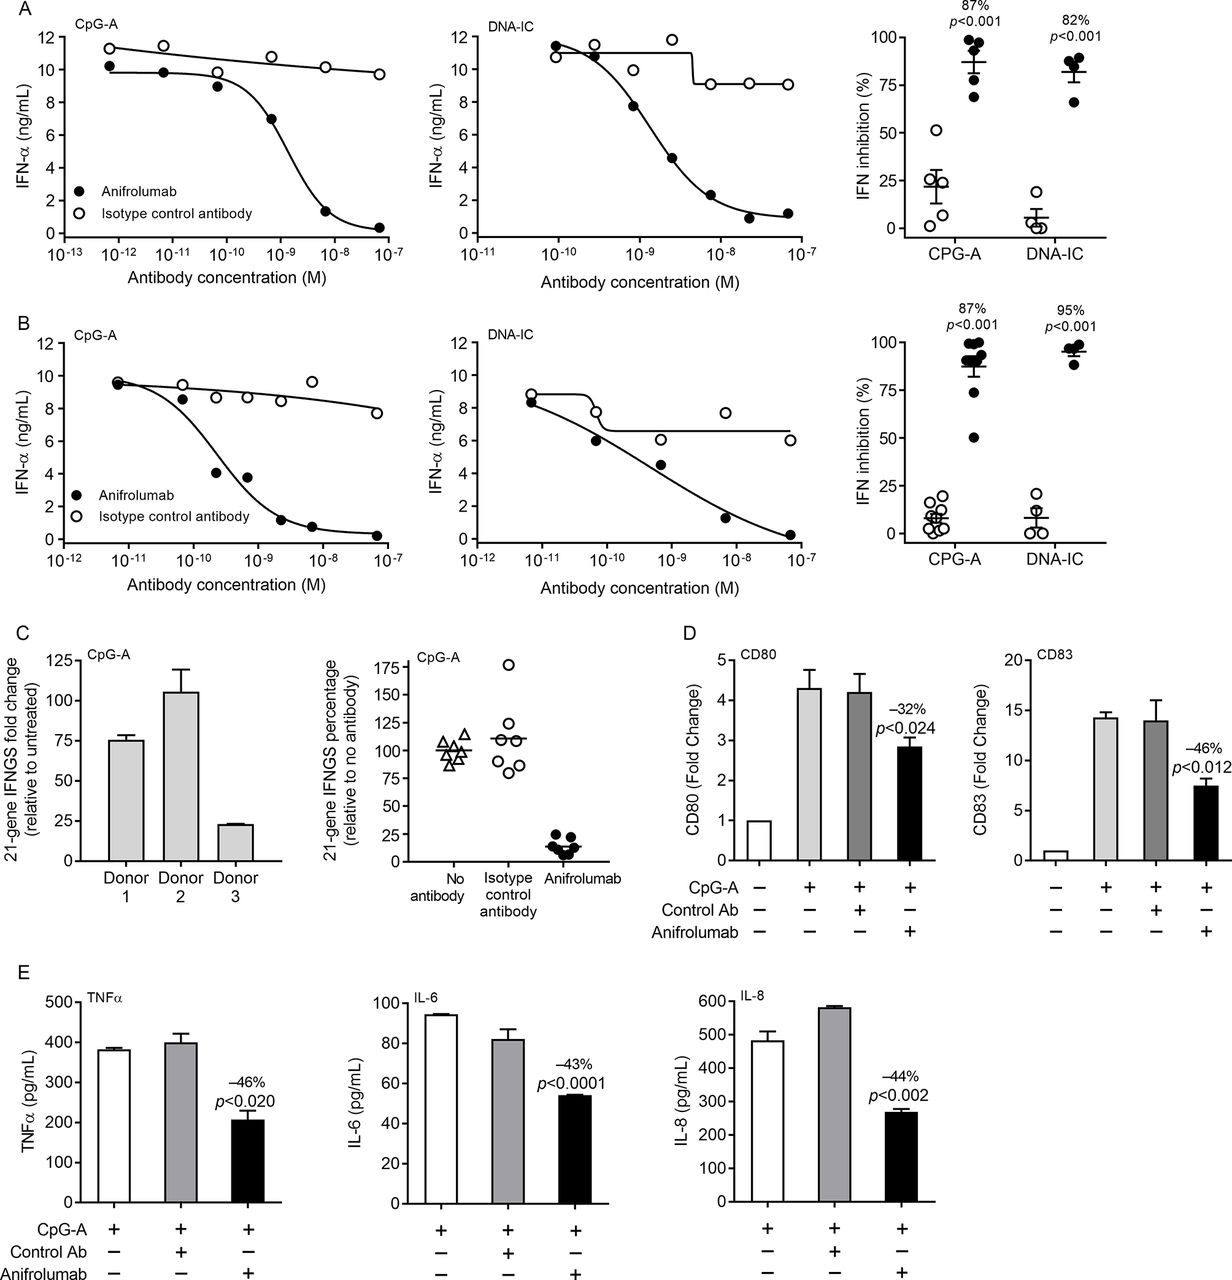
Anifrolumab inhibits cytokine production, plasmacytoid dendritic cell (pDC) activation and the type I (interferon gene signature) IFN gene signature. IFN-α production by CpG-A-stimulated and DNA/IgG–immune complexes (DNA-IC)-stimulated (A) peripheral blood mononuclear cells (PBMCs) and (B) pDCs with and without preincubation with anifrolumab or isotype control antibody. Dose–response curve of antibody inhibition of IFN-α from a representative donor stimulated with (A and B, left panel) CpG-A or (A and B, centre panel) DNA-IC and (A and B, right panel) quantification of IFN inhibition in multiple donors at 10 µg/mL (67.7 nM) anifrolumab or isotype control antibody. (C, left panel) Induction of the 21-gene IFN gene signature in CpG-A-stimulated PBMCs from three donors. (C, right panel) Inhibition of the 21-gene IFN gene signature in CpG-A-stimulated PBMCs from seven donors with and without preincubation with anifrolumab or isotype control antibody. (D) CD80 activation and CD83 maturation surface marker expression in CpG-A-stimulated pDCs with and without preincubation with 10 µg/mL (67.7 nM) anifrolumab or isotype control antibody. (E) TNF-α, interleukin (IL)-6 and IL-8 secretion from CpG-A-stimulated pDCs with and without preincubation with 10 µg/mL (67.7 nM) anifrolumab or isotype control antibody. One representative experiment of six replicate experiments in all panels. Values are means and SDs.
Anifrolumab blocks the induction of the type I IFN gene signature
Previously, we validated a type I IFN gene signature based on the expression of 21 genes.31 We now determined if blockade with anifrolumab could suppress the type I IFN gene signature induced by PBMCs stimulated with the TLR agonist CpG-A. The PBMC IFN gene signature increased from 20-fold to 100-fold with CpG-A stimulation (figure 3C). Preincubation with anifrolumab suppressed the CpG-A-induced IFN gene signature by an average of 86% compared with no antibody treatment (figure 3C and online supplementary figure 3).
Anifrolumab suppresses activation of, and cytokine production from, human pDCs
Type I IFNs can affect adaptive immune responses by stimulating dendritic cells and promoting cellular and humoral responses. We assessed the effects of 10 µg/mL (67.7 nM) anifrolumab or isotype control antibody on CpG-A-mediated pDC production of surface costimulatory molecules and proinflammatory cytokines. Anifrolumab reduced CD80 and CD83 surface expression on pDCs by 30–50% as measured by flow cytometry (figure 3D). Similarly, anifrolumab inhibited pDC production of TNF-α, IL-6 and IL-8 by 40–50% (figure 3E).
Together, these data show that anifrolumab blocks type I IFN production and the type I IFN gene signature that results from the stimulation of pDCs. Additionally, anifrolumab partially inhibits cytokine production and upregulation of costimulatory molecules on pDCs.
Anifrolumab inhibits plasma cell differentiation
B cell/pDC co-cultures were stimulated with either IL-21 as a positive control for plasma cell differentiation or CpG-A to stimulate pDC activation and type I IFN production. As expected, IL-21 induced plasma cell differentiation in B cell cultures with or without pDCs (figure 4A). In contrast, the response of B cells alone to CpG-A was modest, with a more robust plasma cell response generated when B cells were co-cultured with CpG-A-activated pDCs. Importantly, blockade of IFNAR1 inhibited pDC-mediated plasma cell differentiation in a dose-dependent manner, with a mean 76% reduction in plasma cell number relative to control antibody (figure 4B, C and D). These data demonstrate that anifrolumab suppresses differentiation of B cells into plasma cells.

Anifrolumab suppresses plasmacytoid dendritic cell (pDC)-dependent plasma cell differentiation. (A) Representative flow cytometry plots and quantification of plasma cell (CD19+CD27highCD38high) differentiation in untreated, interleukin (IL)-21-stimulated (positive control) or CpG-A-stimulated B cell/pDC co-cultures. (B) Representative flow cytometry plot and (C and D) quantification of plasma cell differentiation in CpG-A-stimulated B cell/pDC co-cultures with and without preincubation with anifrolumab or control antibody. Values are means and SDs.
Anifrolumab lacks FcγR binding Fc-mediated effector function
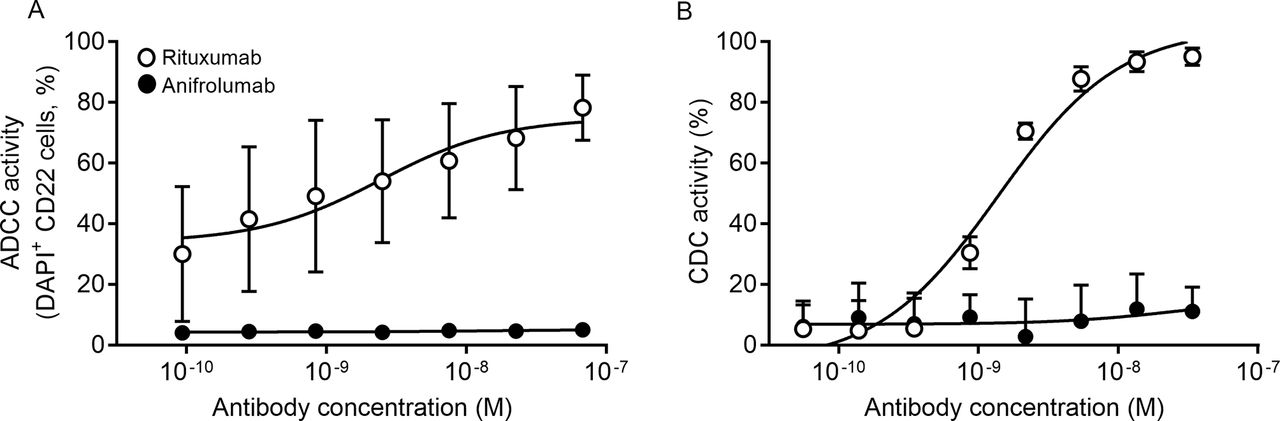
Anifrolumab was engineered to include three amino acid changes in the heavy chain–constant Fc region (L234F/L235E/P331S) to reduce engagement with FcγRs and minimise antibody-mediated effector functions.28 These Fc modifications reduced the binding of anifrolumab to FcγRs compared with the parental antibody (online supplementary figure 4). We used B cells and a Daudi B cell line for ADCC and CDC assays, respectively, because B cells have relatively high expression of IFNAR compared with most other cell types.31 We readily detected both ADCC and CDC activities with the B cell-depleting antibody rituximab, whereas anifrolumab had no detectable ADCC or CDC activity (Figure 5A and B).
Anifrolumab does not elicit antibody-dependent cell-mediated cytotoxicity (ADCC) or complement-dependent cytotoxicity (CDC) activity. (A) ADCC of DAPI+ CD22 B cells incubated overnight with rituximab (positive control) or anifrolumab measured via flow cytometry. (B) CDC of Daudi cells incubated for 4–5 hours with rituximab (positive control) or anifrolumab measured via luminescence. Percentage CDC with anifrolumab or control antibody was determined in comparison with a maximum control. Data presented are averages of three individual experiments.
Discussion
The type I IFN pathway is dysregulated in patients with SLE and other autoimmune diseases, such as Sjögren’s syndrome, myositis, scleroderma and rheumatoid arthritis.32 Thus, targeting IFNAR1 is a promising therapeutic approach for these diseases.21 22 We report a comprehensive characterisation of the in vitro activities of anifrolumab, a monoclonal anti-IFNAR1 antibody currently in clinical trials for the treatment of SLE and lupus nephritis. Anifrolumab rapidly internalised IFNAR1, inhibited type I IFN-induced STAT1/2 signalling and potently inhibited ISRE signalling induced by all type I IFNs tested, including naturally derived type I IFNs from stimulated PBMCs and pDCs and type I IFNs from sera of patients with SLE. Blockade of type I IFN signalling in pDCs also suppressed the induction of type I IFNs following stimulation with interferogenic immune complexes, thereby breaking the type I IFN autoamplification loop. In addition to blocking the induction of type I IFNs, anifrolumab also partially inhibited the upregulation of costimulatory molecules and the production of other proinflammatory cytokines by pDCs. This inhibition likely results from anifrolumab neutralising IFN-mediated upregulation of costimulatory molecules, rather than inhibition of TLR agonism. In B cell/pDC co-cultures, blockade of type I IFNs with anifrolumab also suppressed plasma cell differentiation. Finally, we demonstrated that anifrolumab reduced FcγR binding and does not induce ADCC or CDC in vitro. Collectively, these data demonstrate that anifrolumab possesses the desired characteristics for clinical development in type I IFN-driven diseases.
Anifrolumab rapidly internalised IFNAR1 on primary human monocytes, resulting in a sustained reduction of cell surface IFNAR1. These data are consistent with a previous study that showed anifrolumab actively induced IFNAR1 internalisation in a cell line.33 The substantial reductions of cell surface IFNAR1 would limit ligand-induced heterodimerisation with IFNAR2 and prevent IFNAR signalling. Anifrolumab also sterically inhibits binding of IFNAR2-bound type I IFNs to the IFNAR1 subunit, preventing functional IFNAR complex assembly.27 Thus, anifrolumab has two key mechanisms of action, which in combination potently inhibit IFNAR signalling.
Downstream of ligand-induced IFNAR1/2 complex formation, phosphorylated STAT1/2 heterodimers migrate to the nucleus, where they associate with IRF9 to form a major transcription complex, which then binds to ISREs in the promoters of many IFN-inducible genes.34 Anifrolumab inhibited type I IFN-induced STAT1 phosphorylation, induction of ISRE reporter activity and induction of a type I IFN gene signature. These data are entirely consistent with anifrolumab functioning as a potent antagonist of the type I IFN signalling pathway.
Anifrolumab potently inhibited ISRE signalling induced by all 14 recombinant type I IFNs tested, which included 12 IFN-α subtypes, IFN-β1 and IFN-ω, as well as type I IFNs generated from pDCs and sera of patients with SLE. Similar levels of IFN activity induced by 1 million PBMCs or 10 000 pDCs indicate that pDCs are the major source of type I IFNs in PBMCs. The induction of ISRE activity from cultures of pDCs stimulated with CpG-A or DNA-IC complexes is consistent with previous studies that indicate immune complexes containing nucleic acids in patient’s sera can activate nucleic acid-sensing TLRs.7 8 It was also notable that anifrolumab specifically inhibited ISRE reporter activity at concentrations of IFN-α (>100 000 U/mL or 137 ng/mL) that far exceed the concentrations that can be detected in the sera of patients with SLE.35 36 This is important, as high concentrations of type I IFNs may be present at inflammatory sites where pDC and immune complexes are concentrated. These data indicate that anifrolumab can inhibit IFNAR-mediated signalling regardless of the stimulating type I IFN subtype or its cellular source. The broad inhibitory capacity of anifrolumab may therefore provide a therapeutic advantage over approaches targeting soluble type I IFN, which have limited capacity to potently inhibit all the type I IFN-α, IFN-β, IFN-ω and IFN-κ subtypes or approaches that target specific type I IFN-producing cell types.
Blockade of IFNAR1 also affected the type I IFN autoamplification loop. Preincubation of anifrolumab with pDCs or PBMCs prior to stimulation with the CpG-A or DNA-IC reduced the production of IFN-α by approximately 80–95%. Initial type I IFN signalling upregulates components of the signalling pathway that enable pDCs to amplify the production of type I IFN.12 26 Therefore, anifrolumab can continually serve to suppress the overall generation of type I IFNs by pDCs in the presence of stimulatory DNA-associated/RNA-associated immune complexes. In addition to suppressing the induction of type I IFNs, preincubation with anifrolumab prior to TLR stimulation also affected other pDC functions, including the upregulation of costimulatory molecules and the production of proinflammatory cytokines such as TNF-α and IL-6. Type I IFN-induced upregulation of these inflammatory factors and costimulatory molecules by pDCs can further exacerbate tissue damage and propagate adaptive autoimmune responses.7 37 Blockade of IFNAR1 with anifrolumab therefore may suppress the production of type I IFN and other pDC functions and antagonise type I IFNs signalling on other cell types.
Autoantibodies generated by plasma cells play a critical role in the development and progression of SLE and other autoimmune diseases. Using B cell/pDC co-cultures, we also demonstrated that anifrolumab significantly inhibited differentiation of B cells into plasma cells. This result is consistent with previous findings that indicate type I IFN secretion from pDCs can increase presentation of autoantigens38 39 and promote autoreactive B cell differentiation and autoantibody production.40–42 Follicular dendritic cells also may be a critical source of IFN-α in breaking B cell tolerance and generation of autoantibodies.43 Therefore, it is predicted that anifrolumab also may impact the differentiation of autoreactive B cells and the production of autoantibodies.
IFNAR1 is expressed on the surface of mammalian cells, so it was important to verify that anifrolumab did not provoke undesirable Fc-mediated effector functions. We demonstrated that anifrolumab did not exhibit detectable ADCC or CDC activity. A combination of factors likely contributes to this desirable feature. First, the triple mutation (L234F/L235E/P331S) engineered in the Fc region of anifrolumab reduces potential FcγR engagement and complement fixation. Second, the cell surface expression of IFNAR1 is low and substantially reduced by the rapid and sustained internalisation of the antibody/IFNAR1 complex, which would limit the available antibody on the cell surface to promote effector functions. Therefore, we conclude that anifrolumab is unlikely to induce ADCC or CDC in vivo.
In clinical studies, anifrolumab significantly reduces the type I IFN signature in patients with SLE and scleroderma.34 44 In a Phase II clinical trial, treatment of patients with moderate-to-severe SLE with anifrolumab demonstrated significantly greater rates of improvement across a broad range of composite and organ-specific disease activity and resulted in overall lower disease activity and flares.45 Ongoing Phase III trials of anifrolumab will verify the efficacy of treating patients with moderate -to -severe SLE, and ongoing Phase II trials are examining anifrolumab efficacy in treating lupus nephritis.
In conclusion, anifrolumab blocks the biological activity of a broad range of type I IFNs. We attribute the potent activity of anifrolumab to the reduction of the cell surface IFNAR1 subunit, combined with the antagonism of ligand-induced IFNAR assembly. Inhibiting the type I IFN signalling pathway by targeting IFNAR1 with anifrolumab is a promising therapy for patients with moderate-to-severe SLE and warrants clinical exploration in other diseases with dysfunctional type I IFN signalling.
Acknowledgments
The authors wish to thank Mr Philip Brohawn for assistance with the 21-gene IFN gene signature studies. Editorial support was provided by Francis J Golder of Endpoint Communications and Michael A Nissen of AstraZeneca. This support was funded by AstraZeneca.
References
Footnotes
JMR and RNH contributed equally.
Contributors JMR and RNH equally contributed to study conception, design and execution; analysis and interpretation of data and manuscript preparation. MAS, GPS and RK contributed to study design, interpretation of data and manuscript preparation. BR, KZ, JLK, DS, IV, EF, KR, CM, MdlR, KS and ML contributed to assay design and execution, data analysis and interpretation and manuscript preparation.
Funding This study was funded by MedImmune, LLC.
Competing interests All authors are employees of MedImmune, LLC.
Ethics approval Study protocols involving human cells were approved by the MedImmune institutional review board (protocol number: 2010-001 v6.0).
Provenance and peer review Not commissioned; externally peer reviewed.
Data sharing statement Assay protocols are available upon request. Study data are available upon request and completion of a data sharing agreement with MedImmune via the Data Request Portal (https://astrazenecagroup-dt.pharmacm.com//DT/Home/Index/).
Presented at Some of the data have been published in abstract form following presentation at the 2017 Annual Meeting of the American College of Rheumatology (Sims GP, Riggs J, Hanna R, et al. Arthritis Rheumatol 2017; 69 (Suppl 10)).