Article Text

Abstract
Objective We investigated whether systemic lupus erythematosus (SLE) disease duration or serology associate with abnormal regional glucose metabolism as measured with [18F]2-fluoro-2-deoxy-D-glucose positron emission tomography (FDG-PET) and deficits on neuropsychological testing.
Methods Subjects with SLE with stable disease activity, without brain damage or clinical symptoms of neuropsychiatric (NP) SLE, stratified by disease duration (short-term (ST)-SLE=disease ≤2 years, long-term (LT)-SLE=disease ≥10 years), underwent clinical assessments, neuropsychological testing, resting FDG-PET scan imaging and measurement of serum titres of antibody to N-methyl-d-aspartate receptor (DNRAb). FDG-PET scans were compared with age-matched and gender-matched healthy controls.
Results Subjects with LT-SLE demonstrated hypometabolism in the prefrontal and premotor cortices that correlated with accrued SLE-related damage, but not with DNRAb titre or performance on NP testing. Independent of disease duration, subjects with SLE demonstrated hypermetabolism in the hippocampus and orbitofrontal cortex that correlated with impaired memory performance and mood alterations (depression, anxiety, fatigue). Serum DNRAb also correlated independently with impaired memory performance and increased anxiety. Together, serum DNRAb titre and regional hypermetabolism were more powerful predictors of performance than either alone.
Interpretation The presence of serum DNRAbs can account for some aspects of brain dysfunction in patients with SLE, and the addition of regional measurements of resting brain metabolism improves the assessment and precise attribution of central nervous system manifestations related to SLE.
- Autoantibodies
- Autoimmune Diseases
- Systemic Lupus Erythematosus
This is an Open Access article distributed in accordance with the Creative Commons Attribution Non Commercial (CC BY-NC 4.0) license, which permits others to distribute, remix, adapt, build upon this work non-commercially, and license their derivative works on different terms, provided the original work is properly cited and the use is non-commercial. See: http://creativecommons.org/licenses/by-nc/4.0/
Statistics from Altmetric.com
Key messages
-
Autoantibodies directed against the NMDA receptor, DNRAb, are known to mediate neuronal toxicity. FDG-PET imaging may provide a biomarker for DNRAb-mediated cognitive and behavioral dysfunction.
-
FDG-PET imaging demonstrates increased regional metabolism in the hippocampus of SLE subjects compared to healthy controls, irrespective of disease duration. Both DNRAb serum titres and increased hippocampal metabolism were independent predictors of poor memory performance; the two predictors together improved the accuracy of the predictions made based on either individual measure alone.
-
Decreased metabolism in the prefrontal cortex and premotor cortex correlates with long term disease and overall damage and not with DNRAb.
Introduction
Cognitive impairment (prevalence range 30–80%) and behavioural disturbances (prevalence range 17–75%) including mood disorders and anxiety are common manifestations of neuropsychiatric systemic lupus erythematosus (NPSLE),1–5 and both demonstrate significant impact on quality of life.6 ,7 Neuropsychological testing has revealed abnormalities in a wide range of cognitive domains in patients with SLE;1 ,2 ,8–12 however, attribution of neuropsychiatric abnormalities to a pathological mechanism associated with SLE is hampered by the confounding influences of medications, infections, comorbid disease, hormonal and metabolic disturbances. There is currently no specific biomarker or battery of tests that distinguish SLE-mediated cognitive and behavioural dysfunction. Such a biomarker would be essential for the development of therapeutic strategies for these problems.
DNRAbs are a subset of anti-dsDNA antibodies that cross-react with N-methyl d-aspartate receptors (NMDARs) on neurons; they have been shown to enhance synaptic signalling resulting in neuronal activation, dysfunction or death depending on antibody concentration.13 In the murine model, DNRABs mediate impairments in memory and behaviour.14 ,15 While associations between serum DNRAbs and cognitive and behavioural changes in human SLE have remained inconclusive,16 elevated DNRAb titres in cerebrospinal fluid (CSF) correlate with severe non-focal manifestations of NPSLE, such as seizures, acute confusional state, mood and anxiety disorders, psychosis and cognitive dysfunction.16–20 DNRAbs have also been identified in the CSF and brain tissue of patients with SLE who died with symptoms of cognitive impairment.15 ,21
The blood–brain barrier (BBB) does not normally allow antibody access to the brain; however, it is known that BBB permeability is altered in response to hypertensive episodes, nicotine, infection, stress and alcohol.22–25 We hypothesised that patients with SLE experience repeated breaches of BBB integrity, thereby allowing intermittent access of circulating autoantibodies to brain tissue. This hypothesis predicts that patients may exhibit increased autoantibody-mediated central nervous system (CNS) damage over time independent of measures of disease activity or damage in other organs, as we and others have previously demonstrated.26 Furthermore, it predicts an increase in CNS injury corresponding to longer disease duration.
We investigated the relationship among resting brain glucose metabolism, cognitive and behavioural performance, and serum DNRAb titres in stable patients with SLE with short-term (ST-SLE; disease ≤2 years) and long-term duration disease (LT-SLE; disease ≥10 years), and no acute or chronic CNS symptoms. Previous [18F]2-fluoro-2-deoxy-D-glucose positron emission tomography (FDG-PET) studies in patients with long-standing SLE report reduced metabolism in structurally intact brain regions,27–30 which may precede further clinical deterioration.30 Both hypoperfusion and hyperperfusion on FDG-PET scans in patients with active NPSLE symptoms and normal MRI have been reported,31 and diffuse hypermetabolism in white matter tracts has been reported in newly diagnosed patients with SLE and interpreted as CNS inflammation related to systemic disease activity.32 To date, there are no reported relationships among regional alterations in glucose metabolism, serology and cognitive and behavioural assessments in patients with SLE. This cross-sectional study was designed to test the hypothesis that SLE disease duration, and thus some measure of repeated exposure to a neurotoxic autoantibody, DNRAb, will associate with abnormal regional glucose metabolism and deficits on neuropsychological testing.
Patients and methods
Subject selection
All 17 subjects with SLE were 18 years of age or older and fulfilled the American College of Rheumatology (ACR) revised criteria for SLE. The SLE subject characteristics are found in table 1. Subjects were recruited randomly from the Rheumatology Clinics at the Feinstein Institute for Medical Research (FIMR) and were selected by disease duration; nine had ST-SLE (disease duration ≤2 years) and eight had LT-SLE (disease duration ≥10 years). Patients with SLE with active NPSLE (as defined by the ACR33), a history of NPSLE or other CNS event, were excluded to avoid the confounding effects of active or prior CNS insults on the imaging and neuropsychological endpoints. Additionally, all subjects with SLE were required to have stable disease activity and medication doses for 4 weeks prior to screening and pertinent exclusion criteria included current use of antidepressant, antipsychotic or anxiolytic drugs or history of illicit drug use. Seventeen healthy controls (HCs), selected from a cohort of resting FDG-PET imaging studies at the Center for Neurosciences in the FIMR, were matched for gender and age.
SLE subject characteristics
Clinical and behavioural assessments
Measures of disease activity, the Systemic Lupus Erythematosus Disease Activity Index (SLEDAI)34 and accrued damage, the Systemic Lupus International Collaborating Clinics Damage Index (SLICCDI),35 were assessed within two weeks of PET imaging. Cognitive function was assessed on the day of imaging using the automated neuropsychological assessment metric (ANAM).36 This neuropsychological battery comprised a set of computerised measures of sustained attention, visual search, computational skills, concentration, spatial and cognitive processing, and working memory. Throughput scores, representing a combination of reaction time and accuracy, were the primary measure of cognitive processing used in the analyses. ANAM subtests were also grouped according to their representative cognitive domains and their mean total throughput scores (TTS) were correlated with metabolism and serology.37 ,38 Subjects were additionally rated for depression, anxiety and fatigue with the Beck Depression Inventory, State-Trait Anxiety Inventory and the ANAM assessment of mood domains (vigour, restlessness, depression, anger, fatigue, anxiety and happiness).
ELISA
Serum DNRAb assays were performed by ELISA with the DWEYS consensus sequence as the substrate as previously described.39
Positron emission tomography
Following an overnight fast, subjects with SLE and HC underwent FDG-PET imaging as described in detail elsewhere.40 Scanning was conducted in 3-D mode using the GE Advance tomograph (General Electric Medical Systems, Milwaukee, Wisconsin, USA) at the FIMR. Autoradiographic PET images were acquired for 20 min beginning 35 min after the injection of 3.5 mCi FDG in an eyes-open rest state in a dimly lit room with minimal auditory stimulation. Following scan preprocessing, individual images were non-linearly warped into Talairach space using a standard PET template, and smoothed with an isotropic Gaussian kernel (10 mm) in all directions to improve the signal-to-noise ratio. Investigators blinded to subject identity, clinical status, duration of symptoms and DNRAb level conducted data acquisition and analysis.
Imaging analysis
A voxel-wise search of whole brain volume using the two-sample t test option in SPM5 (Institute of Neurology, London, UK) was performed to assess group differences in regional metabolic activity among the combined SLE groups, ST-SLE and LT-SLE, and HCs. SPM (T) maps were created for each group and threshold at T=3.4, p=0.001 (peak voxel, uncorrected). Group differences were considered significant for p<0.05, corrected at the cluster level. Metabolic activity in significant brain regions was assessed using spherical (radius=5 mm) volumes of interest (VOIs), centred at the peak voxel of each cluster. In each VOI, globally normalised values were compared between groups using one-way analysis of variance (ANOVA) with post hoc Bonferroni tests; results were considered significant at p<0.05, two sided.
Statistical analysis
Baseline characteristics of subjects with SLE, ANAM subtest throughput scores and TTS scores were analysed using t tests or non-parametric Mann–Whitney U tests. Relationships among resting regional metabolism, ANAM subtest scores and mood scores, serum DNRAb titres and clinical parameters were examined using Pearson's correlations (r) or Spearman's correlations (rs) for abnormally distributed data. Multiple regression analysis was used to test whether DNRAb and metabolic activity could improve the prediction of performance on neuropsychological tests for subjects with SLE. Analyses were performed using SPSS V.12 (SPSS, Chicago, Illinois, USA). All tests were two-sided, and significance was set at p<0.05.
Results
SLE clinical characteristics and ANAM scores
There were no clinical differences between the ST-SLE and LT-SLE groups other than an expected increase in the mean SLICCDI in the LT-SLE group (table 1).
ST-SLE and LT-SLE groups performed comparably in mean throughput scores or TTS on all of the ANAM subtests and the mood domains. C3, C4, anti-dsDNA and anti-Ro antibody titres, SLEDAI scores, SLICCDI, use of disease-modifying drugs and prednisone dose also did not significantly correlate with ANAM subtest throughput scores or with depression and anxiety ratings.
Resting metabolic abnormalities in subjects with SLE
Brain regions with significant changes in metabolic activity in the combined SLE groups relative to HCs are presented in table 2A. A voxel-by-voxel search of the whole brain volume revealed significantly increased metabolism in the SLE groups (figure 1, top) involving the hippocampus, orbitofrontal cortex (Brodmann area (BA) 11), posterior putamen and globus pallidus. Analysis of individual metabolic data from these regions (figure 1, bottom) disclosed abnormal increases in subjects with both ST-SLE (p<0.03) and LT-SLE (p<0.003, post hoc Bonferroni tests) relative to the subjects with HC (p<0.001, one-way ANOVAs). Metabolic activity in these regions did not differ between the two SLE subgroups (p>0.27). Additionally, there were no differences in global metabolic rate between the SLE and HC groups (p>0.10) or between the two SLE subgroups (p>0.09).
Brain regions with significant differences in metabolic activity (A) between subjects with SLE and healthy controls; (B) between subjects with LT-SLE and ST-SLE
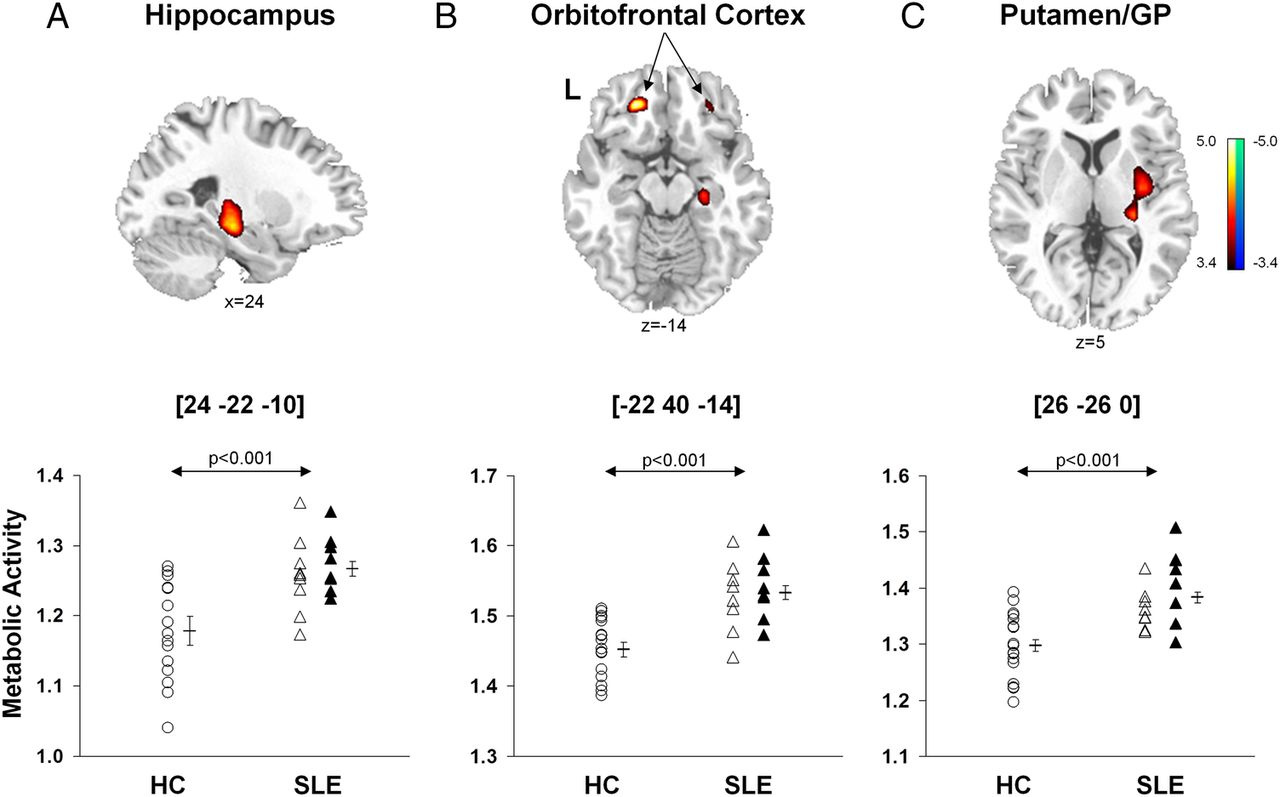
Voxel-based comparisons of FDG-PET images for SLE and healthy control subjects. SLE subjects (n=17) were age-matched and gender-matched with HCs (n=17). The SLE subjects demonstrated significantly increased metabolic activity (top) in the hippocampus (A), orbitofrontal cortex (BA 11, B) and putamen/globidus pallidus (GP, C) compared to HCs. In each region (bottom; p<0.001, one-way ANOVAs), metabolic activity was higher (p<0.05) in SLE subjects (open and filled triangles) than HC subjects (open circles), but did not differ (p>0.27) between the ST-SLE (open triangles) and LT-SLE (filled triangles) groups. Statistical parametric maps (SPM) were superimposed on a single-subject MRI brain template and thresholded at T=3.4, p<0.001 (uncorrected). Metabolic increases are color coded from red to yellow. The left side (L) is labeled on the display.
In contrast, there were significant reductions in metabolic activity (figure 2, top; table 2B) in the prefrontal (BA 9, p<0.05; BA 10, p<0.001, post hoc Bonferroni tests) and premotor (BA 6, p<0.05) regions in the LT-SLE relative to subjects with ST-SLE. The subjects with LT-SLE, but not the subjects with ST-SLE, also displayed decreased metabolic activity in the prefrontal cortex compared with the HCs (BA 9, p<0.05; BA 10 p<0.005, post hoc Bonferroni test) (figure 2, bottom). The premotor cortex (BA 6) changes among HC and SLE groups did not reach significance (p>0.21).
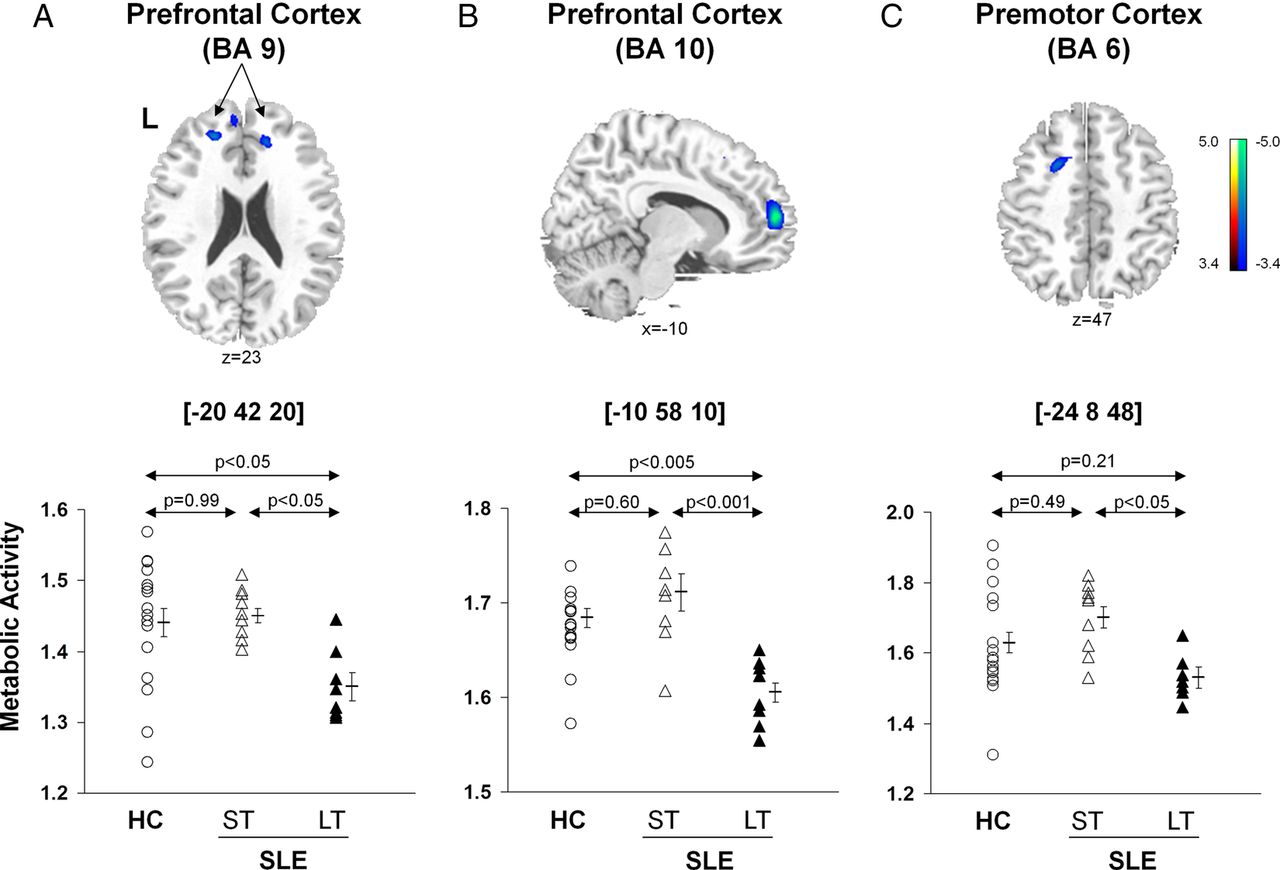
Voxel-based comparisons of FDG-PET images for SLE subjects with different disease duration and HC. Significantly decreased metabolic activity (top) was present in the prefrontal cortex (BA 9 and 10, A and B) and the premotor cortex (BA 6, C) of the LT-SLE subjects. The LT-SLE subjects (filled triangles) demonstrated significant hypometabolism compared to the ST-SLE subjects (open triangles) in each of these areas (bottom; p<0.05, one-way ANOVAs). However, compared to HCs (open circles), the LT-SLE subjects demonstrated significant hypometabolism only in the prefrontal cortex (p<0.05, A, B). Metabolism in the prefrontal and premotor regions did not differ significantly between the ST-SLE subjects and HCs. Statistical parametric maps (SPM) were superimposed on a single-subject MRI brain template and thresholded at T=3.4, p<0.001 (uncorrected). Metabolic decreases are color coded from blue to green. The left side (L) is labeled on the display.
Correlations between metabolic activity and cognitive/mood testing in subjects with SLE
Metabolism in the left hippocampus (figure 3A) correlated with impaired performance on the running memory continuous performance test (RMCPT, r=−0.61, p<0.01). Metabolic activity in the left orbitofrontal cortex also correlated with impaired performance on the code substitution (CST, r=−0.65, p<0.005) (figure 3D), CST delayed (r=−0.50, p<0.05) and memory search (r=−0.52, p<0.04) tests. Mean TTS on ANAM subtests that included assessments of sustained attention (CST, CST delayed, math processing and memory search) also demonstrated a correlation with left orbitofrontal hypermetabolism and impaired performance (r=−0.5, p<0.05). Similarly, metabolic activity in the right orbitofrontal region correlated inversely with performance in math processing (r=−0.51, p<0.04) and memory search (r=−0.59, p=0.01). No correlations were identified between cognitive or behavioural performance and basal ganglia metabolic activity. Significant correlations were identified between increasing right hippocampal metabolism and ANAM scores for depression (figure. 3B, r=0.58, p<0.02), anxiety (figure 3C, r=0.52, p<0.04) and fatigue (r=0.53, p<0.03). Increased left orbitofrontal metabolism also correlated with increased anxiety (r=0.61, p=0.01).

Correlation between resting metabolism in SLE subjects and cognitive or behavioral performance. Increased metabolism in the left hippocampus correlated with poor performance on the running memory continuous performance test (RMCPT), a measure of sustained attention (A, p<0.01). Increased metabolism in the right hippocampus correlated with increased depression and anxiety scores (B and C, p<0.05); and increased metabolism in the left orbitofrontal cortex correlated with poor performance on the code substitution test, a measure of visual search, sustained attention and memory (D, p<0.005).
Correlations of cognitive/mood testing and metabolic activity with serum DNRAb and other autoantibodies
DNRAb serum titres correlated inversely with mean TTS for ANAM subtests that included measurements of sustained attention (see above) and working memory (CST delayed, match-to-sample, memory search, RMCPT) (r=−0.66, p<0.005). Significant correlations were identified between increasing serum DNRAb titres and worsening throughput scores on the RMCPT (r=−0.72, p<0.002), CST (r=−0.56, p<0.03) and match-to-sample (r=−0.56, p<0.03). Increasing serum DNRAb titres also correlated with greater impairment on tests of depression (r=0.73, p=0.001) and anxiety (r=0.64, p<0.008). Serum levels of anti-dsDNA and anti-Ro antibodies did not significantly correlate with performance on any of the ANAM subtests or mood assessments.
DNRAb serum titres correlated with increased metabolic activity in the left hippocampus (r=0.53, p<0.04) and orbitofrontal cortex (r=0.50, p<0.05). Metabolic activity in these regions did not correlate with the clinical assessments of complement components, anti-dsDNA or anti-Ro AAb titres, SLEDAI scores, SLICCDI, prednisone dose, age or with the use of disease-modifying drugs.
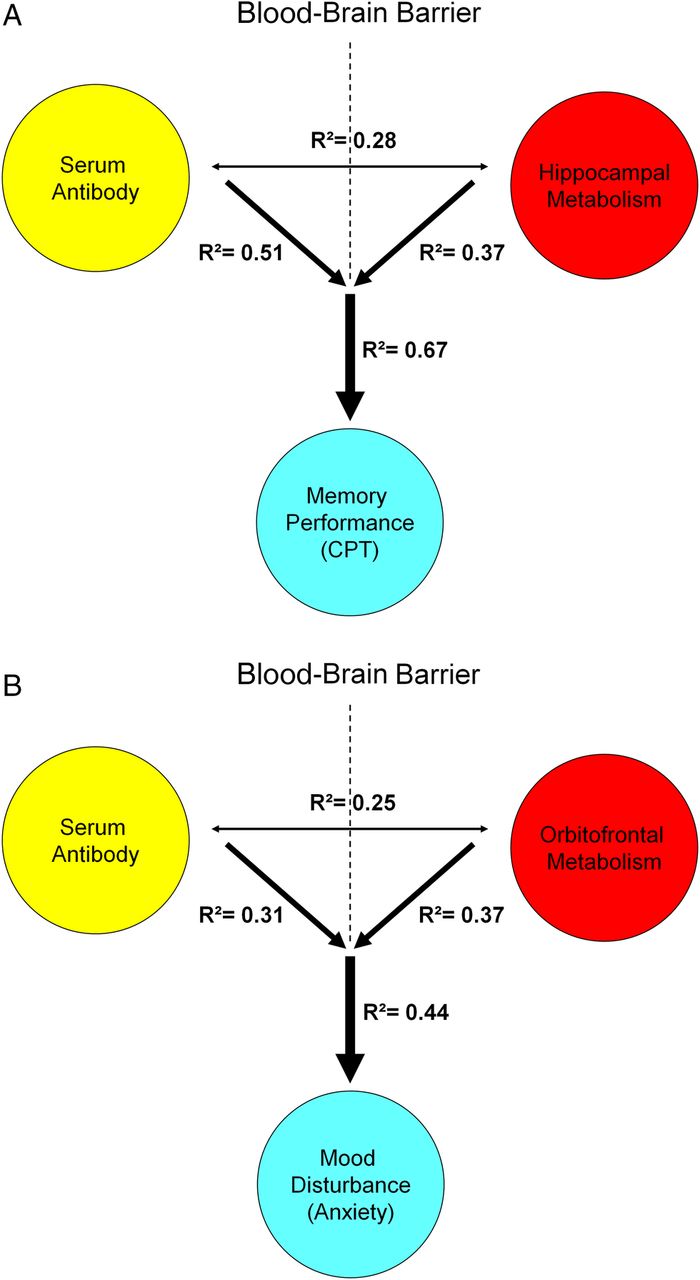
Both DNRAb titres (R2=0.51, p<0.002) and increased left hippocampal metabolic activity (R2=0.37, p<0.01) were independent predictors of memory performance (RMCPT) (figure 4A). Importantly, the two measures in concert improved (R2=0.67, p<0.0008, multiple regression analysis) the accuracy of the predictions made based on either of the individual measures. Similarly, DNRAb titres and increased left orbitofrontal metabolism together provided a better prediction (R2=0.44, p<0.03, multiple regression analysis) of mood disturbance (anxiety) than each measure individually (DNRAb titre, R2=0.31, p<0.03; orbitofrontal metabolism, R2=0.37, p=0.01) (figure 4B).
Predictive model of memory performance and mood alteration with serum DNRAb and metabolism in SLE. A. Multiple regression analysis demonstrates that the combined influence of elevated serum DNRAb titers (yellow) and increasing metabolism in the hippocampus (red) better predicts memory impairment in cognitive performance (blue) in the SLE patients (R2=0.67, p<0.0008) than either measure alone (hippocampal metabolism: R2=0.37, p<0.01; DNRAb: R2=0.51, p<0.002). B. Similarly, the combined effects of serum DNRAb (yellow) and increasing orbitofronal metabolism (red) are a more powerful predictor of increased anxiety (blue) (R²=0.44, p<0.03) than either measure independently (DNRAb: R²=0.31, p<0.03; orbitofrontal metabolism: R²=0.37, p=0.01).
Metabolic abnormalities related to disease duration
Disease duration exhibited an inverse relationship with metabolic activity in the prefrontal (BA 9, rs=−0.58, p<0.02; BA 10, rs=−0.53, p<0.03) and premotor (BA 6, rs=−0.56, p<0.02) regions (figure 2). The SLICCDI, which measures damage accrued from SLE, comorbid conditions and/or medication, was higher (p=0.007) in the subjects with LT-SLE (table 1), and it correlated with declining metabolic activity in the prefrontal regions (BA 9, r=−0.52, p<0.04; BA 10, r=−0.46, p=0.06).
Discussion
The data suggest that distinct potential mechanisms for neurotoxicity underlie alteration of CNS function in SLE. SLE disease duration associates with depression of resting glucose metabolism in the prefrontal cortex, and this regional hypometabolism also associates with accrued damage (related to disease activity, comorbid disease, infections and medications) but not with serum DNRAb titres or assessments of cognitive performance and mood. Increased glucose metabolism in the hippocampus and orbitofrontal cortex in subjects with SLE is independent of disease duration and is linked to serum DNRAb titres, memory impairment and mood alterations. Importantly, serum titres of other autoantibodies, anti-dsDNA and anti-Ro antibodies, do not correlate with regional hypermetabolism or function. These clinical data are consistent with candidate mechanisms for DNRAb neurotoxicity established in the animal model where memory impairment and behavioural alteration are associated with DNRAb effects on NMDAR physiology.
Interpretation of these findings depends on timing and a more complete understanding of regional glucose hypermetabolism that may represent a compensatory neuronal response to damage, a localised inflammatory response or both. We and others have reported increased cortical activation patterns in subjects with SLE compared with HCs, implying increased recruitment of neural networks as a compensatory response.41–43 Accordingly, recent micro-PET studies combined with brain histopathology in a murine model of DNRAb-mediated neuron toxicity revealed hippocampal hypermetabolism associated with a decreased number of neurons following BBB breach with lipopolysaccharide (LPS) in DNRAb positive mice with circulating DNRAb. These mice also exhibited impaired spatial memory. This was in contrast to the DNRAB negative control mice that exhibited hippocampal hypermetabolism following BBB breach with LPS but with a normal hippocampal neuron number and no functional impairment.44 Increased hippocampal metabolism in the DNRAb negative control mice likely represents an inflammatory response to LPS as there were no behavioural or histopathological consequences. Conversely, the hippocampal hypermetabolism that inversely correlated with neuron number in the DNRAb positive mice exposed to LPS suggests a compensatory neuronal response. Our findings suggest that DNRAb-mediated insults in human disease may also lead to a compensatory neuronal response, local inflammation or both with functional consequences. The powerful predictive value of hippocampal hypermetabolism and serum DNRAb for cognitive and behavioural performance in this cross-sectional study has implications for efficacy measures in a therapeutic trial, but the findings will first need to be validated in a longitudinal study.
Many proinflammatory molecules have been identified in the CSF of patients with NPSLE in addition to autoantibodies.45–47 The presence of elevated Q albumin, a clinical mark of BBB breach, or reversible neuron dysfunction on magnetic resonance spectroscopy studies in patients with SLE with active disease and no overt symptoms of NPSLE, supports the hypothesis that patients with SLE can experience a CNS inflammatory response in the absence of apparent CNS symptoms,48 ,49 analogous to the LPS-induced localised brain inflammatory response in mice.44
We also detected significant glucose hypermetabolism in the orbitofrontal cortex that was significantly correlated with impaired performance on ANAM subtests requiring sustained attention and increased anxiety ratings in these individuals. The orbitofrontal lobe participates in executive processes such as regulation of cognition and emotion.50 It is also part of a neural circuit that communicates with the amygdala, a centre for emotional learning and processing of fearful stimuli;51 this may contribute to the observed correlation with sustained attention. The significant correlations between hippocampal hypermetabolism and increased depression, anxiety and fatigue and orbitofrontal metabolism and anxiety corroborate prior reports of serum DNRAb titres linked to mood disturbances.16 Perhaps most importantly from a mechanistic perspective, the metabolic increases in the three regions are unrelated to each other. This is unlike the patterned network dysfunction that has been identified in primary neuronal degenerations like Parkinson's disease.52 Thus, it is possible that some of the neuropsychiatric manifestations observed in SLE result from autoantibody-mediated brain events that target different regions independent of each other.
Interestingly, regional hypermetabolism did not correlate with disease duration. This is consistent with previous reports of brain involvement early in disease.12 ,32 ,53 It is possible that functional outcome measures may correlate with disease duration among a subgroup of subjects with chronically elevated titres of serum DNRAb; however, a larger longitudinal study would be needed to test this. Disease duration did correlate with metabolic decline in the prefrontal and premotor cortical regions. Moreover, prefrontal cortex hypometabolism correlated with the SLICCDI, suggesting that these changes reflect the sustained, accumulated effects of SLE activity, comorbid disease and/or medications, on regional brain function over extended periods of time. The comparable performances of the LT-SLE and ST-SLE groups on the ANAM tests and mood assessments, combined with the lack of association between DNRAb and the hypometabolic areas, suggest that time-dependent mechanisms interact with receptor physiology and pathology to produce brain dysfunction distinct from direct DNRAb toxicity.
In summary, the use of FDG-PET imaging, serology and neuropsychological assessments has identified striking predictors of cognitive and behavioural performance in this cross-sectional study. While serum DNRAbs and regional brain hypermetabolism associate independently with functional consequences, in combination they are a more powerful predictor of performance than either alone. Our findings are informed further by a murine model of DNRAb neurotoxicity that demonstrates separate mechanisms for glucose hypermetabolism; a compensatory response of neurons surviving DNRAb-mediated neurotoxicity and a localised inflammatory response to BBB disruption.44 The regional hypermetabolism demonstrated by subjects with SLE in this study may reflect localised inflammatory responses that can be triggered by a variety of insults to the BBB. However, consistent with the murine model, memory impairment and mood disturbance associate significantly with serum DNRAb titres. It is likely that other mechanisms are responsible for the regional hypometabolism that associates with disease duration and the SLICCDI. The results of this study suggest that composite variables including regional measurements of resting brain metabolism may improve the prediction of CNS manifestations attributable to SLE and longitudinal studies will be necessary to evaluate this. Elucidating the specific mechanisms that contribute to different CNS manifestations of SLE is an important direction for research in SLE and will be best accomplished through coordinated studies of patients and murine models.
References
Footnotes
-
Contributors BD and DE are co-senior authors. MM and CA participated in study conception, design, enrolment, data collection, data analysis, interpretation of results and manuscript preparation. CCT participated in the data analysis, PET analyses, interpretation of results and manuscript preparation. BD, BTV and DE all participated in the study conception, design, data analysis, interpretation of results and manuscript preparation. PJM participated in interpretation of results and manuscript preparation. RAK participated in data analysis and interpretation of results. All authors have read and approved the manuscript prior to submission.
-
Funding This research was supported by the NIH, 1P01AI073693-05 and the Lupus Foundation of America, 113121.
-
Competing interests None.
-
Patient consent Obtained.
-
Ethics approval The research was in compliance with the Helsinki Declaration and approved by the Institutional Review Board and the Institutional Radioactive Dose Research Committee of the North Shore/LIJ Health System.
-
Provenance and peer review Not commissioned; externally peer reviewed.
-
Disclaimer The funding sources for the study had no role in study design, conduct, analysis or interpretation.
-
Data sharing statement Requests from colleagues for unpublished data from this study will be reviewed by the authors and made available on a case-by-case basis.