Article Text

Abstract
Objective To develop a simple systemic lupus erythematosus (SLE) severity index that requires knowledge of only American College of Rheumatology (ACR) criteria and subcriteria.
Methods This study used demographic, mortality and medical records data of 1915 patients with lupus from the Lupus Family Registry and Repository. The data were randomly split (2:1 ratio) into independent training and validation sets. A logistic regression with ridge penalty was used to model the probability of being prescribed major immunosuppressive drugs—a surrogate indicator of lupus severity. ACR criteria and subcriteria were used as predictor variables in this model, and the resulting regression coefficient estimates obtained from the training data were used as item weightings to construct the severity index.
Results The resulting index was tested on the independent validation dataset and was found to have high predictive accuracy for immunosuppressive use and early mortality. The index was also found to be strongly correlated with a previously existing severity score for lupus. In addition, demographic factors known to influence lupus severity (eg, age of onset, gender and ethnicity) all showed robust associations with our severity index that were consistent with observed clinical trends.
Conclusions This new index can be easily computed using ACR criteria, which may be among the most readily available data elements from patient medical records. This tool may be useful in lupus research, especially large dataset analyses to stratify patients by disease severity, an important prognostic indicator in SLE.
- Lupus Severity
- Severity Index
- ACR criteria
This is an Open Access article distributed in accordance with the Creative Commons Attribution Non Commercial (CC BY-NC 4.0) license, which permits others to distribute, remix, adapt, build upon this work non-commercially, and license their derivative works on different terms, provided the original work is properly cited and the use is non-commercial. See: http://creativecommons.org/licenses/by-nc/4.0/
Statistics from Altmetric.com
Introduction
Systemic lupus erythematosus (SLE) is a chronic, heterogeneous autoimmune disease characterised by a fluctuating clinical course and multiorgan inflammation that can be resistant to therapy and often leads to end organ damage. A distinct aspect of SLE is the broad variability in disease severity among individuals, defined by the number and type of organs involved and the intensity of inflammation at a point in time and over time.1 Patients with mucocutaneous and musculoskeletal manifestations, serositis and peripheral blood cytopenias other than haemolytic anaemia may sometimes have a milder form of lupus, whereas those with major central nervous system, renal, cardiovascular and/or select pulmonary disease are considered severe cases. Such severe SLE features are often clinical predictors of poorer long-term prognosis and have been associated with early mortality.2
Unfortunately, the clinical heterogeneity of SLE, often with simultaneous presence of manifestations attributable to disease activity, end organ damage, drug toxicities and comorbid conditions, makes quantifying disease severity a difficult undertaking.3 Although disease activity indices only reflect the burden of active inflammation around the time of assessment, high disease activity at any time4 as well as measures that summarise disease activity over time,5 have been previously examined as surrogates of lupus severity. Disease severity is associated with damage, a major predictor of long-term prognosis in SLE, nonetheless damage indices do not accurately capture lupus-specific disease severity, since damage is related to multiple factors beyond disease activity itself.6
In an attempt to reflect the cumulative morbid burden of disease Katz et al7 introduced the first SLE-specific severity index in 1993. Scale construction of the Katz Severity of Disease Index (Katz SDI) was literature based and included items (SLE clinical manifestations) previously associated with morbidity or mortality. The index was tested on two independent cohorts (n=46; n=48) where it correlated with rheumatologists’ global assessments of disease severity (scored on a visual analogue scale), renal biopsy scores and short-term mortality.7 Selected SLE manifestations captured by the ACR criteria, as well as the number of ACR criteria satisfied to date were included in the Katz SDI. Other investigators have also incorporated ACR criteria or subcriteria in assessments of disease activity3 ,8 and damage,6 since these are validated and readily accessible elements in medical charts and research datasets. However, we have not found any severity indices that require only the most readily available elements in medical records—ACR criteria. Like the Katz SDI, other indices often have components that are less likely to be available in medical records and research datasets. Further, the computation of some of these indices requires in-person clinician scoring, a process which can be prohibitively expensive and time-consuming for lupus research studies using large cohorts of patients.
We herein developed an index of lupus disease severity (termed the Lupus Severity Index (LSI)) using only ACR criteria and subcriteria. The LSI was validated in an independent cohort, where it proved to be highly predictive of immunosuppressant use and mortality, and correlated strongly with the Katz SDI. Unlike the Katz SDI, however, LSI can be easily computed without in-person clinician scoring and therefore has significant potential in SLE research, where it could be used in identifying patients at risk of early mortality, major organ involvement and for disease subsetting to understand underlying pathogenic mechanisms.
LSI was derived by fitting ACR criteria and subcriteria against a proxy measure of severity defined as any history of major immunosuppressant use. In patients with SLE, the pattern of immunosuppressant use reflects the progression and severity of the disease. Selection of therapies in SLE usually follows a stepwise approach, guided by the intensity and extent of inflammation in the organs involved as well as the potential for end organ damage.1 NSAIDs, antimalarials and low dose corticosteroids are the mainstays of therapy in patients with predominantly cutaneous, musculoskeletal or serosal involvement; whereas methotrexate, azathioprine, leflunomide or belimumab are reserved for more severe inflammation in these or other organs. In patients with suboptimal response to those agents, mycophenolate mofetil, rituximab and calcineurin inhibitors like ciclosporin can be used as a third line treatment. These medications are also employed as first line therapy for renal or haematological disease or other major organ involvement. Clinicians still resort to cyclophosphamide with or without high dose steroids in cases of severe life-threatening lupus, although rituximab and mycophenolate are frequently used as alternate major immunosuppressants when possible.
Materials and methods
Data
The aim of this study was to develop and validate an index that aggregates ACR SLE classification criteria and subcriteria9 into a unidimensional construct that could function as a measure of lupus severity. Construction of the severity model and testing of the resulting index was carried out using data extracted from a large cohort of patients with lupus enrolled in the Lupus Family Registry and Repository (LFRR) at the Oklahoma Medical Research Foundation. The LFRR was designed as a cross-sectional, collaborative research effort that recruits patients with SLE worldwide from both simplex and multiplex families as well as healthy controls primarily through referral from physicians, collaborators, the Centers for Medicare and Medicaid Services, and phone interviews as described previously.10 All cases within this population satisfied at least 4 of the 11 ACR criteria for classification of SLE.11 ,12 Medical records of these patients were obtained and clinical variables (ACR criteria/subcriteria, renal biopsy data, lab test results, prescription history) were abstracted by a formalised process.10 Subjects selected from this population for our study (n=1915) were those with documented evidence in the available medical records supporting the presence or absence of the ACR classification criteria (non-missing data). Subjects with a criterion score of 0 or 1 were recoded as 0, subjects with a score of 2 were recoded as missing and those with a score of 3 were recoded as 1, indicating presence of the criterion. Age of lupus onset was computed from medical records as the age at which the fourth documented ACR criterion was met. Demographic information (sex and race/ethnicity) was obtained via self-report. Both adult and childhood patients were included in this study; however, only 8.6% of the study group used in this research was less than 18 years. Mortality information was obtained via voluntary participant report (usually a close family member) often prompted by the LFRR yearly newsletter. This dataset was randomly split (by a 2:1 ratio) into two groups: a ‘training’ dataset (n=1277) for fitting the risk model and constructing the index, and a ‘validation’ dataset (n=638) for testing the resulting index.
Analytical approach for index development
Construction of LSI uses a statistical risk model and the index itself takes the form of a risk estimate. Due to their serious side effects, major immunosuppressive drugs tend to be prescribed only for cases with severe manifestations affecting major organs. As such, our risk model uses prescription history of major immunosuppressive drug use as a simple proxy for lupus severity. Major immunosuppressive drugs included in this definition were: cyclophosphamide, mycophenolate mofetil, rituximab and ciclosporin. Patients prescribed at least one of these medications were deemed as severe cases. The control group was defined as those with no prescription history of cyclophosphamide, mycophenolate mofetil, rituximab, ciclosporin or azathioprine. We acknowledge that subjects on high dose, long-term corticosteroid treatment might also be considered to have severe lupus. However, due to the cross-sectional nature of LFRR we were unable to accurately determine dose and duration of corticosteroid use for all subjects. Therefore, we did not include subjects in the study if they were on corticosteroids alone. The independent variables in the model were the ACR criteria and subcriteria. The model is a logistic regression with a quadratic penalty function (ie, L2-penalised logistic regression13), the equation for which is provided below: 1
1
In equation (1) above, pi is the probability that the ith patient has been prescribed major immunosuppressive drugs, given their observed ACR criteria/subcriteria. For a particular criterion/subcriterion denoted by j (say, haematological disorder), xj(i)=1 if the ith patient is positive for this manifestation, and 0 otherwise. The ‘training’ data (n=1277) described in the previous section was used to fit this model. Details on the model-fitting and estimation of the regression coefficients β are provided in the appendix. Once estimated, these coefficients are used as ‘item weightings’ for the severity index. The LSIs for patients in the ‘validation’ dataset (n=638) were computed using the following formula: 3
3
In equation (3) above, the numerator is an arbitrary factor used to control the range of possible values of LSI, for example, with a value of k=100, LSI is constrained to a range of (0, 100). In this study, we set k=10. Note that when k=1, the function in equation (3) reduces to the familiar logistic regression predicted probability, which is an estimate of P(y=1), the probability of major immunosuppressant prescription (ie, severe lupus). Higher values indicate a higher probability of severe lupus.
Note also that in this study, prescription history was used only for the construction of the index (via equation (1)) and once the estimates of the coefficients (β) were obtained, the computation of LSI (using equation (3)) for any individual requires only information on their ACR criteria/subcriteria.
Analytical approach for index validation
LSI in equation (3) was computed for all individuals in the validation dataset to provide an estimate of the likelihood of severe lupus, with higher values corresponding to more severe disease. The predictive accuracy of LSI was subsequently assessed in this dataset using history of major immunosuppressant prescription as a proxy for severity. Since the end point of interest is binary, the area under the receiver operating characteristic curve (AUC) was used as a measure of predictive accuracy.
In addition to AUC, other approaches were used to validate LSI. Age of lupus onset, race/ethnicity and sex are associated with lupus severity.14 We tested the association of LSI with each of these variables by non-parametric tests (Wilcoxon test for sex, Kruskal–Wallis test for age of onset and race/ethnicity). Mortality is another end point of lupus severity. We tested the association of LSI with mortality by a Cox proportional hazards model.
Lastly, we measured LSI's correlation with Katz SDI. The index is computed using seven components (haematocrit, creatine, number of ACR criteria met, history of proteinuria, cerebritis or pulmonary disease, diffuse proliferative glomerulonephritis). Each component is assigned 1 or 2 ‘points’ that are then summed with score ranges from 1 to 13. Full details of the computation are given in online supplementary table S1. When possible, we determined Katz SDI scores for individuals in the validation cohort and then used the Spearman's coefficient to estimate the correlation with LSI.
Supplementary tables
All computations were carried out in R V.3.1.0 (R Development Core Team. R: A language and environment for statistical computing. Vienna, Austria: R Foundation for Statistical Computing, 2014.).
Results
Summary statistics on the dataset used for the study were computed. The mean age of lupus onset was 35.9 (range: 5–80) years, with 8.6% below age 18 years, 77.8% from 18–50 years and 13.5% over age 50 years. Men constituted 10.6% of the sample. The percentages of European Americans, African Americans and others were 47.6%, 30.9% and 21.5%, respectively. Online supplementary tables S3.1 and S3.2 summarise the prevalence of each ACR criterion/subcriterion in our training and validation cohorts.
The estimates of the regression coefficients ( ) used to compute LSI (as outlined in equation (3)) are summarised below in figure 1A and online supplementary table S2. The coefficient estimate corresponding to each ACR criterion can be understood as a weighting of that criterion. The magnitude of the weight associated with a criterion is a reflection of the strength of its association with severity, while the sign (positive or negative) indicates the direction of the association. Positive weights imply a positive correlation with severity and negative weights imply a protective effect against severe disease. Few ACR criteria showed particularly strong associations with disease severity. Renal involvement had the highest impact, followed by seizures, haemolytic anaemia and immunological parameters. Pericarditis, pleurisy and psychosis had a small to moderate influence, whereas mucocutaneous involvement, arthritis, haematological criteria (excluding haemolytic anaemia) appeared to be neutral or protective.
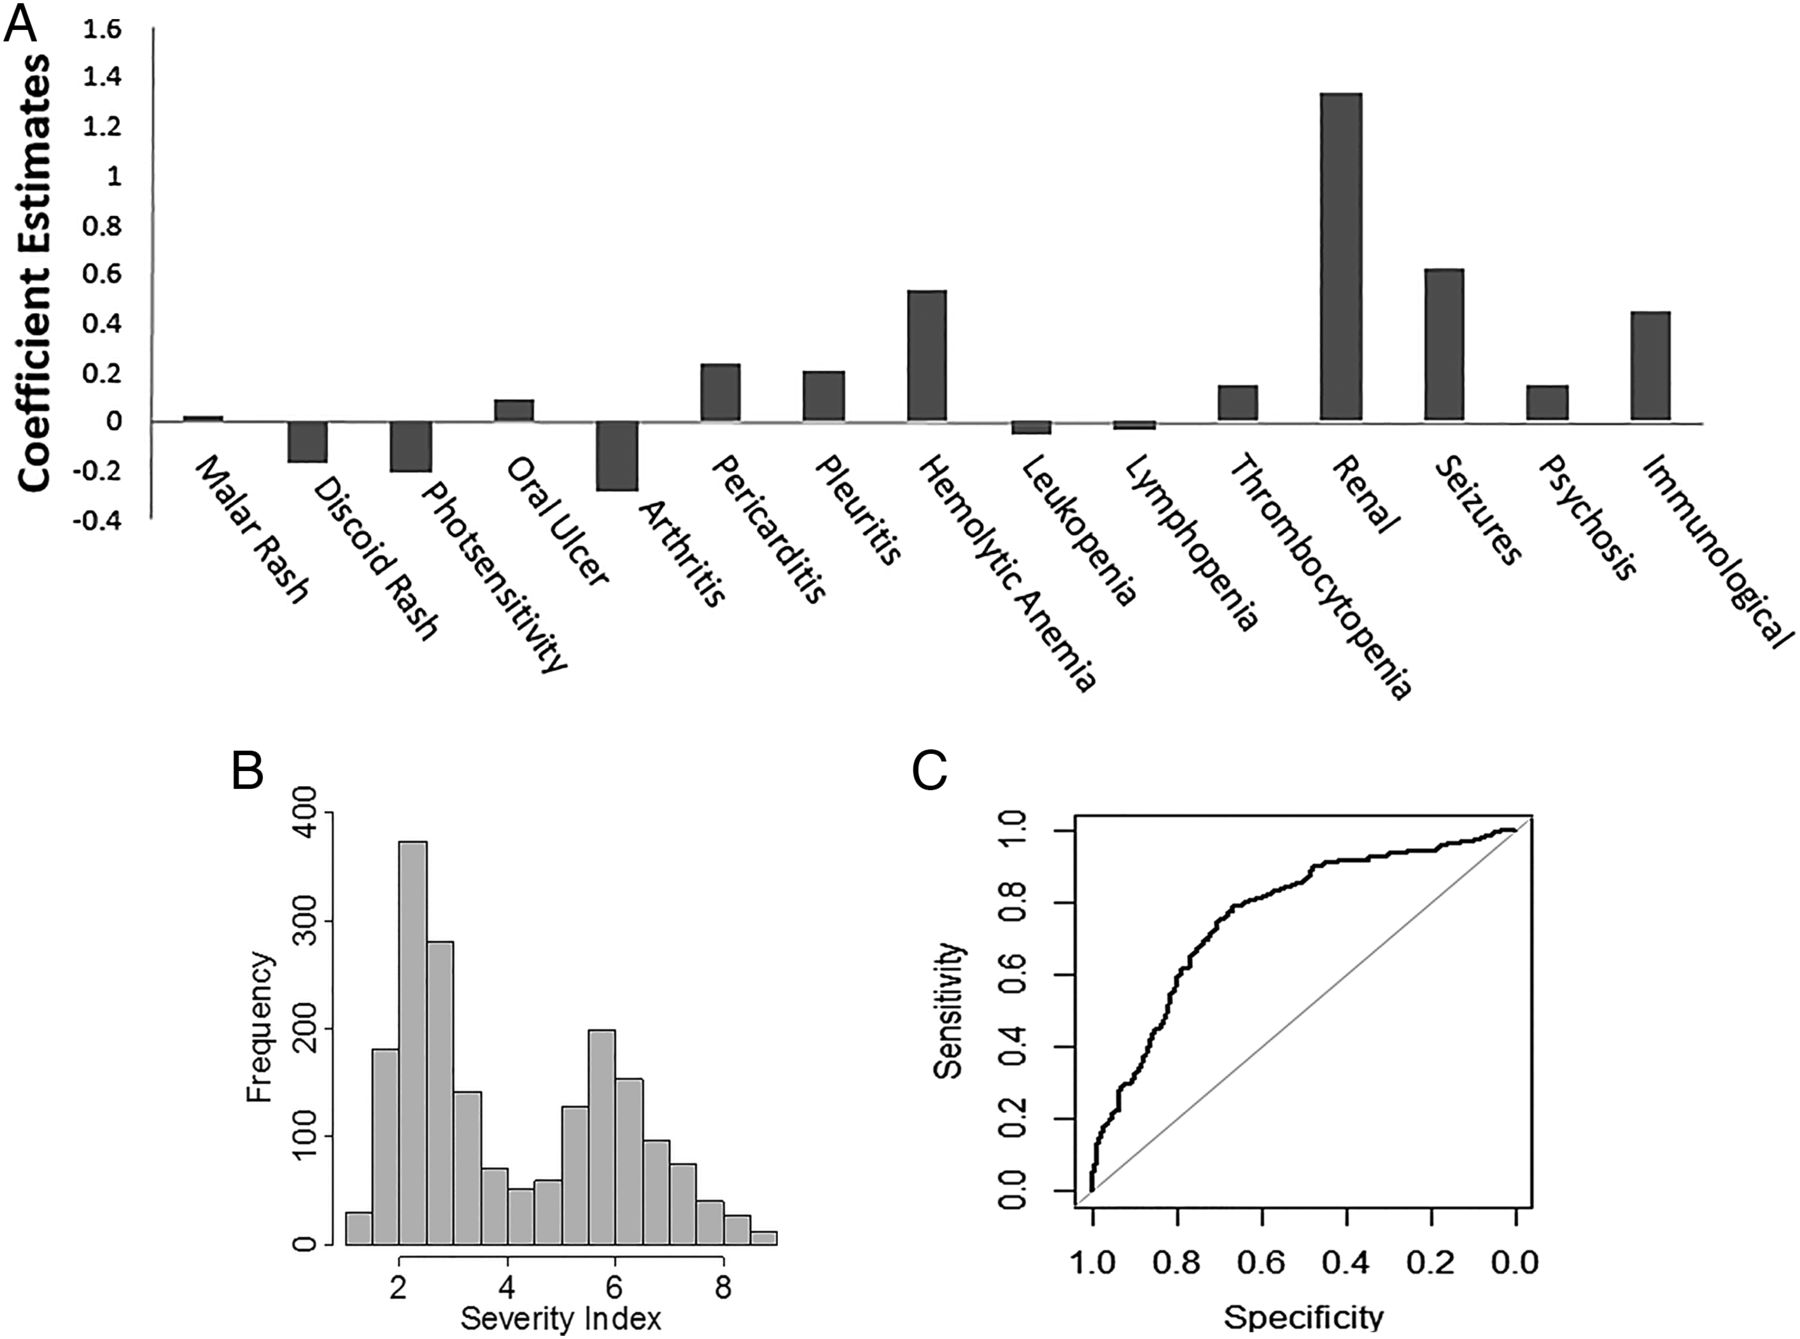
(A) Criteria/subcriteria weightings for Lupus Severity Index (LSI). (B) Distribution of LSI within the entire study population. (C) Receiver operating characteristic curve for LSI.
These estimates were used to compute the severity index via equation (3) (the multiplicative factor k is set to 10). Figure 1B above shows the distribution of LSI for the entire study sample. As discussed in the Methods section prescription history was used to measure LSI's predictive accuracy in the validation set. The area under the receiver operating characteristic curve was 0.81 (95% CI 0.775 to 0.845) (figure 1C).
Variation of LSI across demographic groups
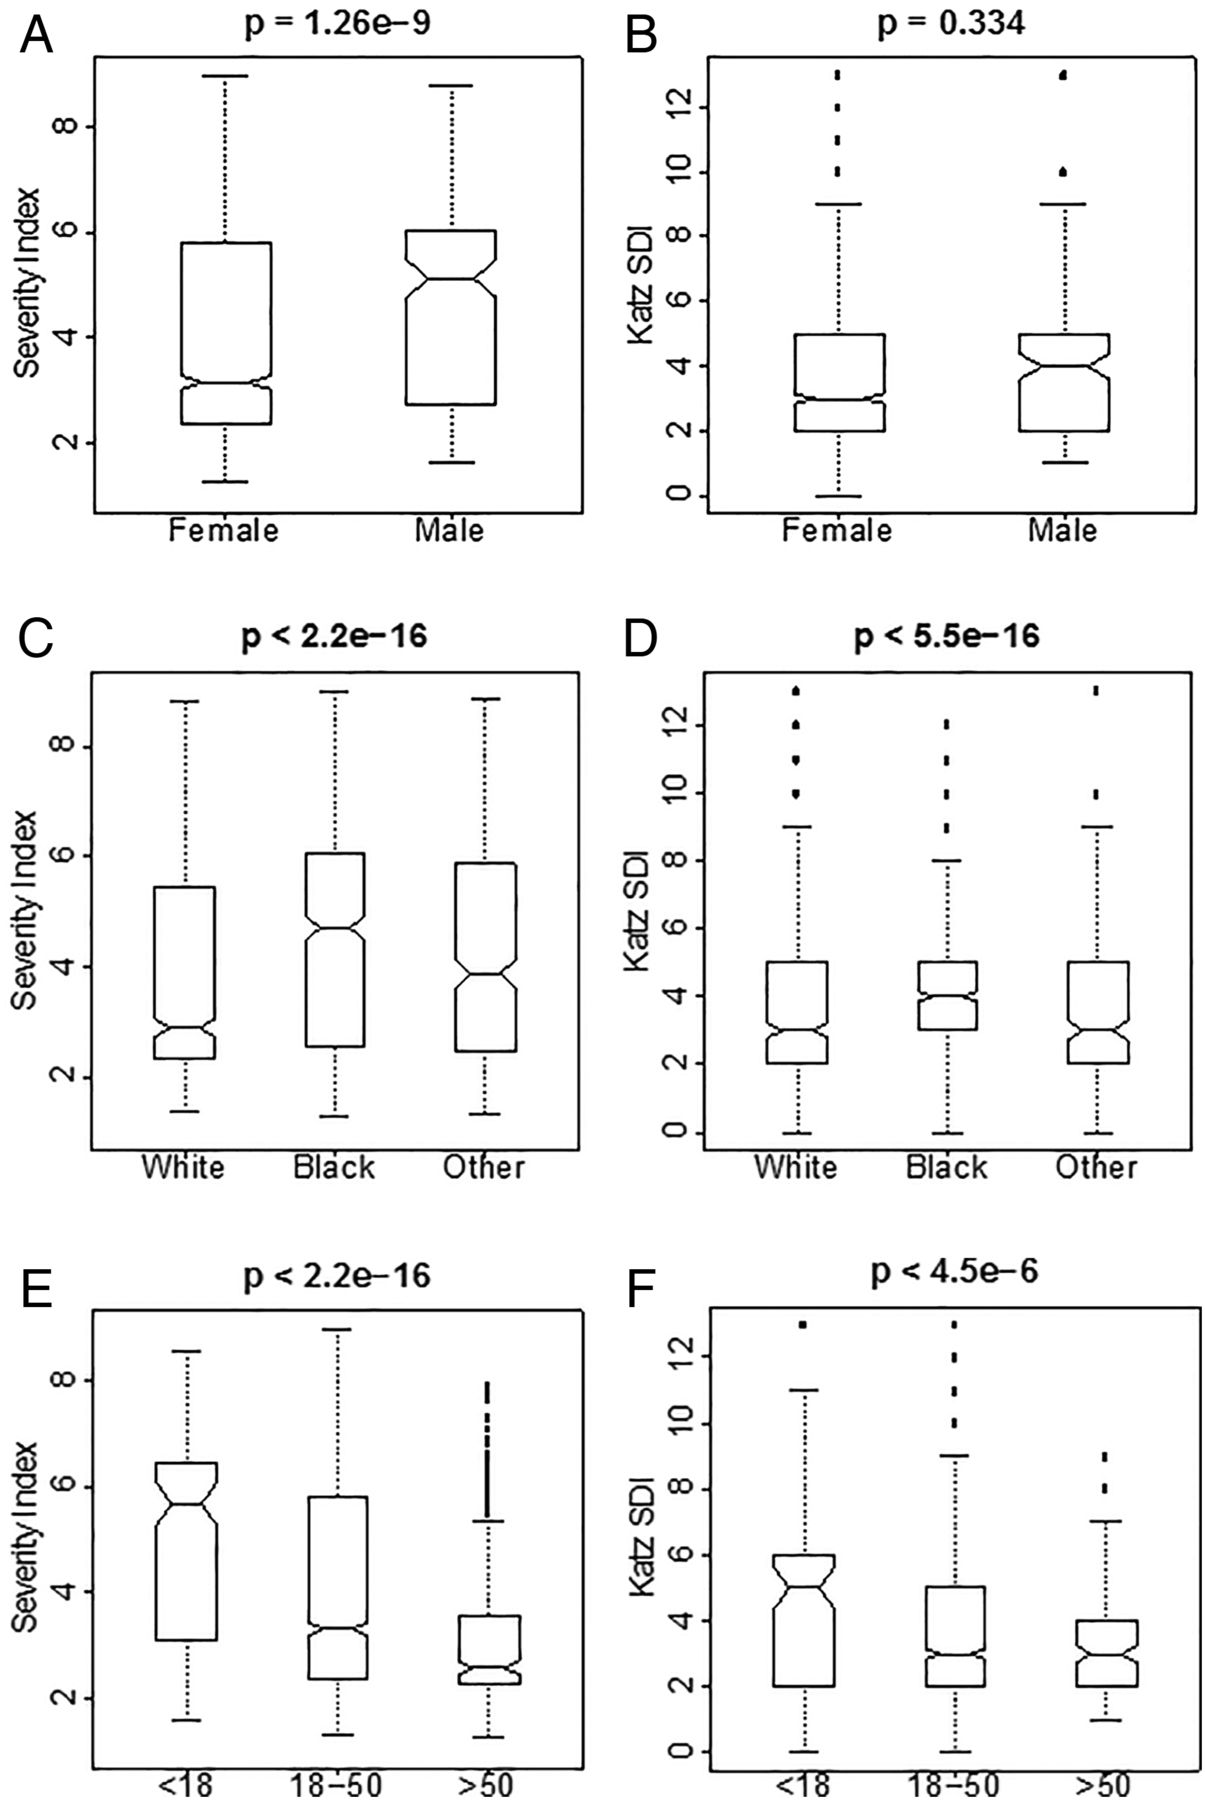
The distribution of LSI was computed (and compared) for sex, race/ethnicity and age of lupus onset. Figure 2A, C, E summarises the results. We observed significantly higher LSI values in men (p=1.3e−9) and individuals of African descent (compared with those of European descent and others (p<2.2e−16)). Also, we observed a statistically significant negative association between age of onset and LSI (p<2.2e−16).

(A and B) Distribution of Lupus Severity Index (LSI) and Katz Severity of Disease Index (SDI) across sex. (C and D) Distribution of LSI and Katz SDI across race/ethnicity. (E and F) Distribution of LSI and Katz SDI across age at disease onset.
Relationship with mortality
Within the validation set, there were 11 deaths due to lupus related causes reported by family members of the deceased over the 23 years of the study. Using a Cox proportional hazards model LSI was found to be significantly associated with mortality (p=0.015). Across both datasets there were 33 lupus related deaths. The mean LSI for deceased subjects was 5.7 (range 1.9–8.8) and the mean Katz SDI was 5.5 (range 2–9).
Correlation with the Katz Severity Index
Computation of Katz SDI is described in the Materials and Methods section. LSI strongly correlated (r=0.7) with this index. This positive correlation was found to be statistically significant, indicating that LSI demonstrates substantial concordance with Katz SDI. As mentioned in the introduction, LSI provides a more accessible alternative to Katz SDI when difficult to obtain clinical data such as haematocrit, proteinuria and creatine measures are unavailable.
Discussion
We have developed LSI, a simple severity index for SLE which requires only information on ACR criteria and subcriteria. This index demonstrates high predictive accuracy for severity anchored to major immunosuppressive drug use in an independent cohort, shows a strong association with mortality and exhibits certain distinctive trends that SLE severity is known to follow. For example, severity in lupus varies across demographic lines (gender, ethnicity and age of onset). Men tend to have more severe SLE that women,15 as do African Americans compared with other ethnicities.16 Additionally, severity appears to be inversely influenced by age, a relationship observed in multiple study cohorts. Paediatric SLE is characterised by a high degree of overall severity, while late-onset SLE (onset at age 50 years or higher) tends to be accompanied by milder manifestations.16 ,17 Collectively, these trends are also reflected by LSI.
We found LSI correlates strongly with Katz SDI, a validated instrument for assessment of lupus severity.1 The two indices have been derived from distinct sets of available predictors and neither was intended to be all inclusive of potential parameters contributing to disease severity. Haemolytic anaemia weighed moderately on LSI consistent with previous literature,18 nonetheless the effect of thrombocytopenia was neutral despite its prognostic role on morbidity and mortality in several other cohorts.19 The type of anaemia was not distinguished in Katz SDI and thrombocytopenia was not included. Notably both indices heavily weighed renal involvement, reflecting the well-known prognostic significance of nephritis in multiple lupus cohorts.2 ,20 Both indices are relatively easy to compute, although LSI may require software or a calculator since it uses an algebraic formula. Nonetheless, a few components in Katz SDI are less likely to be available in research datasets than are the ACR criteria and subcriteria, which are expected to be present since they are routinely used for lupus classification. Admittedly, the ACR criteria are not all-inclusive of SLE manifestations such as those found in subcutaneous lupus. However, our study was specifically aimed at investigation of systemic lupus. Most importantly, LSI is predictive of immunosuppressive therapy and mortality, indicating its potential future usefulness in clinical research, especially in trying to understand mechanisms and potential therapeutic targets for severe disease.
LSI does have disadvantages, one being its dependence on the quality of medical record data used for its scoring. Another potential difficulty with LSI, as well as other severity measures, is that it may change over time as patients can develop new manifestations of lupus in the course of their disease, and can satisfy additional ACR as time progresses. Also, the ACR criteria do not capture all possible systemic and neurological manifestations of SLE such as thyroid dysfunction, lupus hepatitis, organic brain syndrome and lupus headache. However, in our cohort which was collected from all over the USA over multiple decades and which includes medical record reviews by a number of different medical professionals, LSI still performed well. While the performance of LSI needs to be tested in additional cohorts, it has been shown here to be a useful, easy to use tool for stratification of patients in SLE research. By identifying those patients at risk of early mortality, major organ involvement and need for major immunosuppressive medications, we hope that LSI will facilitate further investigation into the genetic, serological and environmental contributors to severe SLE.
Appendix
Below we provide details on the fitting of the L2-penalised logistic regression model given in equation (1). The model is fit by maximising the penalised log-likelihood function given below: 2
2
In equation (2), L (β) is the standard log-likelihood function for logistic regression models. An L2 or ‘ridge’ penalty is imposed as a form of regularisation, and λ is a tuneable complexity parameter the optimal value of which is obtained via cross-validation. Maximising this log-likelihood function (subject to the specified quadratic constraints) produces estimates of the coefficients, which are used as ‘item weightings’ for the severity index.
References
Footnotes
Contributors Study design: CGM, Data analysis: GAB and MAB, Authorship and editing of manuscript: GAB, MAB, CGM, JAJ, AT and JAK.
Funding This research was supported by National Institutes of Health (GM110766, U54GM104938, P30GM103510, P30AR053483, U19A1082714 and U01AI101934).
Competing interests None declared.
Ethics approval Oklahoma Medical Research Foundation/University of Oklahoma Health Sciences Center Institutional Review Board.
Provenance and peer review Not commissioned; externally peer reviewed.
Data sharing statement No additional data are available.