Article Text

Abstract
Background Complement receptor 1 (CR1) plays an important role in immune complex clearance by opsonisation and possibly protects subjects from development of autoantibodies. Lower CR1 expression has been associated with susceptibility to systemic lupus erythematosus (SLE). In contrast, subjects displaying lower CR1 expression are protected against severe manifestations of falciparum malaria. This study is the first of its kind to investigate the association of CR1 variants with development of SLE in a P. falciparum endemic population from Odisha, India.
Methods CR1 polymorphisms (intron 27 (A>T), exon 22 (A>G) and exon 33 (G>C)) were typed by PCR and restriction length polymorphism in 297 cases of female patients with SLE and 300 age-matched and sex-matched healthy controls from malaria endemic areas in Odisha, India. CR1 expression on monocytes was quantified by flow cytometry.
Results The homozygous mutants of CR1 exon 22 (GG) and exon 33 (GG) and their minor alleles were associated with susceptibility to SLE. Furthermore, patients with SLE who harboured the GG genotype of the exon 33 polymorphism had a 3.12-fold higher chance of developing lupus nephritis. CR1 exon (22 and 33) variants were associated with lowered CR1 expression on monocytes in patients with SLE and in healthy controls. Patients with lupus nephritis showed significantly diminished CR1 expression than those without renal involvement (p=0.01).
Conclusions The results of the present study demonstrate that common CR1 exon variants are associated with diminished CR1 expression on monocytes and increased susceptibility to development of SLE and lupus nephritis in a malaria endemic area.
- Complement receptor 1
- Systemic Lupus Erythematosus
- Plasmodium falciparum malaria
- Gene Polymorphism
- Predisposition
This is an Open Access article distributed in accordance with the Creative Commons Attribution Non Commercial (CC BY-NC 4.0) license, which permits others to distribute, remix, adapt, build upon this work non-commercially, and license their derivative works on different terms, provided the original work is properly cited and the use is non-commercial. See: http://creativecommons.org/licenses/by-nc/4.0/
Statistics from Altmetric.com
- Complement receptor 1
- Systemic Lupus Erythematosus
- Plasmodium falciparum malaria
- Gene Polymorphism
- Predisposition
Introduction
Systemic lupus erythematosus (SLE) is an autoimmune disorder characterised by formation of autoantibodies, abnormalities in immune complex (IC) production, its clearance and deposition on various organ systems leading to tissue damage.1 CR1 facilitates binding, transport and endocytosis of IC bound to complements. Lower levels of CR1 have been associated with SLE2 ,3 and lupus nephritis (LN).4–6 Furthermore, functional CR1 polymorphisms which are believed to alter its expression on cells have been associated with increased susceptibility to SLE in different population.7 ,8
Deposition of IC on various tissues has been linked to pathogenesis of several diseases.9 In primates, erythrocytes bind to IC and facilitate its safe disposal by transporting it to Kupffer cells of the liver for phagocytosis.10 ,11 Complement receptor 1 (CR1, CD35, C3b/C4b receptor) is the key molecule on the surface of erythrocytes which mediate binding with complement proteins C1q, C4b, C3b and C3bi found in IC.12 CR1 is expressed on a wide range of cells viz. erythrocytes, eosinophils, monocytes, B lymphocytes, dendritic cells and kidney podocytes.13 ,14 Presence of CR1 in plasma and urine has also been reported.15 ,16
CR1 is a member of receptors for complement activation (RCA) located in the ‘cluster RCA’ region of chromosome 1 band 32.17 Several single nucleotide polymorphisms (SNPs) have been reported in both coding and non-coding regions of the CR1 gene (ID 1378), but limited number of SNPs have functional relevance. The association of three common SNPs (intron 27: rs11118133, exon 22: rs2274567 and exon 33: rs3811381) have been well investigated in Plasmodium falciparum malaria18 ,19 and autoimmune disorders20 ,21 since they are believed to be associated with CR1 expression. CR1 seems to play an important role in pathogenesis of P. falciparum malaria by facilitating rosetting, a phenomenon by which plasmodium infected red blood cells (RBCs) bind to uninfected RBCs.22 Rosetting is mediated by the parasite ligand Plasmodium falciparum erythrocyte membrane protein 1 on the surface of infected RBCs which binds to CR1 molecules.23 Subjects who express higher CR1 are believed to develop severe pathology such as cerebral malaria due to enhanced rosette formation leading to blockage of blood flow in brain capillaries.23 Association of CR1 variants (intron 27, exon 22 and exon 33) with severe P. falciparum malaria has been well characterised. In a recent case-control study and meta-analysis, we showed that the CR1 minor alleles associated with lower levels of expression of CR1 are associated with protection against severe Plasmodium falciparum malaria, and they are highly prevalent in malaria endemic areas.18 In a murine model, Plasmodium yoelli infection decreased CR1 expression on monocytes and hindered IC internalisation which recovered after the clearance of parasites.24 Furthermore, human subjects infected with P. falciparum or P. vivax also display lower CR1 expression on monocytes compared with uninfected individuals.24 Differential CR1 expression has been reported based on malarial endemicity.25 ,26 In view of the fact that in malaria endemic areas CR1 expression is reduced, and lowered CR1 expression is associated with improper clearance of IC, a feature observed in SLE, we hypothesised that this factor could predispose genetically susceptible subjects living in malaria endemic areas for development of SLE.
Materials and methods
Subjects
Patients with SLE admitted to the Department of Medicine, under the unit of Clinical Immunology and Rheumatology of SCB Medical College, Cuttack, Odisha, were enrolled in the present study. The diagnosis of SLE was based on revised American College of Rheumatology classification criteria.27 Since, SLE affects mostly women28 only female patients from coastal districts of Odisha (Cuttack, Puri, Anugul, Khurdha and Dhenkanal), endemic to P. falciparum infection,18 ,29 ,30 were included in the study. The average annual parasite index of malaria in these districts is 6.67.31 After a detailed clinical examination and laboratory investigations, patients were categorised into various clinical phenotypes. The clinical profiles of 297 patients with SLE are summarised in table 1. Three hundred age-matched, healthy female subjects from similar geographical areas (costal districts) were included as healthy controls (HCs). None of the controls reported history of autoimmune disorder or malaria. Both, patients with SLE and HCs were free of active P. falciparum infection as shown by immunochromatography test and P. falciparum-specific PCR.18 About 5 mL of blood was collected in EDTA tubes from each participant. The methods were carried out in accordance with approved guidelines. Informed consent was obtained from each patient and HC.
Clinical characteristics of patients with SLE and healthy controls
DNA isolation and genotyping of CR1 variants
Genomic DNA was isolated from whole blood by the GenElute Blood Genomic DNA Kit (SIGMA). As described earlier,32 samples were genotyped for the intron 27 HindIII A>T, exon 22 3650A>G and exon 33 5007 G>C genes by PCR-restriction length polymorphism (RFLP). For intron 27 and exon 22 the restriction fragment length polymorphism (RFLP) products were separated on 3.5% agarose and visualised by ethidium bromide staining under trans-UV illumination. To resolve restriction fragments of exon 33 polymorphism, 16% non-denaturing polyacrylamide gel was used. For quality control of genotyping results, about 25% of the randomly selected samples were directly sequenced for exon 22, exon 33 and about 15% were sequenced for intron 27 and the results were observed to be 100% concordant. Electropherograms of sequencing analysis are shown in online supplementary figure S1.
Supplementary figures
Quantification of CR1 expression on monocytes
CR1 expression on monocytes was determined by flow cytometry using two-colour fluorescence in 35 patients with SLE and 33 HCs. Briefly, 50 μL of whole blood were directly stained for 30 min at 4°C with phycoerythrin-labelled anti-CR1 (eBiosciences) and fluorescein-isothiocyanate labelled anti-CD14 (eBiosciences). Appropriate isotype controls (eBiosciences) were also used. Erythrocytes were lysed using fluorescence-activated cell sorting (FACS) lysis solution (BD Biosciences, USA) and the cells were washed with washing buffer followed by centrifugation at 300×g for 5 min. The cell pellet was then resuspended in 500 μL of sheath fluid and analysed by flow cytometry in FACS calibre using CellQuest Pro software.
Statistical analysis
The genotype and allele frequency were calculated by direct counting. Deviations from the Hardy-Weinberg equilibrium (HWE) were tested using the web-based site http://www.oege.org/software/hwe-mr-calc.shtml.33 Linkage disequilibrium (LD) between CR1 polymorphisms (intron 27, exon 22 and exon 33) were calculated by SNPAlyze software. Fisher's exact test was used for comparison of genotype, allele frequencies distribution among patients with SLE and HCs, and also among various clinical phenotypes. Ors and 95% CIs were calculated by Graphpad prism V.5.01. A p value <0.003 (Bonferroni correction for three markers 0.01/3=0.003) was considered statistically significant. Haplotype analysis was performed by the SNAPStats online tool and an LD plot was constructed in SNPAlyze software (Dynacom, Japan). Student's t-test was employed to compare the mean CR1 expression on monocytes in patients with SLE versus HCs and among patients with SLE with LN (LN+) versus those without kidney involvement (LN−). Association of CR1 genotypes (intron 27, exon 22 and exon 33) with CR1 expression on monocytes was analysed by analysis of variance followed by Tukey's post test and a p value <0.05 was considered statistically significant.
Results
Prevalence of CR1 polymorphisms in the studied population
Three hundred healthy women were genotyped for the CR1 polymorphisms intron 27, exon 22 and exon 33. As shown in table 2, and similar to our earlier observation,18 heterozygous and homozygous alleles were more frequent than major alleles (intron 27: AT=51%, TT=27%; exon 22: AG=41%, GG=44%; exon 33: CG=50%, GG=35%). Distributions of CR1 genotypes in HCs were in HWE (intron 27: χ2=0.25, p=0.61; exon 22: χ2=3.18, p=0.07; exon 33: χ2=0.45, p=0.50). The pairwise LD analysis of all the three loci showed that exon 22 (A>G) and exon 33 (G>C) were in LD with |D′|=0.93, r2=0.72, Akaike's information criterion (AIC)=509.02. The other combinations were not in LD in the studied population (for intron 27 (A>T) and exon 22 (A>G) pair: |D′|=0.79, r2=0.38, AIC=256.82; for intron 27 (A>T) and exon 33 (G>C) pair |D′|=0.72, r2=0.39, AIC=250.77).
Frequency of CR1 genotypes and alleles found among HCs and Indian patients with SLE
Further, we constructed LD plots for patients with SLE and HCs (see online supplementary figure S2). LD plots of codon 22 and codon 33 were similar in patients with SLE (D′=0.94) and HCs (D′=0.93). However, D′ values for intron 27 and codon 22 or between intron 27 and codon 33 were different in patients with SLE (intron 27-exon22: D′=0.74; intron 27-exon33: D′=0.63) and HCs (intron 27-exon22: D′=0.79; intron 27-exon33: D′=0.72).
Exon 22 and exon 33 polymorphisms are associated with susceptibility to SLE
We used a hospital based case control study to investigate the association between common polymorphism of the CR1 gene and SLE. Three functional CR1 polymorphisms (intron 27, exon 22 and exon 33) were typed in patients with SLE and HCs and results are shown in table 2.
For the CR1 exon 22 polymorphism, the frequency of the GG genotype and variant allele G were significantly higher in patients with SLE compared with HCs (GG: p<0.0001, OR=4.27; G: p<0.0001, OR=1.79). Similarly, distributions of homozygous allele (GG) and minor allele (G) for CR1 exon 33 polymorphism were more frequent in patients than controls (GG: p<0.0001, OR=3.82; G: p<0.0001, OR=2.11). Furthermore, both dominant and recessive genetic models revealed significant association of the CR1 codon (22 and 33) polymorphism with SLE (codon 22 (dominant model: p=0.00001, OR=3.66; recessive: p=0.001, OR=1.72); codon 33 (dominant model: p=0.001, OR=2.50; recessive: p=0.0001, OR=2.62). For CR1 intron 27, the genotype and allele distribution in patients with SLE and HCs were comparable.
Since codon 22 and codon 33 were associated with SLE, we further analysed haplotype association by the SNAPStat online tool and results are shown in table 3. The GG haplotype was more frequent in patients with SLE compared with HCs (p=0.0004, OR=1.94).
Haplotype analysis of CR1 codon polymorphism (22 and 33) in patients with SLE and HCs
CR1 expressions on monocytes are lower in SLE and in LN
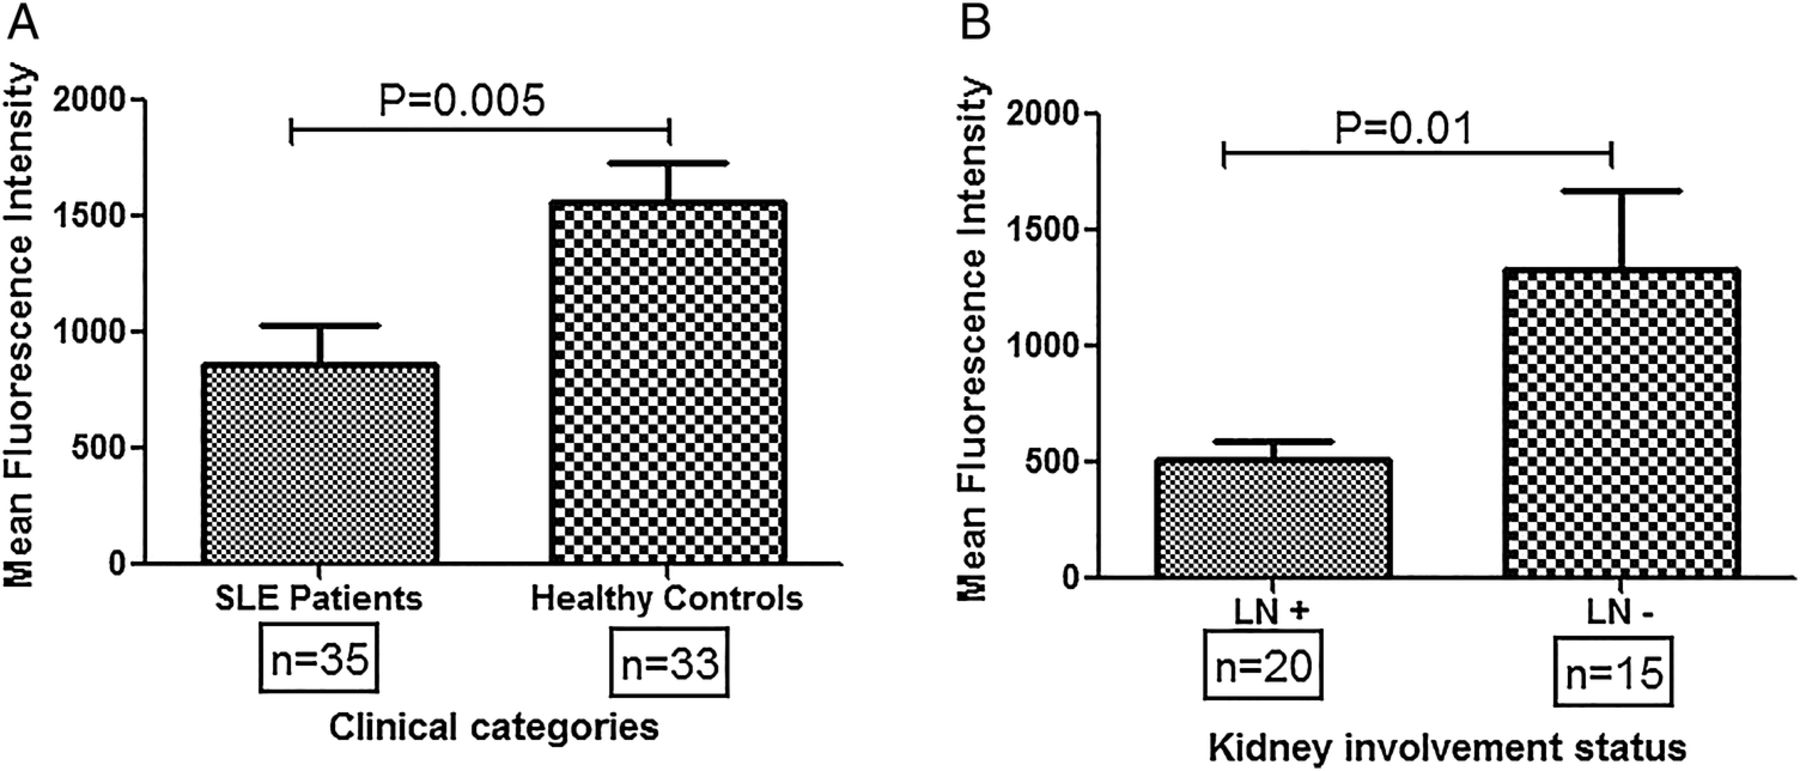
CR1 expression on monocytes was measured by flow cytometry in patients with SLE (n=35) and HCs (n=33). As shown in figure 1A, HCs displayed significantly higher levels of CR1 expression compared with patients with SLE (p=0.005). Patients with SLE were further categorised into two broad groups: (1) LN+, and (2) LN−. As shown in figure 1B, LN+ patients had lower CR1 expression on monocytes compared to LN- (p=0.01).

Differential CR1 expression on monocytes of patients with systemic lupus erythematosus (SLE) and healthy controls. (A) CR1 expression (mean fluorescence intensity, MFI) on monocytes was quantified by FACS in patients with SLE (n=35) and healthy controls (n=33). The mean MFI was compared by Student's t-test. Patients with SLE displayed significantly lowered CR1 levels on monocytes compared with healthy controls (p=0.005). (B) Patients with SLE were categorised into two broad groups, presence (n=20) or absence of kidney involvement (n=15) and mean CR1 expression was compared among them. Patients with LN showed significantly lowered CR1 expression on monocytes compared with those patients devoid of kidney involvement (p=0.01)". MFIs of CR1 on monocytes among different clinical categories were compared by Student's t-test. LN+, patients with SLE with lupus nephritis; LN−, patients with SLE without kidney involvement.
Association of polymorphisms with monocyte expression of CR1
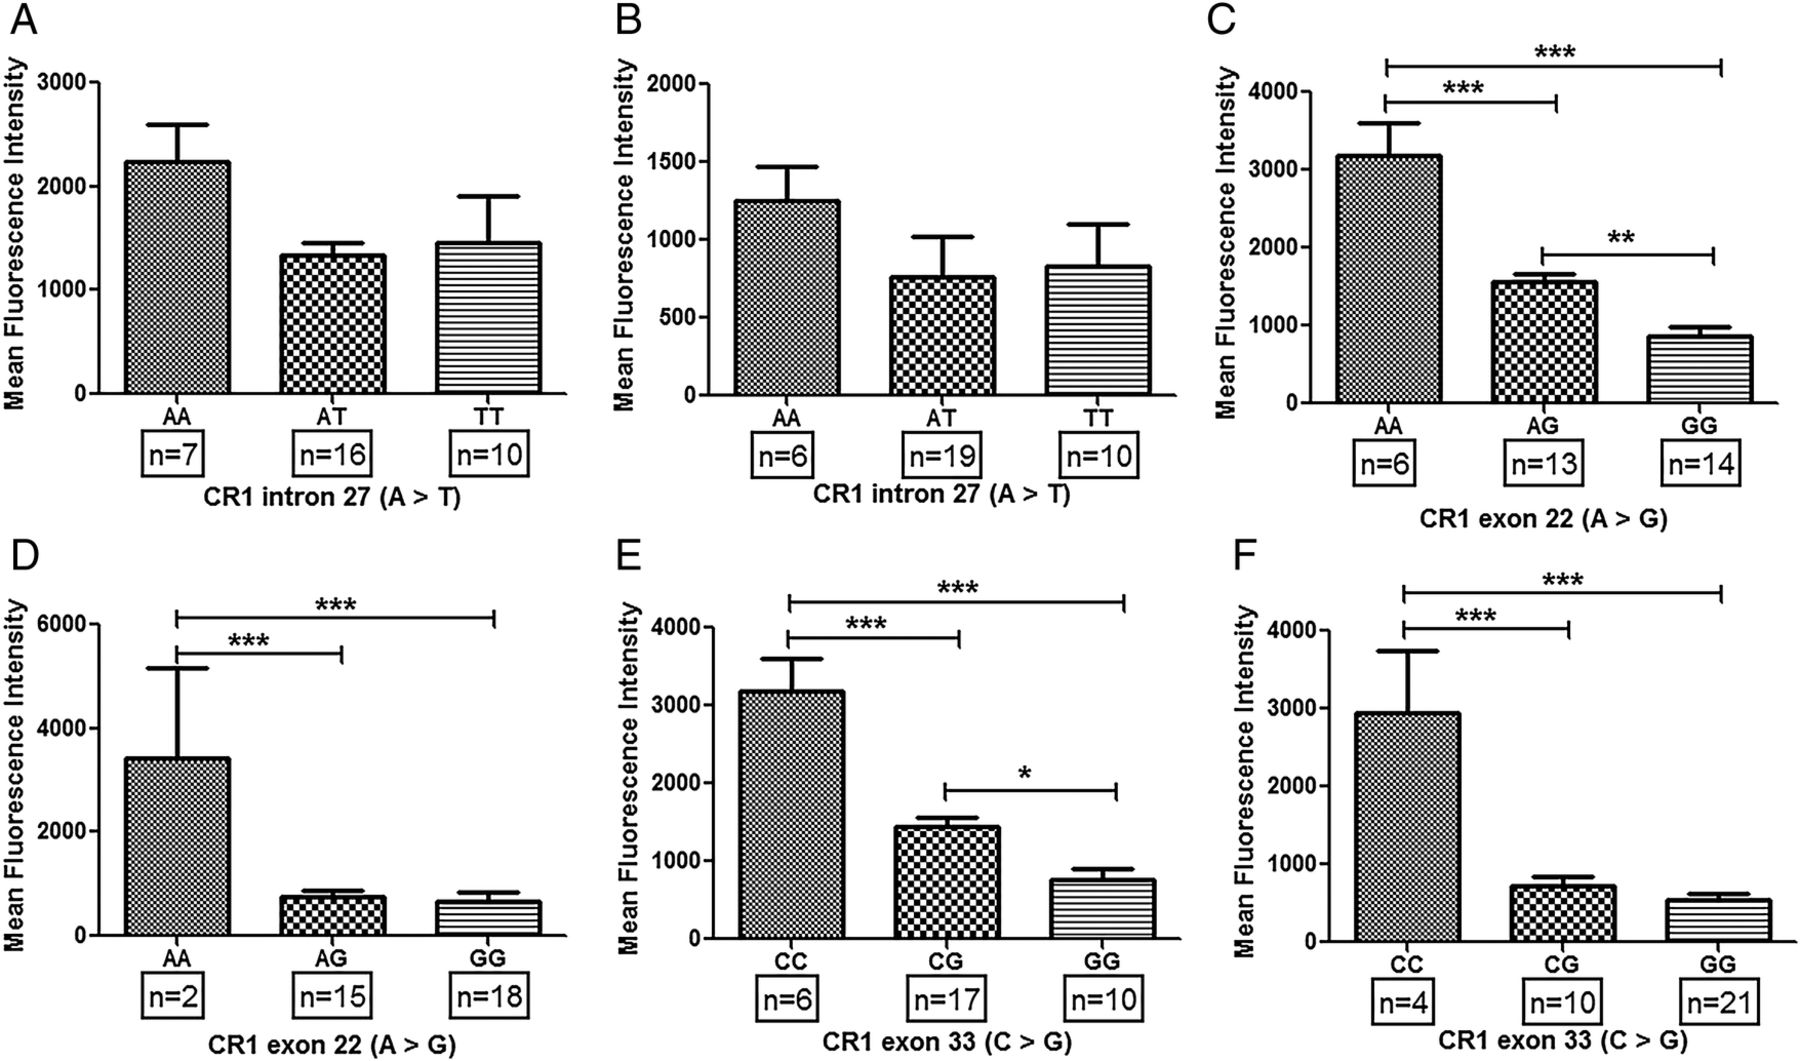
Association of common CR1 polymorphisms (intron 27, exon 22 and exon 33) with expression of CR1 on erythrocytes has been demonstrated earlier.19 ,25 ,26 ,32 ,34 ,35 We hypothesised that common CR1 polymorphisms may lead to its altered expression on monocytes which may be a possible trigger in the development of SLE. In patients with SLE, major alleles for exon 22 (AA) and exon 33 (CC) polymorphisms displayed significantly higher levels of CR1 on monocytes compared with their respective heterozygotes (exon 22: AG; exon 33: CG) and homozygous (GG) alleles (figure 2D, F). Furthermore, CR1 expression on monocytes of the CG genotype (exon 33) was observed to be higher than the homozygous mutants (GG). Such difference between heterozygous (AG) and homozygous minor alleles (GG) was not observed in CR1 exon 22 polymorphism (figure 2D, F). Expression of CR1 on monocytes of subjects with various genotypes of intron 27 polymorphisms was comparable (figure 2B). Interestingly, similar genotype-phenotype association results were also observed in HCs (figure 2A, C, E).

Association of CR1 polymorphisms and CR1 expression on monocytes in patients with systemic lupus erythematosus (SLE) and healthy controls. Expression of CR1 on monocytes was measured by flow cytometry. CR1 expression on monocytes was quantified in both healthy controls (A, C and D) and patients with SLE (B, D and E) correlated with their respective genotypes (A, B: intron 27; C, D: exon 22 and E, F: exon 33). Mean fluorescence intensity of CR1 on monocytes among various genotypes was compared by analysis of variance followed by Tukey's multiple comparison post test. p Value <0.05 was considered statistically significant (*p<0.05, **p<0.01, ***p<0.001).
Distribution of CR1 polymorphisms in LN
Patients with LN display lowered levels of CR1 on monocytes and its expression was associated with common CR1 variants (exon 22 and exon 33), We analysed for possible association of CR1 polymorphisms with susceptibility/resistance to LN. As depicted in table 4, the GG genotype of CR1 exon 33 polymorphism was more frequent in LN+ patients compared with LN− patients. However, the difference was not statistically significant (p=0.03, OR=3.12). Distributions of other polymorphisms (intron 27 and exon 22) in clinical phenotypes (LN+ vs LN−) were comparable (table 4).
CR1 polymorphisms distribution in patients with SLE with nephritis (LN+) and patients with SLE without nephritis (LN−)
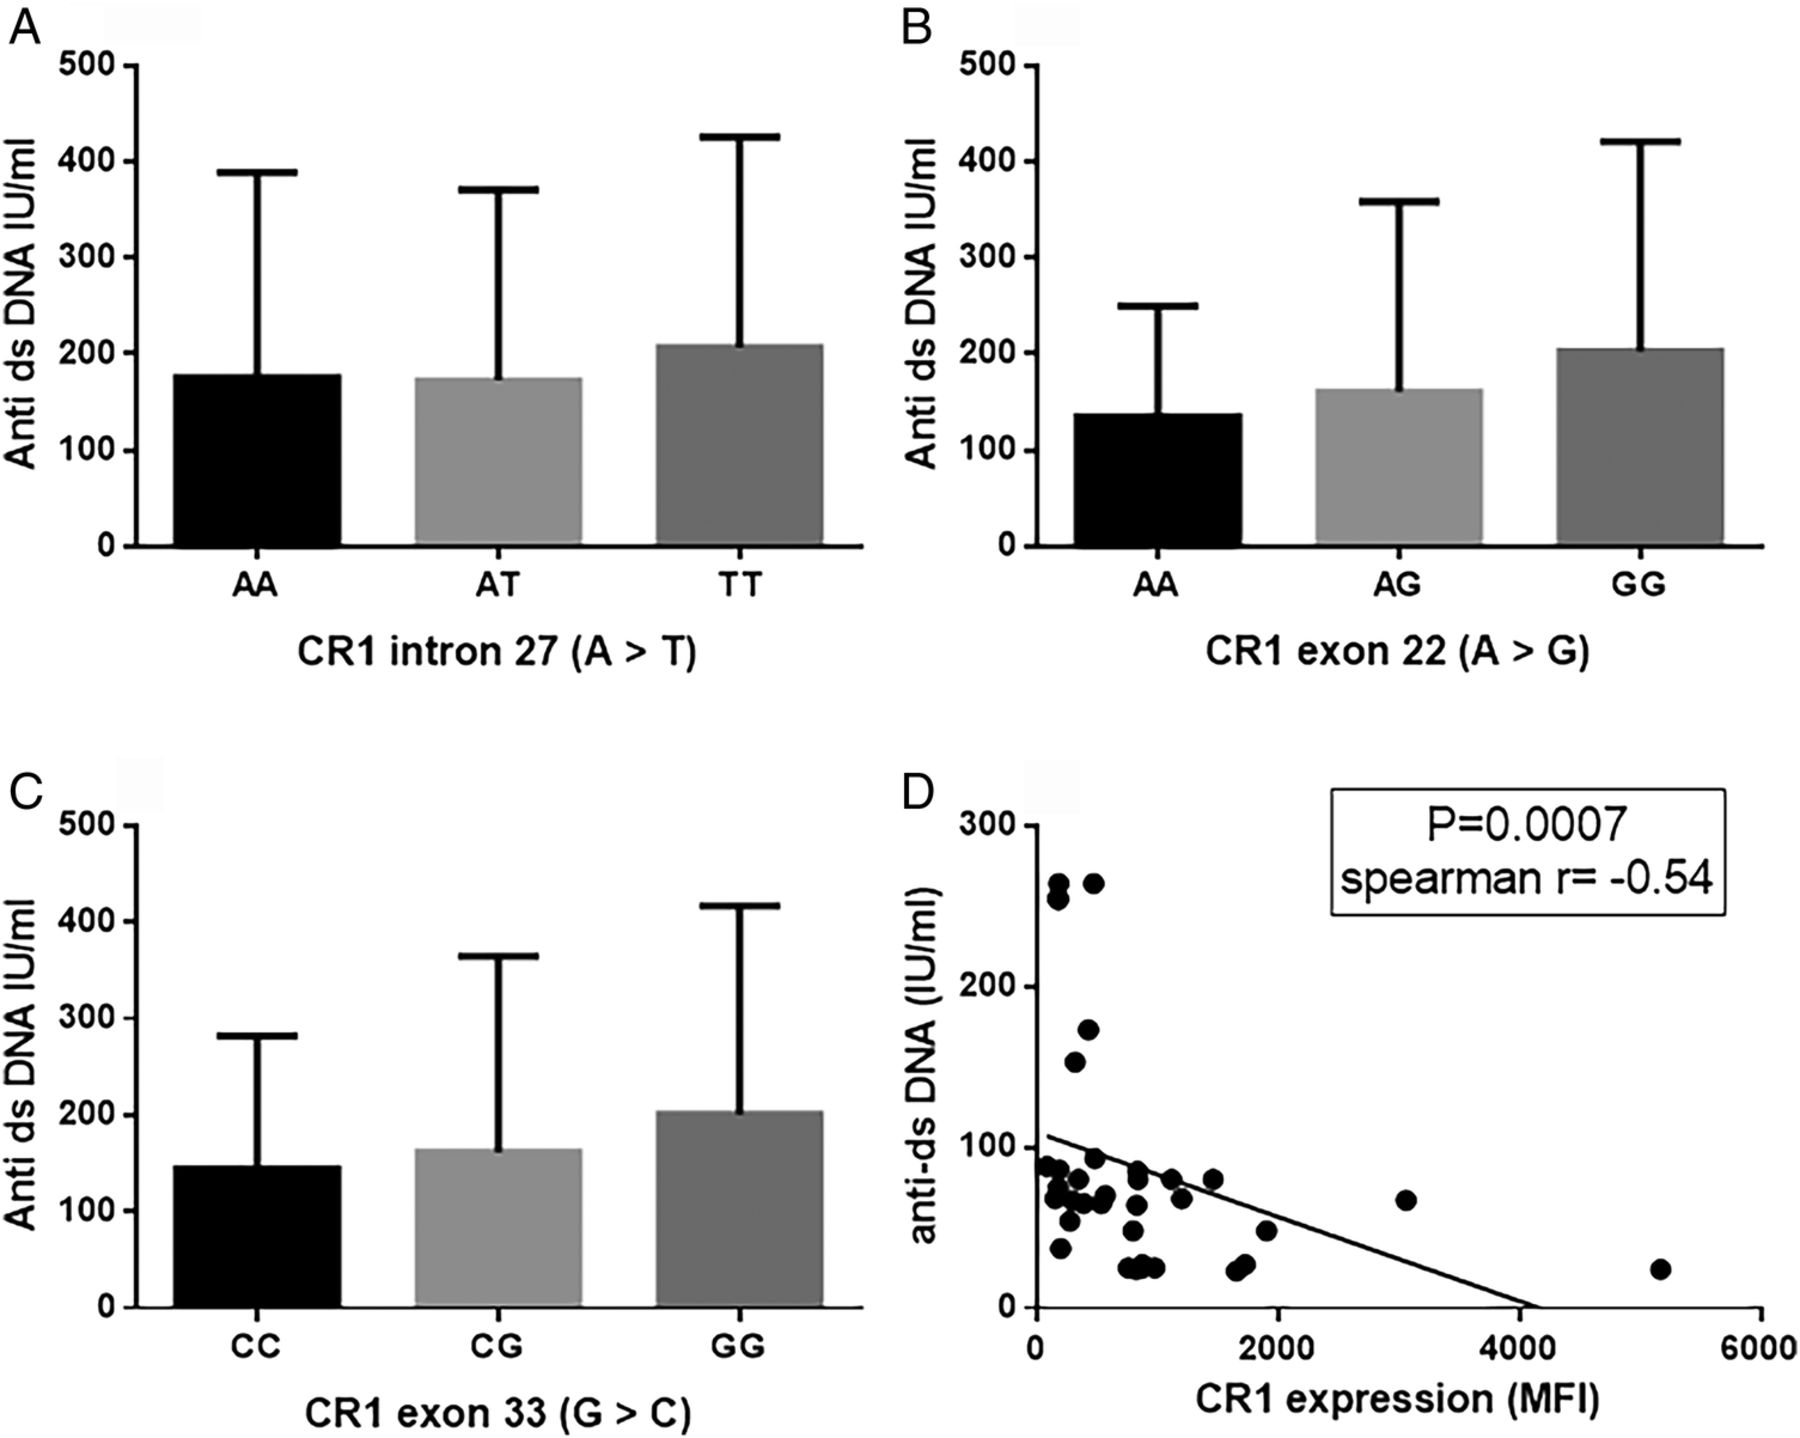
Association between CR1 expression and autoantibodies
Diminished CR1 expression is functionally associated with defective clearance of ICs which could be a possible trigger for autoantibody formation in SLE. We analysed the association between CR1 polymorphisms and levels of anti-dsDNA and the results are depicted in figure 3. The GG genotype of CR1 exon 22 and exon 33 polymorphisms displayed higher anti-dsDNA titres than their respective reference genotypes (exon 22: AA; exon 33: CC). However, the difference was not statistically significant. Anti-dsDNA titres were comparable among genotypes of the CR1 intron 27 polymorphism. Furthermore, we analysed correlation between CR1 expression on monocytes and levels of anti-dsDNA (figure 3). A negative correlation was observed between CR1 expression and anti-dsDNA (p=0.0007, Spearman's r=−0.54), suggesting a possible role of CR1 in facilitating increased production of anti-ds DNA.
Association between CR1 expression and anti-dsDNA. Plasma levels of anti-dsDNA was compared in different genotypes of CR1 polymorphisms (A: intron 27; B: exon 22 and C: exon 33). Anti-dsDNA levels were compared by analysis of variance and Tukey's post test. No statistically significant association was observed. (D) Correlation between CR1 expression and plasma levels of anti-dsDNA was compared by Spearman's rank correlation test and a significant negative correlation was observed. MFI, mean fluorescence intensity.
Discussion
The present study investigates, for the first time, an association between CR1 common variants with possible development of SLE in genetically susceptible individuals residing in areas endemic for P. falciparum malaria. It demonstrates that CR1 variants (exon 22 and 33 polymorphisms) are significantly associated with patients with SLE and the exon 33 polymorphism is associated with LN. CR1 exon polymorphisms (22 and 33) are also significantly associated with reduced CR1 expression on monocytes, and patients with SLE display lower CR1 expression on monocytes compared with HCs. Interestingly, LN+ patients had lower CR1 levels compared with LN− patients.
SNPs have been reported in the CR1 gene.32 However, studies indicating their association with SLE susceptibility are limited. Most studies were focused on CR1 HindIII intron 27 polymorphism and the results were contradictory. A recent meta-analysis reported absence of association between the CR1 intron 27 polymorphism and SLE.20 Our observations were similar with regard to the CR1 intron 27 variant. However, exon 22 and exon 33 polymorphisms showed significant association with SLE. Homozygous and minor alleles were more prevalent in patients with SLE compared with HCs, indicating that subjects with the GG genotype of exon 22 and exon 33 have 4.27-fold and 3.82-fold higher associations with SLE. Furthermore, CR1 exon 33 homozygous (GG) alleles were more frequent in LN+ patients compared with LN− patients. CR1 exon polymorphisms (22 and 33) were associated with CR1 expression on monocytes: homozygous (GG) alleles displayed lower levels of CR1 compared with their respective major alleles. The mechanism(s) related to reduced expression of CR1 in codon variants (22 and 33) is not known. It is possibly associated with formation of defective CR1 proteins that are quickly degraded resulting in lower expression on the cell surface. To the best of our knowledge, this is the first study to investigate an association between CR1 exon polymorphisms (22 and 33) with SLE in malaria endemic areas. However, there are several factors responsible for the development of SLE and mutation in the CR1 gene could be one among them.
CR1 expression on erythrocytes has been reported to be low in patients with SLE3 and grossly reduced in LN+ patients.4–6 In the present study, we observed diminished CR1 expression on monocytes of patients with SLE compared with HCs. Comparison of CR1 expression on different clinical manifestations revealed significantly lower levels of CR1 on monocytes in LN+ patients compared with LN− patients. The relationship between CR1 and clearance of IC has already been indicated earlier. Reduced expression provides a basis for increased circulating IC that has the potential to facilitate development of autoantibodies in SLE. Lower CR1 expression has been associated with improper IC clearance in mice models.24 Furthermore, CR1 expression was found to be inversely correlated with IC deposition in the kidney24 increasing the possibility of renal damage.
The current study also corroborates our earlier observation18 on CR1 polymorphisms in malaria endemic areas. Mutants of CR1 exon 22 and intron 27 were more prevalent in the studied population compared with their respective major alleles (exon 22: AG+GG=85%; intron 27: AT+TT=78%). The present study also revealed a higher prevalence of the CR1 exon 33 variant (CG+GG=85%) among the same population. A higher prevalence of the CR1 intron 27 minor allele has been reported in various malaria endemic areas viz., Thailand34 and India19 ,25 while in non-endemic areas, their frequency has also been found to be significantly low.26 ,36 The other CR1 variant (exon 22) also showed a similar pattern: higher frequency of variants in endemic populations like Papua New Guinea,26 Thailand,34 India19 ,25 and lower prevalence in non-endemic areas.25 ,26 Similarly, the minor allele of the exon 33 polymorphism is more frequent in malaria endemic than non-endemic areas.26 The occurrence of a higher frequency of CR1 minor alleles in malaria endemic areas has been attributed to their protective function against severe P. falciparum malaria and its mortality.18 ,26 The association between SLE and CR1 variants in these areas has not been studied earlier.
The area in the current study is endemic to P. falciparum malaria. Earlier, we had reported a protective association between of CR1 variants (for mutations in exon 22) against severe P. falciparum malaria and mortality.18 We had proposed that higher prevalence of CR1 variants in malaria endemic areas could have been a result of selection pressure.18 Our current observation of increased prevalence of CR1 mutations (possibly selected out by malaria) in patients with SLE suggests an interesting possibility that malaria could be a contributing factor in the development of SLE in genetically susceptible individuals in malaria endemic regions of the world. The prevalence of SLE has been reported to be threefold to fourfold higher in African-Americans compared with Caucasians,37 and they are the people who have migrated from the malaria endemic regions of Africa. Validation of the observations reported in this study, in regions of high endemicity for P. falciparum infection, could provide novel insights into the natural history of SLE.
Conclusions
The results of the present study demonstrate that common CR1 exon variants are associated with diminished CR1 expression on monocytes and possibility of increased susceptibility to development of SLE and LN in malaria endemic areas.
Acknowledgments
The authors thank the patients and controls who participated in the study. The authors also thank Ratnadeep Mukherjee, Birendra Prusty and Harishankar Mahto for their immense help in flow cytometry, PCR and sequencing.
References
Footnotes
Contributors AKP was involved in the design, performing experiments, analysis, interpretation, statistics and writing the first draft of the manuscript. BKD and BR contributed to the design, data interpretation, work supervision and critical revision of the manuscript. All authors read and approved the manuscript.
Funding The Institute of Life Sciences is supported by the Department of Biotechnology, Government of India. AKP is supported by DST-INSPIRE Faculty grant (IFA12/LSBM-46) from the Department of Science and Technology, Government of India.
Competing interests None declared.
Patient consent Obtained.
Ethics approval Institutional Human Ethics Committee of S C B Medical College Cuttack.
Provenance and peer review Not commissioned; externally peer reviewed.
Data sharing statement No additional data are available.