Article Text

Statistics from Altmetric.com
Introduction
The clinical scenario of a febrile, acutely ill, immunocompromised patient with immunocompromised lupus remains challenging despite advances in technology and improved understanding of pathogenic mechanisms. Infection is a major contributor to morbidity and mortality in systemic lupus erythematosus (SLE); infection-related hospitalisation rates range from 10% to 35%1–4 and mortality rates range from 29% to 53%.5 ,6 The disease itself and most treatment strategies are immunosuppressive, rendering patients with SLE more susceptible to severe infection with common organisms and opportunistic pathogens. Both infection and lupus flare can incite clinically indistinguishable inflammatory responses. Consequently, appropriate therapy may be delayed or patients are treated for both conditions while awaiting results of time-consuming investigations for bacterial and viral infections. The potential consequences of treating infection with immunosuppression are obvious and may contribute to the high mortality rates. Antibiotics given unnecessarily also have potential toxicities. A biomarker that would accurately and rapidly differentiate between flare and infection would provide an extremely valuable guide to more directed, precise therapy, likely leading to significantly decreased morbidity and mortality.
Microarray technology offers an unbiased, systems biology approach to study the expression level of thousands of genes simultaneously and genome-wide transcriptional studies have emerged as a powerful investigational tool to study complex diseases as well as infection.7 The objective of this exploratory study was to use whole blood gene expression profiling to identify specific RNA expression profiles that would differentiate systemic inflammation related to SLE disease flare from infection in acutely ill patients with lupus. We hypothesised that the molecular signature associated with active disease and no infection in patients with SLE will differ from the molecular signature in patients with SLE with infection. Comparison groups consisted of SLE subjects with inactive disease and healthy controls.
Methods
Study design
Blood samples for microarray analysis were obtained from two groups of SLE subjects (acutely ill SLE, inactive SLE) and healthy controls matched for age, gender and ethnicity. Blood samples in the acutely ill SLE group were obtained prior to any changes in therapy and these subjects were followed through the course of their illness to determine a final outcome of disease flare, infection or both based on clinically indicated serological tests, cultures and imaging studies.
Subjects
SLE subjects were recruited randomly from three sites; the North Shore University Hospital in Manhasset, New York, St. Luke's Medical Center in Quezon City, Philippines, and the Instituto Nacional de Ciencias Medicas y Nutricion in Mexico City, Mexico. All SLE subjects were aged ≥18 years and fulfilled the American College of Rheumatology revised criteria for SLE.8 All subjects in the acutely ill SLE group were recruited from SLE subjects presenting to the hospital with acute illness. Specific signs and symptoms of acute illness were not specified as there is potential infinite diversity of signs and symptoms in patients with SLE with an acute change in clinical status warranting emergency evaluation in a hospital setting. Inclusion criteria for the acutely ill SLE group required that (1) subjects have signs and symptoms of acute illness at the time of presentation to the hospital, (2) blood samples for the microarray analyses were collected prior to any pharmacological intervention for the acute illness, (3) there was no known history of chronic infection with hepatitis B or C or HIV, and (4) the final clinical determination for the acute illness was infection, disease flare or both. SLE subjects that were acutely ill for reasons other than infection or disease flare (eg, thrombosis, malignancy, cardiovascular events) were excluded from the study. Patients with SLE with inactive disease (inactive SLE), defined as a Safety of Estrogens in Lupus Erythematosus National Assessment Systemic Lupus Erythematosus Disease Activity Index (SELENA-SLEDAI)9–11 score ≤2 (exclusive of serology) with stable doses of medications for ≥3 months and a maximum prednisone dose of 10 mg per day, were recruited randomly from the outpatient setting. The ‘inactive SLE’ subjects were recruited specifically to have little to no clinical disease activity in contrast to the ‘acutely ill’ SLE group who had signs and symptoms of acute illness; the ‘inactive SLE’ group was allowed to have abnormal complement and anti-DNA as it is recognised that serologies do not necessarily reflect disease activity in all patients.12 Patients with SLE with inactive disease were excluded if they had prior or current evidence of co-infection with hepatitis B, hepatitis C or HIV. Healthy control subjects (HC) were recruited by asking for volunteers from friends of patients with SLE and they were matched to the acutely ill SLE group for gender, age and ethnicity.
Sample collection, RNA extraction and processing
Peripheral blood, 3 mL, was collected directly into Tempus RNA tubes, and frozen and stored at −20°C. Frozen samples from Mexico City and Quezon were batched and sent to the Feinstein Institute for Medical Research for RNA extraction and processing. RNA was extracted with the Tempus Spin RNA Isolation Kit (Ambion) according to the manufacturer's instructions and assessed for integrity and quantity using the Bioanalyzer (Agilent) and NanoDrop (NanoDrop Technologies). Total RNA, 50–200 ngs, was processed using the TotalPrep RNA Labeling Kit (Ambion) that has been optimised for use with Illumina's whole-genome expression platform. The RNA amplification process uses a streamlined protocol developed in the laboratory of James Eberwine.13 The procedure consists of reverse transcription with an oligo(dT) primer bearing a T7 promoter using a reverse transcriptase (ArrayScript), that catalyses the synthesis of virtually full-length cDNA. The cDNA then undergoes second strand synthesis and a clean-up step and is used as a template for in vitro transcription (IVT) (MEGAscript) with T7 RNA polymerase. Biotinylated-UTP is used in the IVT step to generate hundreds to thousands of biotinylated antisense RNA copies of each mRNA in a sample. The cRNA is subjected to a clean-up step, quantitated, labelled, hybridised to an Illumina microarray chip, stained and scanned.
Clinical assessments
Acutely ill SLE subjects were assessed with the SELENA-SLEDAI9–11 at the time of the first blood draw, prior to therapeutic intervention. Clinical information including physical examinations, laboratory results, imaging studies and medications, was collected throughout the hospitalisation and used to determine the final outcomes of lupus flare and/or infection. Choice of laboratory investigations and imaging was dictated by the clinical presentation and the expertise of the treating physicians; specific testing, other than obtaining blood samples for the microarray analysis, was not specified for this study. For inactive SLE subjects and HCs, whole blood was collected as above; disease activity and medications were recorded for the inactive SLE subjects.
End points
Study end points for the acutely ill SLE subjects included:
Infection: This was determined by positive culture results, antiviral antibody titres or PCR data as indicated. All patients with positive results for infection were included in this group even if they were also assessed as having a disease flare since there is no objective ‘gold standard’ biomarker for disease flare.
Lupus flare: There is no gold standard for determination of flare; acutely ill SLE subjects without evidence of infection or other reason for acute illness were grouped in the flare group. Investigators also indicated their assessment of flare based on clinical expertise and a definition of flare similar to that proposed by the Lupus Foundation of America: ‘A flare is a measurable increase in disease activity in one or more organ systems involving new or worse clinical signs and symptoms and/or laboratory measurements. It must be considered clinically significant by the assessor and usually there would be at least consideration of a change or an increase in treatment’.14
Statistical considerations
Clinical data
Comparisons between groups for clinical characteristics were determined using non-parametrical Mann-Whitney, Kruskal-Wallis and χ2 analyses as indicated.
Microarray data
Raw data from the Illumina chips were exported from the software Genome Studio and analysed using the R programming language and a variety of R/Bioconductor packages. Background correction, variance stabilisation transformation and quantile normalisation were performed through the Bioconductor package ‘lumi’.15 A threshold p value of 0.01 was used for probe detection, and only probes that were expressed in at least one sample were retained. This resulted in 29619 probes. Probe annotation was performed via ‘lumiHumanAll.db’ (http://bioconductor.org/biocLite.R) and for parts of the analysis only probes that had a known gene symbol were used (20887 probes, corresponding to 15167 unique gene symbols). Differential expression analysis was done using the R/Bioconductor package; ‘limma’.16 Gene expression results were subsequently analysed using published data for interferon α (IFNα)-inducible genes from Baechler et al17 and first generation and second generation modular transcriptional repertoire analyses developed by Chaussabel et al.18 ,19 Welsh's two-sample t-test was used to analyse friend leukaemia virus insertion site 1 (Fli-1) expression in lupus nephritis (LN).
Receiver operating characteristic (ROC) curves and the associated area under the curves (AUCs) are used to evaluate the ability of a diagnostic test to distinguish between clinical states; we used them to assess the predictive value(s) of genes identified in the differential expression analysis to distinguish disease flare from infection. A logistic regression analysis was used to determine the predictive value of a composite measure of differentiating genes to distinguish infection from disease flare.
Results
Clinical data
Twenty-seven acutely ill SLE subjects were recruited. Determinations of outcomes for these acutely ill SLE subjects were; 16 with infection and 11 with disease flare. Infections included Mycobacterium tuberculosis (n=4), Mycobacterium bovis (n=1), Candida albicans urinary tract infection (n=1), H1N1 (n=1), influenza (n=1), Escherichia coli urinary tract infection (n=3), cellulitis (n=1), viral meningitis (n=1), Streptococcus pneumoniae (n=1), Mycoplasma pneumoniae (n=1) and E coli sepsis with pulmonary infiltrates (n=1). Sixteen inactive SLE subjects and 20 HCs, matched for gender, age and race with the acutely ill SLE group, were enrolled. The HC group was all female with a mean age of 32.15±8.92 and racial backgrounds similar to the acutely ill SLE cohort (data not shown).
Four SLE subjects with documented infection were also categorised as having a disease flare by the investigator; SLEDAI scores for these four subjects were 24 (vasculitis, arthritis, rash, oral ulcers, pleuritis, low platelets and white blood cells, low complement, high DNA), 20 (haematuria, pyuria, proteinuria, renal casts, low complement, high DNA), 11 (arthritis, pleuritis, low platelets, low complement, high DNA) and 5 (fever, low complement, high DNA). Differential gene expression analyses showed no differences between this group of four with evidence of both infection and clinical flare and the SLE infection group. In contrast, there were significant differences in gene expression between the SLE flare group and the group with both infection and flare except for two genes; IFFI44L and myosin light chain 5 (MYL5) (see below; online supplementary figure S1). Based on these data, and because disease flare manifestations are subjective and may be difficult to determine in the context of infection, these four subjects were included in the infection group for further analyses.
Supplementary figures
Comparison of the SLE flare and infection groups demonstrated few clinical differences except for lower C3 levels and higher SLEDAI scores in SLE flare and a higher frequency of fever at presentation in SLE infection (table 1). There was a non-significant trend towards a higher frequency of disease modifying drug use in the infection group (68.8% vs 36.4%; p=0.096). As expected, the inactive SLE subjects had significantly lower current prednisone doses and SLEDAI scores and had normal complement levels compared with the acutely ill SLE group. Interestingly, anti-dsDNA antibody titres did not distinguish between the inactive disease and acutely ill groups; high serum titres were found in 88.9%, 85.7% and 62.5% of the SLE flare, SLE infection and inactive SLE groups, respectively. The frequency of SELENA-SLEDAI descriptors in the acutely ill SLE group stratified by outcome, disease flare or infection, is given in table 2. The SLE flare group had significantly fewer subjects with fever and more subjects with renal disease compared with SLE infection. On day 1, 63.6% of the flare group received treatment with increased doses of corticosteroids, 9.1% were treated with antibiotics and 36% received increased immunosuppressive therapy. Comparatively, 43.8% of the infection group received initial treatment with increased doses of corticosteroids, 75% received antibiotic therapy and none received increased immunosuppressive therapy. Four patients with infection were not treated with antibiotics on day 1.
Subject clinical characteristics
Frequency of Safety of Estrogens in Lupus Erythematosus National Assessment Systemic Lupus Erythematosus Disease Activity Index (SELENA-SLEDAI) descriptors in the acutely ill SLE group stratified by outcome, disease flare or infection
Microarray data
Differential expression analysis
Differential expression analysis with Benjamin-Hochberg multiple testing correction yielded eight genes that differentiated the SLE flare and SLE infection groups (table 3). Seven of these are upregulated in SLE flare and two of these, IFIT1 and IFI44L, are IFN-inducible. Fli-1 has been implicated in LN due to its effects on renal expression of chemokines and recruitment of inflammatory cells;20 seven of the SLE subjects (six in the SLE flare group and one in the SLE infection group) had new or recurrent LN and these subjects all demonstrated increased expression of Fli-1 compared with SLE subjects without active LN (p=0.022, see online supplementary figure S2). MYL5 is the only differentiating gene significantly upregulated in SLE infection. ROC curves were generated for each gene to assess individual predictive values for distinguishing flare from infection (figure 1). Each ROC curve has a value for AUC that summarises the overall accuracy of each gene as a diagnostic parameter. While the AUC values for the differentiating genes are all in the moderate to high accuracy range, they are highest for chromosome X open reading frame 21 (CXorf21) (0.93), FLI-1 (0.91), IFIT1 (0.0.88) and MYL5 (0.86), indicating excellent predictive values of these genes for differentiating disease flare from infection. Logistic regression using these four genes provides perfect prediction of membership in the SLE flare or SLE infection group.
Genes distinguishing SLE flare from SLE infection; results of differential expression analysis following Benjami-Hochberg multiple testing comparison

Receiver operating characteristic (ROC) curves and associated area under the curve (AUC). ROC curves were generated to assess the ability of the eight genes identified by differential expression analysis that differentiate systemic lupus erythematosus (SLE) flare from infection. The ROC curves plot sensitivity (true positive rate) on the y axis against 1−specificity (false positive rate) on the x axis; the upper left hand corner of the graph corresponds to perfect prediction, that is, where sensitivity=1 and specificity=1. The AUC summarises the overall accuracy of each gene to predict the outcome. Two of the genes, CXorf21 and FLi-1, have AUCs in the highly accurate range (>0.9) and the rest fall in the moderate range (>0.7 to 0.9).
If significant genes (unadjusted p value of 0.05 and a fold change of >1.5) are considered without the stringent multiple testing corrections, a larger list of 84 distinguishing genes was identified (see online supplementary table S1); 60 with increased expression in flare and 24 with increased expression in infection. Of the 60 genes upregulated in SLE flare, 36 (60%) are IFN-inducible genes listed by Baechler et al.20 In contrast, none of the 24 genes preferentially upregulated in SLE infection are IFN-inducible and three (CD177, CD64, SIGLEC14) are associated with a neutrophil signal for bacterial infection.21–23
Supplementary table
Modular analyses
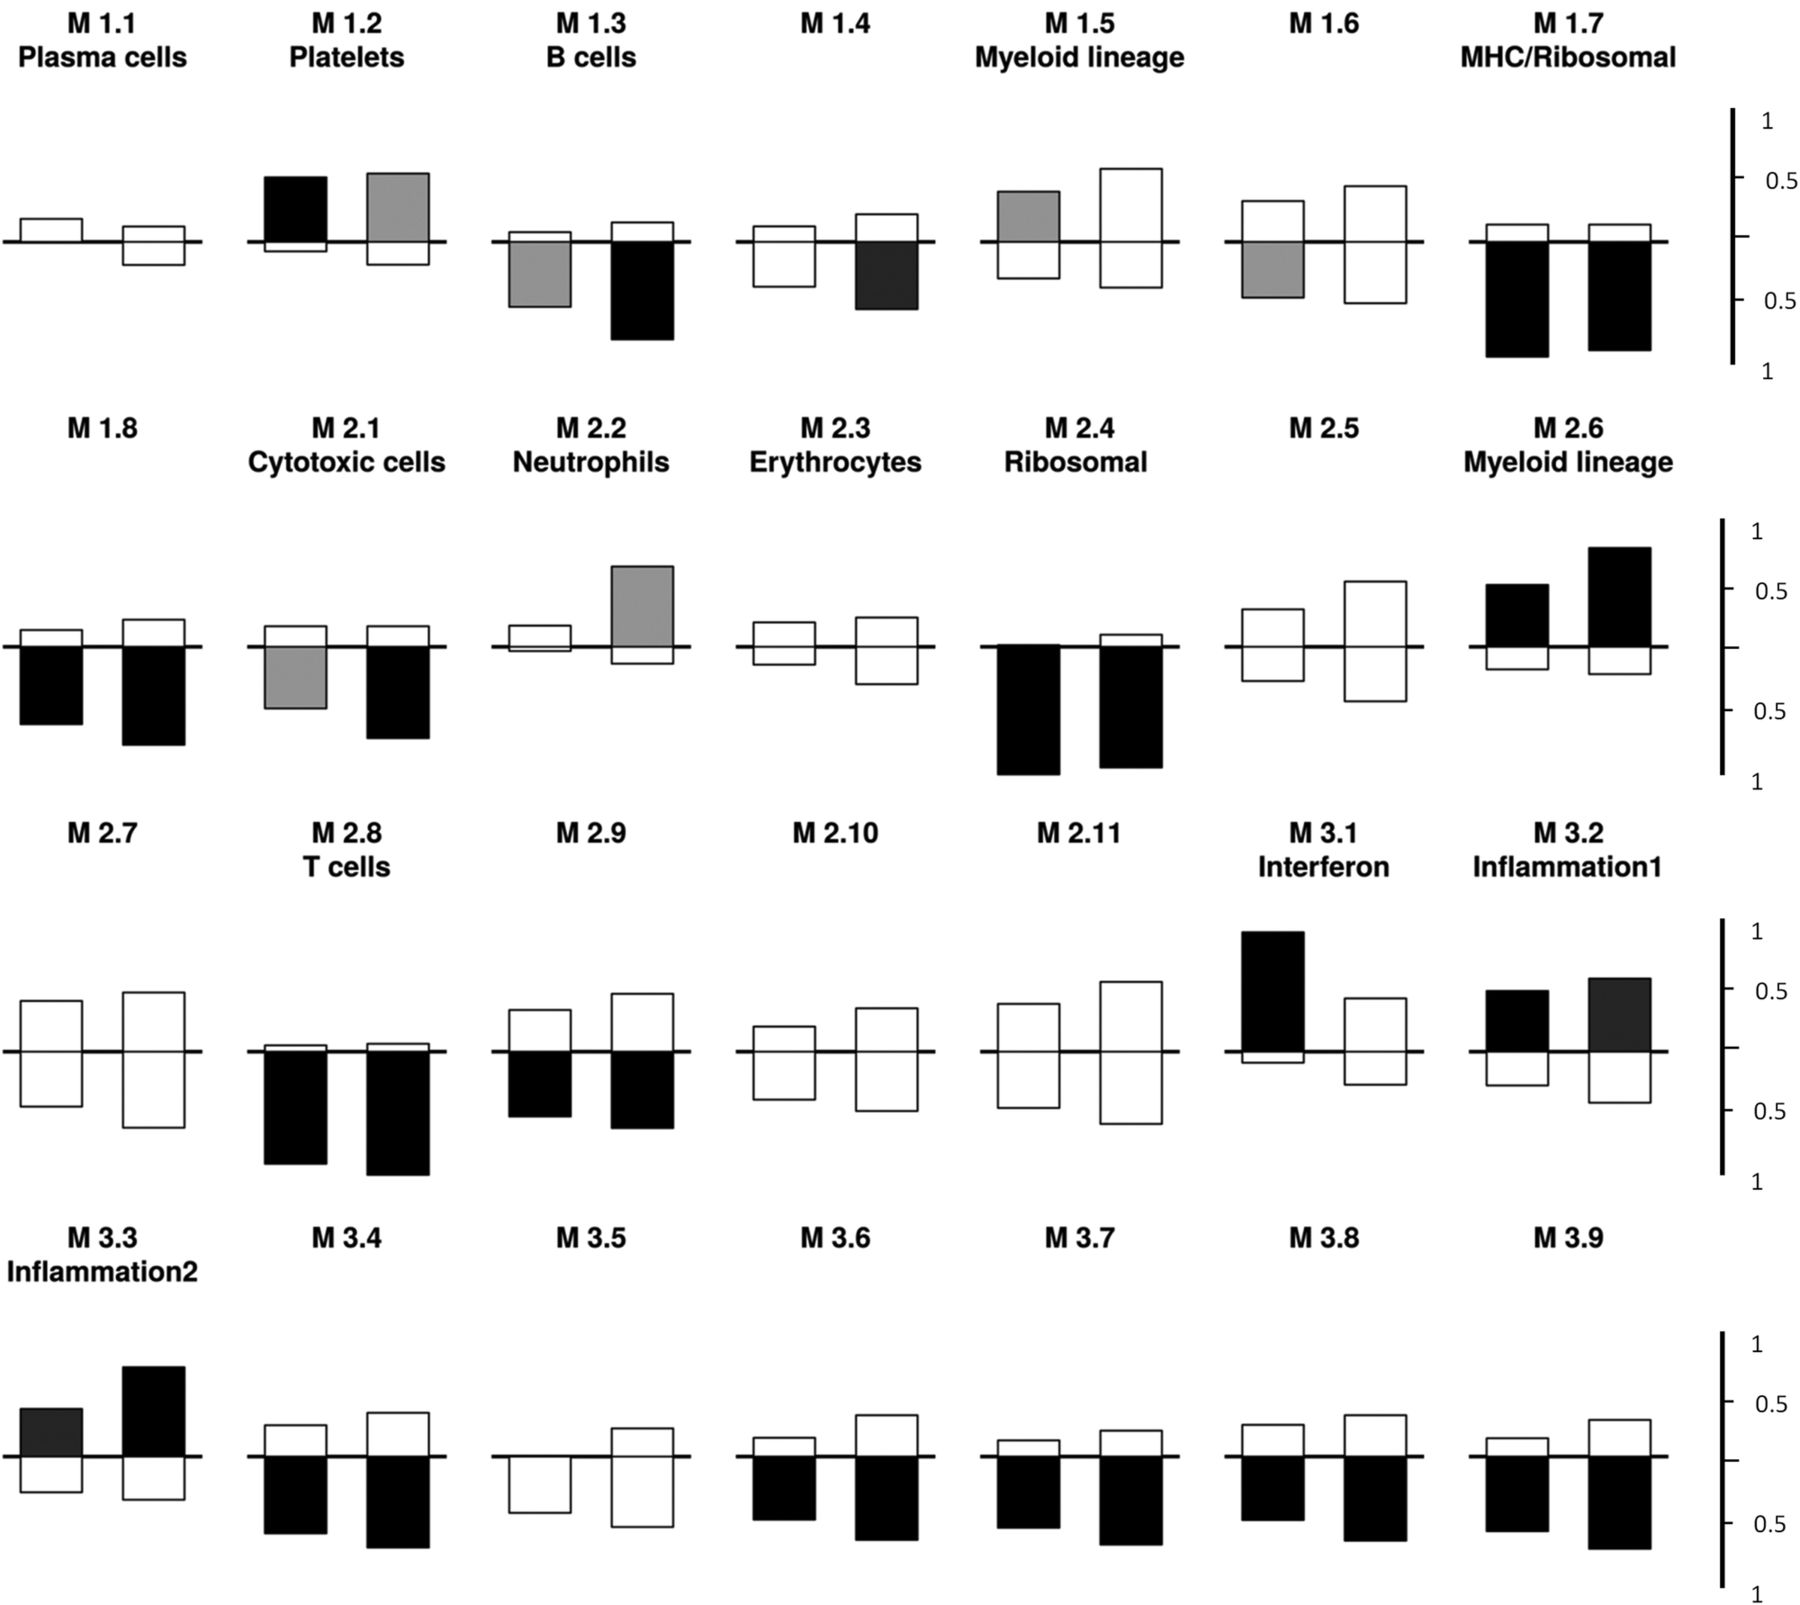
As reported by Chaussabel et al, and others, modular analysis of gene expression can be useful in identifying characteristic changes among disease groups.18 ,19 ,24 In order to explore whether modules can be useful in distinguishing between infection and SLE flare, we chose to compare the modular patterns in these two patient groups with baseline patterns observed in inactive SLE. As shown in figure 2, there was some evidence of significant upregulation of the IFN-inducible module (M 3.1) in the SLE flare group compared with inactive SLE but not in SLE infection compared with inactive SLE. Not surprisingly, both SLE flare and SLE infection were distinguished from inactive SLE by increased gene expression in the myeloid (M2.6), inflammation 1 (M3.2) and inflammation 2 (M3.3) modules (p=0.0005). Overall there was not a striking difference in the pattern of modular changes between SLE flare or SLE infection compared with inactive SLE. Direct comparison demonstrated increased gene expression in SLE flare in two modules compared with SLE infection; the IFN-inducible (M3.1, p=.005) and plasma cell modules (M1.1, p=0.005) (data not shown). However, the lack of differences in plasma cell module gene expression in SLE flare or SLE infection compared with inactive SLE (figure 2), challenges the significance of the findings in the direct comparison between SLE flare and SLE infection. It is, however, possible that all SLE has a signature and that some aspects of that signature are diminished during infection.

First-generation modular analysis of acutely ill systemic lupus erythematosus (SLE) (flare or infection) versus inactive SLE. The modules are numbered; each contains 22–325 gene probes and is described in terms of the known functions of the transcripts as reported by Chaussabel et al.18 Under each module group, the bar on the left represents gene expression in SLE flare compared with quiescent SLE and the bar on the right represents gene expression in SLE infection compared with inactive SLE. A indicated by tick marks on the right, bars above the horizontal line indicate fractional increased expression and bars below represent decreased expression of transcript within each module. Bar colour codes for significance: black indicates p=0.0005, dark grey indicates p=0.005, light grey indicates p=0.05 and white indicates a non-significant p value. Compared with inactive SLE, both SLE flare and infection upregulate genes in modules M1.2, 2.6, 3.2 and downregulate genes in modules 1.3, 1.7, 1.8, 2.1, 2.4, 2.8 and 2.9. The interferon module (M 3.1) is more significantly increased in SLE flare compared with inactive SLE than SLE infection.
Analysis of IFN-related modules
To further explore whether IFN-inducible gene expression can differentiate disease flare from infection, the microarray raw data were applied to a recently published ‘second generation’ modular transcriptional repertoire that identified three separate IFN modules with distinct activation thresholds. These modules exhibit an ordered appearance such that expression in module 1.2 (M1.2) precedes expression in M3.4, which in turn precedes expression in M 5.12.19 Using our data set, an expression score was calculated for each patient for each of these second-generation IFN modules. The expression score represents the per cent difference between upregulated and downregulated probes, in this case compared with the average of all healthy controls for that module. As expected, compared with normal controls, 100% of SLE flare demonstrated significantly increased expression in all three of these IFN modules and none of the IFN-related genes were downregulated in this group. Increased gene expression in modules M1.2 and M3.4 was present in 81% of SLE infection and 75% of inactive SLE. Increased gene expression in M5.12 was present in 88% of SLE infection compared with 25% of inactive SLE. These data support the previously reported observation of a coordinated gradient of IFN gene expression that associates with disease activity.19 Using a groupwise fractional analysis of genes expressed in each of the modules, there was some evidence that overall the probes in each of these IFN modules were more highly expressed in the SLE flare group compared with the SLE infection group. Thus, 89% of all probes in M1.2, 38% of all probes in M3.4 and 32% of all probes in M5.12 are more highly expressed (p<0.05 uncorrected, data not shown) in the SLE flare group than the SLE infection group. However, these differences are modest in comparison to the overall increase in these modules compared with healthy controls, and they are not a robust measure for distinguishing between the flare and infection groups.
IFN-inducible genes and the IFN score
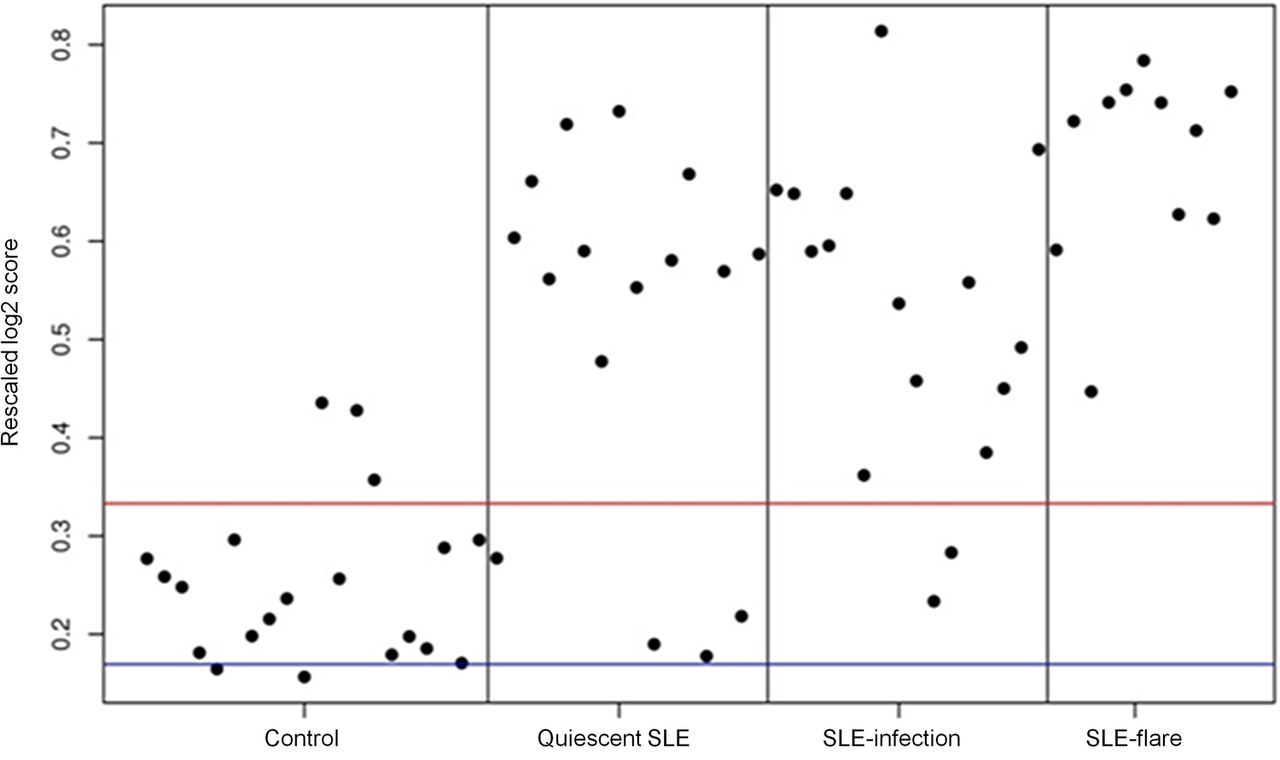
Finally, as an alternative method of analysis, we chose to examine one of the early IFN ‘score’ measures originally identified by Baechler et al;17 67 out of the 73 IFN-inducible genes used by this group were contained in our data set. A row-scaled heat map with samples grouped by clinical status demonstrates a gradient of IFN-inducible gene expression ranging from virtually none in the HC group to high in the SLE flare group (see online supplementary figure S3). An ‘IFN score’ was computed for each subject; expression values for each IFN-inducible gene were transformed to be in a range from 0 to 1, thereby allowing each gene to contribute equally to the score, irrespective of whether it generally has high or low expression. An average of all 67 IFN-inducible genes was then calculated for each subject and plotted according to clinical status (figure 3). As expected, the heat map and plot of individual IFN scores demonstrate that SLE flare had the highest IFN scores and IFN-inducible gene expression, while HC had the lowest. Additionally, mean IFN scores (p=0.006) and mean SLEDAI scores (p=0.014) were significantly higher in SLE flare compared with SLE infection by a Welsh two-sample t-test analysis. However, IFN scores in the SLE infection and inactive SLE groups were variable and these two groups are not well differentiated by mean IFN scores (p=0.08). Thus, as shown in figure 3, the simple presence of a high IFN score in an individual is not a good predictor of disease flare or a good differentiator between disease flare, infection or inactive SLE.

Individual ‘IFN scores’ modified from Baechler et al16 grouped by clinical status (healthy control, inactive systemic lupus erythematosus (SLE), SLE infection, SLE flare). Red and blue lines indicate the mean of the healthy controls±1 SD.
Impact of organism type on IFN-regulated gene expression and disease activity
Impact of organism type on IFN-regulated gene expression and disease activity. Recognising that some viral, fungal and mycobacterial infections have been shown to induce upregulation of IFN-related genes,25–27 we examined the molecular gene expression associated with the subjects that had mycobacterial and fungal infections. The IFN scores in this small subset (n=6) were extremely variable (data not shown) indicating no increased expression of IFN-regulated genes. Additionally, there were no significant correlations between SLEDAI scores and infection type grouped as mycobacterium or viral. Of interest, the one subject with a candida infection also had the highest SLEDAI score of 24.
Discussion
We have carried out group differential expression and modular transcriptional analyses of microarray data from whole blood samples of acutely ill patients with SLE prior to any pharmacological intervention. The data suggest that expression profiling can provide clinically useful information in the evaluation of an acutely ill patient with lupus whose clinical symptoms may be attributable to either infection or disease flare.
Our approach was provoked in part by preclinical studies in mice which have shown that peripheral blood gene expression profiles distinguish between sterile and infectious sources of inflammation with 94% accuracy.28 These data were extended by the detection of a ‘sepsis signature’ in the peripheral blood leucocytes in paediatric patients with pneumonia and adult trauma patients with early sepsis29 ,30 and subsequently multiple studies have demonstrated that genomic profiling of circulating cells can identify distinctive transcriptional signatures that distinguish sepsis from other causes of systemic inflammation (reviewed in31). In SLE, peripheral blood gene expression profiling has identified the ‘IFN signature’, an overexpression of IFNα-inducible genes, a granulopoiesis signature in paediatric SLE and a plasma cell signature as biomarkers for lupus that may also correlate with disease activity or predict clinical flare.17 ,32–35
In our data set, differential gene expression analysis using a stringent Benjamini-Hochberg correction identified seven genes preferentially expressed in SLE flare and one in SLE infection (table 2). In particular, upregulation of CXorf21, FLi-1 or IFIT1 and downregulation of MYL5 are candidate predictors of flare in acutely ill patients. While there is little available information on the function or clinical associations of the CXorf21 and MYL5 genes, the Fli-1 gene encodes for a Fli-1 transcription factor that is a member of the Ets family and has been implicated in SLE pathogenesis. Overexpression of Fli-1 in transgenically altered non-autoimmune mice and Fli-1 knockout mice both result in a lupus-like phenotype including renal disease.36–38 Reducing Fli-1 expression improves disease and survival in the murine models39 ,40 and in human SLE a specific microsatellite length of the Fli-1 promotor has been reported to be significantly more prevalent in patients with SLE without nephritis.41 In our cohort, Fli-1 was preferentially expressed in subjects with active renal disease. IFIT1 is one of the IFN-inducible genes whose role in SLE pathogenesis has now been firmly established.42 Using logistic regression, the combination of CXorf-21, IFIT1, FLi-1, MYL5 actually show a perfect correlation with SLE flare versus infection in our data set, and provide an initial hypothesis for subsequent replication. Beyond this core set of highly discriminatory transcripts, differential gene expression analysis with an unadjusted p value of 0.05 yielded larger lists of genes preferentially expressed in flare (n=60) or infection (n=24) (see online supplementary table S1). Of interest, and again corroborating previously published data, many of the genes associated with flare are IFN-inducible (61%) but none of those associated with infection were IFN-inducible. Some of the upregulated gene transcripts in the infection group were neutrophil signals for bacterial infection and SIGLEC genes that transcribe cell surface adhesion molecules. Clinically, the SLE flare group was differentiated from those with infection by increased frequency of low C3 levels, higher SLEDAI scores and absence of fever. It is therefore possible that a composite measure comprised of an increased SLEDAI score, low C3 and expression of selected gene transcripts may improve the ability to rapidly distinguish SLE flare from infection in a clinical setting but this will rely on a larger validation study. Discordance between serum levels of C reactive protein (CRP) and erythrocyte sedimentation rate in disease flare is well recognised and elevated CRP has been reported as a surrogate marker for infection in patients with SLE in several studies (reviewed in43). However, elevated CRP levels have been reported in patients with SLE with active arthritis, serositis and African heritage.44–46 CRP levels were not measured in our study; it therefore remains possible that CRP remains an important discriminator between infection and disease flare and perhaps should be considered as part of a composite measure for infection in combination with gene expression, SLEDAI, C3 and fever.
The modular analyses provide additional support for the known importance of α IFN in disease pathogenesis. The first-generation modular analyses demonstrated modestly increased IFN-inducible gene expression in the SLE flare group compared with SLE infection and inactive SLE. This is further illustrated by three recently defined IFN modules (M1.2, M3.4, M5.12) in a ‘second generation’ modular transcriptional repertoire that have sequential and distinct activation thresholds. It has been previously reported that gene expression in M1.2 is stable over time and unrelated to disease activity whereas expression in modules M3.4 and M5.12 is more variable and is related to disease activity.19 Accordingly, all of the SLE groups in our cohort demonstrated significant expression in M1.2. In contrast, increased gene expression in M5.12 was seen in only 25% of inactive SLE compared with 100% of SLE flare. These results corroborate the findings of Chiche et al, suggesting that intensity of IFN-inducible gene expression (demonstrated by gene expression in M5.12) correlates with disease activity whereas gene expression in M1.2 alone is a marker for SLE. However, 88% of the SLE infection group also had increased gene expression in M5.12. Additionally, analysis of ‘IFN scores’ derived from 67 IFN-inducible genes identified by Baechler et al, suggests that the presence of increased IFN-inducible gene expression is not a reliable predictor of flare that is exclusive of infection. Of note, the differential expression analysis identified eight genes that had excellent predictive value for differentiating SLE flare from SLE infection and only two of those are IFN-inducible.
Four subjects with infection also had high SLEDAI scores suggesting that concomitant clinical evidence of disease flare likely alters expression of IFN-inducible genes. Additionally, host responses to some infections, including fungal and mycobacterial infections, have been characterised by type I IFN-mediated signalling.25–27 Moreover, gene expression in the second-generation IFN modules was not exclusively associated with IFNα; IFNβ was shown to contribute to M1.2 gene expression and IFNγ is a contributor to expression in M3.4 and M5.12.19 In our analyses, those subjects with fungal and mycobacterial infections did not have the highest IFN scores, however, given the small sample size, microbial influences on IFN gene expression cannot be ruled out. It is possible that an SLE infection cohort with a larger viral infection group may in fact demonstrate different results.
Although a granulopoiesis signature has been associated with paediatric SLE,18 ,32 upregulation of the neutrophil module in our cohort was only associated with SLE infection and not disease flare. Whether this reflects the effects of immunosuppression on the granulopoiesis signature (the paediatric findings were in newly diagnosed, untreated subjects) or an age- related difference is not clear.
Our pilot study has several limitations aside from the relatively small sample size. Microarray experiments portray a moment in time and do not address possible changes in transcription. Additionally, whole blood transcriptomes can be influenced by alterations in numbers of peripheral blood cells and cellular subsets due to tissue migration and haematopoiesis. Cellular subsets may also be influenced by medication, disease activity and race or ethnicity. Therefore, while these results suggest that whole blood gene expression profiling may prove to be useful in differentiating disease flare from infection, future studies should aim at replicating these results in a larger cohort and the data reported here may be used to power this study. The long-term goal will be to validate use of individual genes or composite measures as a bedside diagnostic test to provide more directed medical care resulting in lower morbidity and mortality.
Acknowledgments
The authors thank all subjects for their participation in the study. They also thank Andrew Shaw, senior coordinator at the Feinstein Institute for his organisational and technical expertise and management of the regulatory files.
References
Footnotes
Contributors MM, CA, BD and PKG participated in study design. MM, CA, JS-G and JL participated in recruitment, data collection and analysis. MO, IK and SK participated in data analysis and all authors participated in interpretation of data analysis and final approval of the manuscript.
Funding This study was funded by a grant from the Alliance for Lupus Research, grant # 83802.
Competing interests None declared.
Patient consent Obtained.
Ethics approval The protocol was approved by local institutional review boards at each of the three sites; Northwell Health System, Manhasset, New York, USA, St. Luke's Medical Center, Quezon, Philippines and the Instituto Nacional de Ciencias Medicas y Nutricion, Mexico City, Mexico.
Provenance and peer review Not commissioned; externally peer reviewed.
Data sharing statement We believe that all of the relevant results of the gene expression analyses have been included in the paper and supplemental tables and figures. However, additional data from the gene expression analyses will be available on request.