Article Text

Abstract
Objectives Composite criteria/indices are presently used to diagnose and monitor patients with systemic lupus erythematosus (SLE). Biomarkers for these purposes would be helpful in clinical practice. We therefore evaluated a large panel of cytokines and basic laboratory tests and investigated their performance as discriminators versus controls and as biomarkers of disease activity (DA).
Methods We examined 437 patients with SLE, fulfilling American College of Rheumatology-82 criteria, and 322 matched controls. DA was assessed according to both SLE DA Index 2000 (SLEDAI-2K) and SLE Activity Measure (SLAM). British Isles Lupus Activity Group (BILAG) was used to assess renal DA. Additionally, 132 patients self-assessed their Global Disease Activity (PtGDA). Mesoscale Discovery 30-plex cytokine assay and routine blood chemistry was performed on fasting EDTA-plasma.
Results Of 26 tested biomarkers, we identified TNF-α as the superior discriminator between patients with SLE and controls (median=4.5 pg/mL, IQR=3.1–6.2 vs median=2.3 pg/mL, IQR=2.0–2.8). The strongest correlations to SLEDAI-2K and SLAM were obtained with TNF-α (Spearman rho (ρ)=0.32 and ρ=0.34, respectively), partly driven by the nephritis subgroup, and with p-albumin (ρ=−0.33 and ρ=−0.31, respectively). P-albumin was decreased and TNF-α was increased in patients with kidney involvement (renal BILAG A/B vs C/D/E, p=4×10–16 and p=6×10⁻⁹ respectively). IP-10 was increased in patients with joint involvement (SLAM item 24≥2 vs ≤1, p=0.0005) but did not differ when comparing patients with active/inactive kidney involvement. The most powerful correlations to PtGDA was observed with p-albumin (ρ=−0.42), IL-6 (ρ=0.30) and TNF-α (ρ=0.29).
Conclusion TNF-α and p-albumin both performed well as discriminators between patients with SLE and controls and as proxies for DA according to both rheumatologists’ and patients’ assessments. In particular, renal DA was well reflected by TNF-α. We propose that the TNF-α and p-albumin merit further investigations as clinically useful biomarkers in SLE. We also observed that the pattern of activated cytokines varies with organ involvement.
- cytokines
- systemic lupus erythematosus
- TNF-alpha
- disease activity
- p-albumin
- IFN-gamma
- IL-8
- IL-15
- Eotaxin
- MCP-1
- MDC
- MIP-1beta
- IL-10
- IL-6
- IL-12
- IL-23
- IL-16
- IL-1alpha
- IL-7
- VEGF
- IP-10
- MCP-4
This is an Open Access article distributed in accordance with the Creative Commons Attribution Non Commercial (CC BY-NC 4.0) license, which permits others to distribute, remix, adapt, build upon this work non-commercially, and license their derivative works on different terms, provided the original work is properly cited and the use is non-commercial. See: http://creativecommons.org/licenses/by-nc/4.0/
Statistics from Altmetric.com
- cytokines
- systemic lupus erythematosus
- TNF-alpha
- disease activity
- p-albumin
- IFN-gamma
- IL-8
- IL-15
- Eotaxin
- MCP-1
- MDC
- MIP-1beta
- IL-10
- IL-6
- IL-12
- IL-23
- IL-16
- IL-1alpha
- IL-7
- VEGF
- IP-10
- MCP-4
Key messages
TNF-α outperformed a large set of cytokines and conventional biomarkers as discriminator between patients with SLE and controls.
TNF-α and p-albumin correlated to three different measures of systemic lupus erythematosus (SLE) disease activity (DA), one of which is patient reported.
P-albumin, an available routine measurement, merits appreciation as a biomarker of SLE DA.
Cytokine profile varies with organ involvement.
Introduction
Systemic lupus erythematosus (SLE) is an autoimmune disease that may involve many organ systems. The heterogeneity of disease manifestations and the lack of biomarkers to diagnose and monitor disease activity (DA) in SLE pose difficulties in daily clinical practice and are great obstacles for the design of clinical trials. Over the years, several different indices which measure SLE-related DA have been developed and validated,1 including SLE Disease Activity Index (SLEDAI),2 slightly modified 2000 (SLEDAI-2K),3 Systemic Lupus Activity Measure (SLAM),4 European Consensus Lupus Activity Measurement (ECLAM)5 and British Isles Lupus Assessment Group (BILAG) index.6 These indices are time and resource consuming and rely on doctors’ subjective assessments of DA and many also incorporate laboratory results. Some grade the extent of organ involvement (SLAM, BILAG) or assess the change versus previous visits (BILAG, ECLAM). SLEDAI-2K is insensitive to change since it relies on the qualitative presence/absence of clinical symptoms or laboratory results. Patients’ perspectives may add a complementary view of DA, for example, as included in Systemic Lupus Activity Questionnaire (SLAQ),7 but are not included in the commonly used indices.
The available indices of DA incorporate various laboratory measures but none of them use more recent measures of systemic inflammations such as the cytokines/chemokines known to be involved in SLE.8 Previous studies have investigated the performance of cytokines/chemokines as biomarkers of DA9 and reported both positive associations10 as well as lack of association.11 12 The majority of these studies were performed on a limited number of patients and smaller sets of biomarkers, and the reported findings have usually not been further validated or applied in clinical practice.
Thus, we simultaneously evaluated the performance of a large set of cytokines together with commonly used routine laboratory tests in a large and well-characterised cohort of patients with SLE and matched population controls. Our overall aim was to accommodate an unmet clinical need of new, simple and more sensitive biomarkers to diagnose SLE and monitor DA. We specifically addressed the following three situations: (1) discrimination of patients with SLE from controls, (2) identification of biomarkers of DA which perform well in comparison to SLAM, SLEDAI-2K and Patients’ assessment of Global Disease Activity (PtGDA) and (3) biomarkers that can be used to evaluate DA in specific organ systems.
Material and methods
Patients and controls
We included consecutive patients with SLE from the Rheumatology clinics at Karolinska University Hospital and Danderyd’s Hospital in Stockholm, during the inclusion period January 2004 and September 2013. All patients were >18 years old and fulfilled the 1982 revised American College of Rheumatology classification criteria13 for SLE (n=437). This is a cross-sectional study and the majority of the inclusion visits replaced a regular outpatient visit and in a few cases, patients were included while in hospital for a more severe flare. We identified and individually matched controls in the national population registry for age (±1 year), sex/gender and residential area to the first 322 patients with SLE. A diagnosis of SLE was the only exclusion criterion among controls. We allowed other diseases, for example, rheumatoid arthritis, in order to obtain representative population samples without SLE. Controls were investigated according to the same structured protocol as the patients with SLE including interview, medical investigation, medical file review and questionnaires. Individuals with serious infections at time of blood withdrawal were excluded. Blood samples were drawn after overnight fasting. All laboratory examinations were performed on patients and controls, either on fresh samples or after storage in −70°C (cytokines). All participants gave informed written consent to participate.
Participants underwent a structured interview and a physical examination by a rheumatologist. History and characteristics of SLE and associated manifestations, current and prior medications were obtained through interviews and medical records. SLE DA was determined with SLAM4 and SLEDAI-2K.2 A subgroup of patients (n=132) also answered a question of patient numeric rating scale for global disease activity (PtGDA), scale 0–10, from the questionnaire SLAQ.7 14 We specifically evaluated renal involvement with British Isles Lupus Activity Group (BILAG).6 Active kidney involvement was defined by a renal BILAG score of A or B, and inactive/absent kidney disease was defined as a renal BILAG score of C, D or E. We used SLAM to measure joint and skin/mucosa involvement since SLAM, as opposed to SLEDAI, is a graded measure, which we believe captures active joint and skin involvement better than SLEDAI. Active joint involvement was defined as SLAM item 24>1, that is, at least one objective arthritis. Active skin/mucosa manifestations were considered present if the sum of SLAM items 4 and 6 was >0.
Basic laboratory measurements
Complement factors C3 and C4 were analysed in EDTA-plasma on a Modular analyzer (Roche). High-sensitivity creative protein (CRP) and plasma (p)-albumin were measured in heparin-plasma with BN ProSpec System (Dade Behring, Deerfield, Illinois, USA). The erythrocyte sedimentation rate (ESR) was determined in citrate-plasma by the Westergren method. Anti-dsDNA levels were measured by multiplexed bead technology (Luminex) using BioPlex 2200 system (Bio-Rad, Hercules, California, USA). Laboratory tests in clinical routine, for example, urinary (u)-albumin/creatinine ratio, were performed at the SWEDAC (http://www.swedac.se) accredited Clinical Chemistry Laboratories at the Karolinska University Hospital.
Mesoscale Discovery (MSD) multiplex analysis of cytokines
EDTA-plasma samples were analysed using the MSD V-PLEX Human Cytokine 30-plex kit (K15054D; Mesoscale Discovery, Gaithersburg, Maryland, USA) according to manufacturer’s instruction. In short, the plasma samples were thawed at room temperature and just before analysis diluted, twice for proinflammatory cytokine and four times for chemokine analysis, in sample diluents. The diluted samples were incubated on the MSD plates for 2 hours at room temperature while shaking. Plates were washed and incubated in additional 2 hours with detection antibodies. After washing, 2× Read buffer T was added to each well and the plates were analysed in a Sector Imager 6000. Lower limit of quantification (LLOQ) was determined for each assay plate based on the lowest standard point with a coefficient of variation <25% and an accuracy (back-calculated concentrations) of 80%–120%.
Statistics
Patients and controls were compared using Mann Whitney U test or χ² test depending on distribution. To determine correlations between SLAM/SLEDAI-2K/PtGDA and investigated variables we calculated Spearman’s rank correlation coefficient (ρ). Figure 3 is based on log-transformed data of TNF-α to attain normal distribution. Calculations were performed using JMP software (SAS, Cary, North Carolina, USA), Excel (Microsoft Office 2010) or Prism (GraphPad Software, V.4). A two-sided p<0.05 was considered statistically significant. Bonferroni correction for multiple comparisons was applied when indicated.
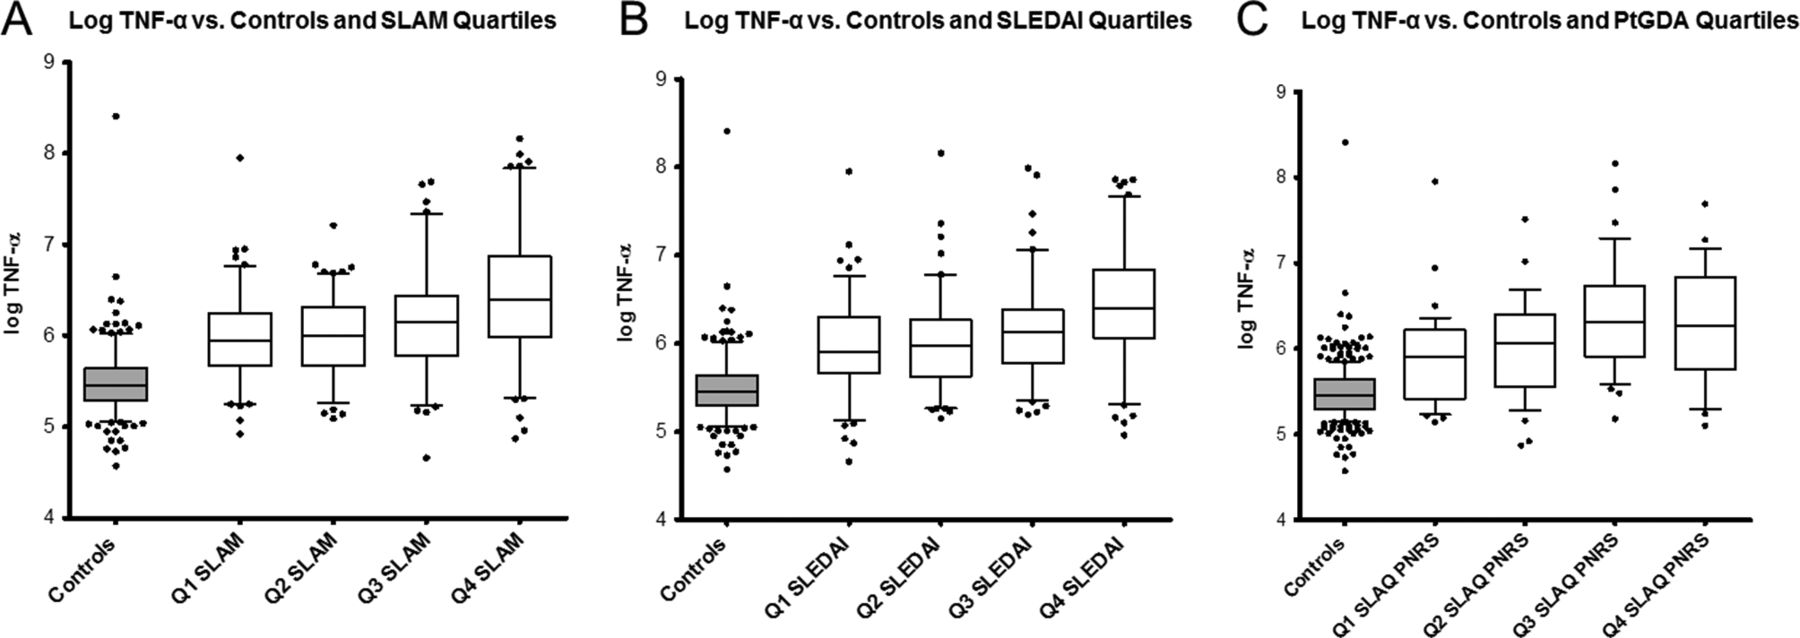
The relationship of TNF-α to different measures of DA are shown: Log10 TNF-α levels versus quartiles of (A) SLEDAI-2K, (B) SLAM and (C) PtGDA. DA, disease activity; PtGDA, patients’ assessment of Global Disease Activity; SLAM, SLE Activity Measure; SLAQ, Systemic Lupus Activity Questionnaire; SLE, systemic lupus erythematosus; SLEDAI, SLE DA Index.
Results
Patients with SLE versus controls
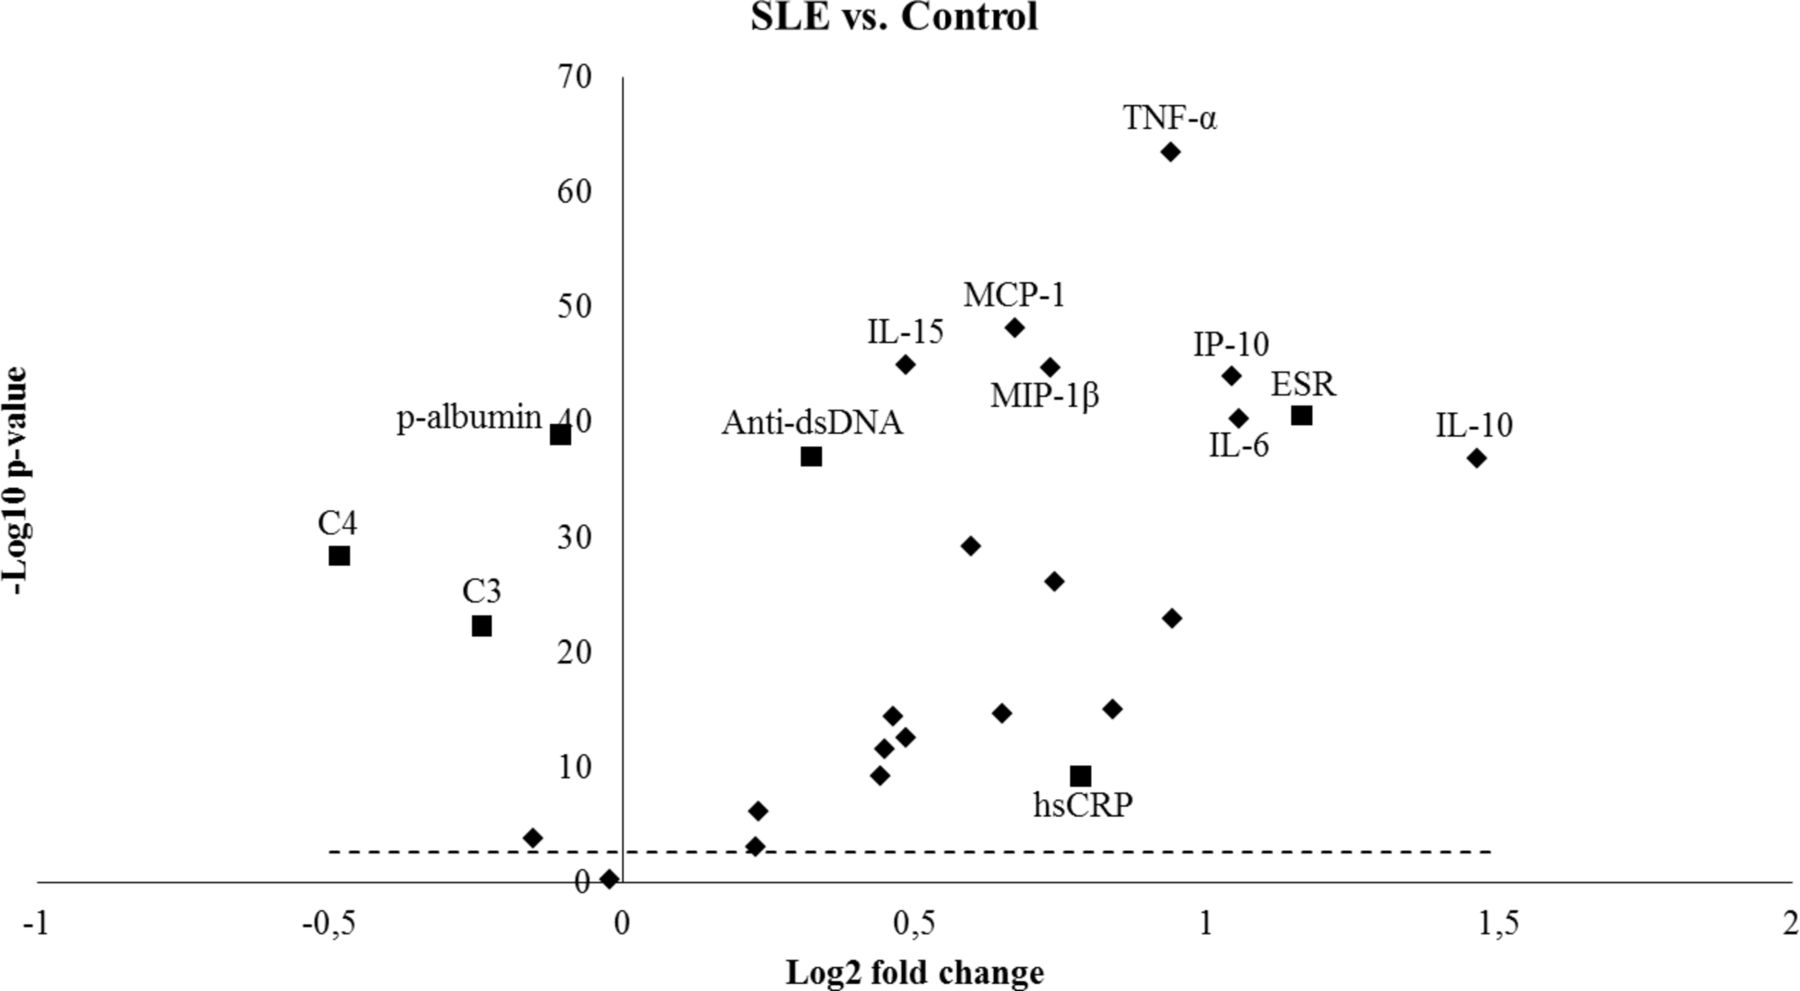
We studied 437 patients with SLE and 322 population controls and the demographics and basic clinical characteristics of patients and controls are presented in table 1. We performed a multiplex screening of 30 cytokines and the cytokines that were detected above LLOQ in more than 25% of the patient with SLE or control samples were included (n=20) for further analysis (online supplementary table S1). Nineteen of 20 cytokines were significantly increased (Bonferroni corrected p<0.05) in SLE compared with controls (table 2, figure 1). In addition, six standard clinical laboratory measurements (ESR, C4, C3, p-albumin, hsCRP and anti-dsDNA) were studied comparing SLE and controls (table 2, figure 1). TNF-α showed the lowest p value comparing SLE and controls (figure 1) and when excluding patients ever diagnosed with nephritis (41%), TNF-α still showed the lowest p value (p=3.4×10–44). A receiver operating characteristic curve was obtained with an area under the curve of 0.86 (95% CI 0.83 to 0.89) for discrimination of patients with SLE versus controls (figure 2).
Supplementary file 1

Cytokines with the lowest p values (Mann Whitney U test) comparing SLE to controls are noted. In addition, the six investigated standard clinical laboratory measurements are shown as squares. P values above the dotted line are significant (p<0.05) after correction for multiple testing (n=26). SLE, systemic lupus erythematosus.

ROC curve analysis of TNF-α was used to assess the discrimination between patients with SLE and controls. The AUC for TNF-α was 0.86 (0.83–0.89). AUC, area under the curve; ROC, receiver operating characteristic; SLE, systemic lupus erythematosus.
Cohort characteristics
Investigated potential biomarkers and their correlations to disease activity
Correlation to disease activity
The correlation between potential biomarkers (cytokines and standard laboratory measurements) and DA indices (SLAM, SLEDAI-2K and PtGDA) are reported in table 2. P-albumin and TNF-α correlated to all three measurements of DA by ρ≥|0.3| and to each other with ρ=0.40. The relationship of TNF-α and p-albumin to quartiles of SLEDAI-2K, SLAM and PtGDA respectively are shown in figure 3 (TNF-α) and online supplementary figure S1 (p-albumin). Slightly weaker correlations to all three DA measurements were observed for IL-6 and MCP-1 (ρ≥0.20). In addition, ESR, IL-15 and MIP-1α correlated with both SLAM and SLEDAI-2K (ρ≥|0.25|) but not with PtGDA. Overall, the strongest observed correlations were between p-albumin and PtGDA (ρ=−0.42, p<0.0001) (table 2).
Supplementary file 2
![[lupus-2018-000260-SP2.jpg]](https://lupus.bmj.com/content/lupusscimed/5/1/e000260/DC2/embed/inline-supplementary-material-2.jpg?download=true)
For SLAM, the strongest observed correlation was with ESR (ρ=0.48, p<0.0001), and this was expected since ESR is part of SLAM. The second strongest correlations to SLAM (ρ=|0.3|) were observed for TNF-α, p-albumin, IL-15 and MIP-1α. When we excluded all patients ever diagnosed with nephritis (online supplementary table S2), the correlation for SLAM vs. TNF-α, p-albumin, IL-15 and MIP-1α were slightly lower (ρ=|0.2|). Two items included in SLEDAI-2K, anti-dsDNA (ρ=0.47) and C4 (ρ=−0.36), correlated, as expected, to the total SLEDAI-2K score. The second strongest correlations to SLEDAI-2K were obtained for p-albumin, TNF-α, C3, IL-15, ESR, IL-10 and MIP-1α (ρ=0.3). If only patients with non-nephritis were considered (online supplementary table S2), the correlation between p-albumin and SLAM remained but weakened, while SLEDAI-2K lost significance. The correlation between SLEDAI-2K and IL-10 remained with the same strength. For PtGDA, the strongest correlation was obtained for p-albumin (ρ=−0.42) followed by IL-6, TNF-α, MCP-1, IP-10 and hsCRP (ρ=0.3). Including only patients without nephritis (online supplementary table S2), the correlations to PtGDA remained with similar strength for p-albumin (ρ=−0.36), IL-6 (ρ=0.38), MCP-1 (ρ=0.27), IP-10 (ρ=0.26) and hsCRP (ρ=0.29), while it was decreased for TNF-α (ρ=0.14). Correlations between the three investigated DA measurements were all moderate: SLEDAI-2K vs SLAM with ρ=0.56, SLEDAI-2K vs PtGDA with ρ=0.44 and SLAM vs PtGDA with ρ=0.58.
Organ-specific measure of disease activity
We investigated if DA in specific organ systems was associated to our potential biomarkers. Comparing patients with active kidney involvement to patients with inactive or no renal involvement, p-albumin and TNF-α showed the highest association (table 3). Additionally, IL-16, anti-dsDNA and IL-10 were elevated in active nephritis (Bonferroni-corrected p<0.05). Another measure of renal DA is the urinary (u-) albumin/creatinine ratio and it was as expected associated with active kidney involvement (table 3). This ratio is mainly relevant to measure in patients with nephritis, since patients with non-nephritis do not excrete albumin in the urine. The u-albumin/creatinine ratio was found to correlate to SLAM (ρ=0.22) and SLEDAI-2K ρ=0.30) but not to PtGDA (ρ=0.12, p=0.2) (table 2) and in the non-nephritis subgroup, the correlation to SLEDAI-2K was not significant (online supplementary table S2). P-albumin and TNF-α levels correlated to u-albumin/creatinine (ρ=−0.39 and ρ=0.28, respectively). In patients with joint involvement/active arthritis, IP-10, IL-1α, IL-6, TNF-α and ESR were significantly increased (Bonferroni-corrected p<0.05) compared with patients without active arthritis. IP-10 was associated to skin/mucosa involvement but the difference did not remain significant after Bonferroni correction.
Comparison between active and inactive disease in different organ systems
Patients with disease activity versus patients with inactive disease and controls
We defined inactive SLE as SLEDAI-2K=0 (n=115), previously described as remission.15–17 With this definition 26% had inactive disease. Of inactive patients, 41% (n=47) did not take prednisolone at all and 78% (n=90) were on a maximum prednisolone dose of 5 mg. Comparing inactive patients with the other patients (SLEDAI-2K>0, n=322), we found that IL-15, TNF-α, IL-7, VEGF, IP-10, anti-dsDNA and ESR were higher and C4 and C3 lower in patients with DA (p<0.001). P-albumin did not reach this level of significance after Bonferroni correction comparing active and inactive disease (P=0.008, not corrected for multiple testing). Interestingly, IL-7 and VEGF did not differ when comparing inactive patients with controls. All other investigated variables except MDC, IL-16, IL-1α and Eotaxin-3 differed between inactive patients and controls (online supplementary table S3). Five of the inactive patients (SLEDAI-2K=0) also had SLAM=0. Only eight patients in the cohort had SLAM=0.
Discussion
The major finding in this study is that circulating levels of TNF-α outperform a set of 26 investigated traditional and potential SLE biomarkers as a discriminator between patients with SLE and controls. Furthermore, TNF-α levels correlate with DA (SLAM, SLEDAI and PtGDA) and is in particular associated with active nephritis. Together with previous reports our results demonstrate that TNF-α plays an important role in SLE and deserves attention as a clinically useful biomarker.
Though initial reports were inconsistent, there are now a large number of studies, which reliably demonstrate that high levels of circulating TNF-α are associated with SLE,10 12 18–21 regardless of ethnicity.22 Many positive correlations between TNF-α and higher DA have been reported10 12 23 24 and these together with our results may still be underestimations since most active patients are taking prednisolone and other immunosuppressive treatments, which are likely to have a negative impact on cytokine levels.25 We previously noted that TNF-α alone, and combined with its highly correlated soluble receptors (TNFR1 and TNFR2),26 is a good measure/biomarker of DA in SLE.10 12 Others have reported similar results.27 Cigni et al found the highest levels of TNF-α in patients with newly diagnosed active and untreated SLE,19 while Munroe et al demonstrated that high levels of TNF-α and its two soluble receptors precede disease flares by 6–12 weeks.28 In a smaller SLE cohort (n=45), investigating five cytokines by the MSD assay, correlations between TNF-α and SLEDAI were similar to our observations.12 The novelty of this study is that we can demonstrate a supreme performance of TNF-α in a competitive context including a large group of patients and matched population controls, many new and traditional biomarkers and three DA indices, one of which is patient reported. TNF-α blockade in SLE has been reported in smaller open label studies and case reports and is still a controversial issue. Concerns regarding induction of autoantibodies and infections remain, nevertheless many patients with SLE have improved following such therapy.29 30
Importantly, our results also demonstrate that p-albumin performed almost as well as TNF-α, demonstrating inverse correlation to both SLAM and SLEDAI and even stronger to PtGDA. Yip et al previously reported negative correlations between albumin levels and DA in SLE, and in accordance with our results correlations were strongest among patients with lupus nephritis, but also present in patients with non-nephritis SLE.31 These very useful findings are, however, not yet widely recognised or highlighted and they are not used in any of the commonly used DA indices.3–6 The absolute differences in albumin levels may, however, be small, especially in patients with non-nephritis as demonstrated in online supplementary table S2. To further evaluate albumin as a measure of DA, we suggest that levels should be followed in longitudinal studies, that is, using each individual as its own control. Albumin, a negative acute-phase protein and a marker of inflammation,32 correlates with degree of illness33 in many settings, thus not specifically with SLE-related DA. In renal disease, albumin levels are indirect reflections of renal loss through proteinuria. Albumin is also routinely used to evaluate protein and energy/nutritional status.34 Though unspecific, it is important to highlight that p-albumin, an inexpensive routine laboratory analysis performed by simple instrumentation with a fast readout, is a good biomarker for SLE-related DA, especially in patients with nephritis. P-albumin also reflected PtGDA well both in patients with nephritis and non-nephritis. In contrast, several current DA indices require specialised laboratories where analyses are costly and slow, for example, anti-dsDNA antibodies, C3 and C4. In a global perspective where resources are often limited, our observation is highly relevant in order to obtain equal health and treatment for patients with SLE.
Interestingly, IL-15, a regulator of T-cells and natural killer cells, correlated with SLAM, SLEDAI and was associated with renal DA. Furthermore, IL-15 was a good discriminator between controls, inactive and active SLE. Aringer et al previously reported high levels of IL-1535 and recently urinary levels of IL-15 were reported to discriminate active lupus nephritis from active SLE with other manifestations.36 To our knowledge, circulating IL-15 has not previously been investigated in a large SLE cohort. IL-16 is mainly a CD8+ T cell cytokine, which induces chemotaxis of CD4+ T cells and monocytes. We confirm previous reports that IL-16 levels are higher in SLE than controls.37 38 While correlations with overall DA were modest, we noted strong associations with active renal disease.
We evaluated DA in three different organ systems: kidneys, joints and skin/mucosa. We observed increased levels of TNF-α, IL-16, anti-dsDNA and IL-10 and lower levels of p-albumin in patients with active kidney disease as compared with other patients with lupus. The association between renal BILAG A/B and high TNF-α levels is supported by previously documented local upregulation of genes, single–cell RNA and production of TNF-α in active renal disease. TNF-α was in these studies located in tubular cells and along glomeruli.39–41 Furthermore, high circulating levels of TNF-α together with IL-17/IL-23 and INF-γ indicated poor response to traditional treatment in lupus nephritis.42 43 Preserved P-albumin was recently reported to predict favourable outcome after 4 years in patients with biopsy proven nephritis.44 Interestingly, IP-10 was upregulated in active arthritis and in skin/mucosa manifestations, but not in active nephritis. We confirm our previous observation that IP-10 is associated with high DA, arthritis and musculoskeletal symptoms45 and those of Kong et al who reported associations between IP-10 and both general and mucocutaneous DA.46 Joint and skin/mucosa manifestations are likely to affect patients’ perception of disease and IP-10 also correlated more strongly to PtGDA than to SLAM and SLEDAI. IFN-α was not included in the Human Cytokine 30-plex assay and was therefore not analysed. However, we recently investigated a subset of this cohort with a pan-IFN-α ELISA assay, demonstrating that high levels of IFN-α were associated with active mucocutaneous disease.45 Furthermore, we observed higher TNF-α, IL-6, IL-1α and ESR in patients with joint activity. Taken together the pattern of biomarkers seems to differ between organ involvements.
A great advantage with this study is that different instruments have been used to measure DA. Agreements between these measures of DA have been previously studied47 and the correlations are commonly about ρ=0.6, thus in line with our findings. All frequently used DA indices require formal training and substantial time for a proper assessment.1 Nevertheless, subjective perceptions definitely influence the results. Previous studies have pointed out the importance to also incorporate elements of patients’ perception when assessing DA.1 An important advantage with patients’ assessments of DA is that it is easy14 and inexpensive to collect in clinical practice. In concordance with this discussion, it is a great advantage that we can compare our results with PtGDA from a subset of our patients. Interestingly, PtGDA correlated best with p-albumin, IL-6, TNF-α, MCP-1 and IP-10, all of which also correlated to SLAM and SLEDAI. Thus, these cytokines seem to be pivotal in organ manifestations with impact on patients’ health perception. On the other hand, IL-15, MIP-1α, ESR correlated poorly with PtGDA, despite correlations with SLAM and SLEDAI-2K, suggesting that these cytokines reflect disease processes which are difficult for patients to assess. Renal activity is one such manifestation, and PtGDA had low correlations with IL-16 and MIP-1α, while these cytokines were associated with active nephritis.
The large size and detailed clinical information in this study are strengths, while the cross-sectional design is a weakness and longitudinal confirmation is needed to evaluate the predictive power of investigated biomarkers. However, others have reported similar associations with TNF-α in longitudinal studies supporting our results of TNF-α as a marker of DA28 and p-albumin.31 44 Another weakness with this study is that mainly European Caucasian patients/controls were included and results can thus not be generalised to other ethnicities. Furthermore, the specificity of the suggested biomarkers has not been studied in relation to other diseases.
Based on a large and well-characterised cohort, a sizeable set of biomarkers and DA measured, we demonstrate that TNF-α and p-albumin are supreme discriminators between patients with SLE and controls and they also correlate with ρ≥0.3 to all three DA indices. The reproducibility of TNF-α data in several previous cohorts and the routine use of p-albumin in the clinic highlight the robustness of the suggested biomarkers. We suggest that TNF-α and p-albumin can be used in the clinic at a reasonable cost as useful biomarkers for diagnostic and surveillance purposes in SLE.
Acknowledgments
We would like to acknowledge patients and participants in the study. We are grateful to Eva Jemseby for management of blood samples and to Jill Gustafsson and Sonia Möller for coordination and blood sampling. We thank Ola Börjesson for help with inclusion of patients.
References
Footnotes
HI and SE contributed equally.
Contributors HI: study design, data analysis and manuscript writing. SE: cytokine measurements, manuscript writing. SP: PtGDA data collection and analysis, manuscript writing. JTG: clinical data, manuscript writing/approval. AZ: clinical data, manuscript writing/approval. MK: clinical data, manuscript writing/approval. VO: clinical data, manuscript writing/approval. P-JJ: study design, manuscript writing/approval. IG: SLE cohort responsible, manuscript writing. ES: study design, SLE cohort responsible, data analysis, manuscript writing.
Funding This study was supported by the AstraZeneca-Karolinska Institutet Joint Research Program in Translational Science, Swedish Research Council, Stockholm County Council (ALF), Swedish Heart-Lung foundation, King Gustaf Vs 80th Birthday Fund, Swedish Rheumatism Association, Swedish Society of Medicine, The Åke Wiberg Foundation, Karolinska Institutet’s Foundations and The Foundation in memory of Clas Groschinsky.
Competing interests SE is an employee of AstraZeneca.
Patient consent Obtained.
Ethics approval The Local Ethics Committee of the Karolinska University Hospital/Karolinska Institutet in Stockholm approved the study.
Provenance and peer review Not commissioned; externally peer reviewed.
Data sharing statement There are no additional unpublished data available.