Article Text

Abstract
Purpose Diagnosis and treatment of systemic lupus erythematosus (SLE) are based on the compilation ofcomplex sets of clinical data, often established over several years. Reading through those large matrices canbe time-consuming and require specifi c training. Thus, our aim was to create a visual representation thatmakes it easier to access the global health status of an SLE patient, and to use it as a knowledge transfertool.
Methods First, we selected clinical criteria that are representative, useful, and revealing of the medicalsituation in SLE. Using R language programming, we developed a script that automatically transposesclinical data into an attractive image, whose graphical characteristics refl ect the selected clinical criteria.
Results The visual representation is a butterfl y, the emblematic symbol of lupus, which incorporates shadesof purple, the color of lupus awareness, and is compliant for people with color blindness. The visualgraphically provides eleven key clinical criteria, including patient-reported outcomes: age, sex, diseaseactivity (SLE Disease Activity Index 2000), organ damage (Systemic Lupus International Collaborating ClinicsDamage Index), comorbidities (Charlson Comorbidity Index), physical- and mental-health-related quality oflife (component summary scores from the 36-Item Short Form Survey), medication with antimalarial drugs,immunosuppressants, biologics and dosages of prednisone.

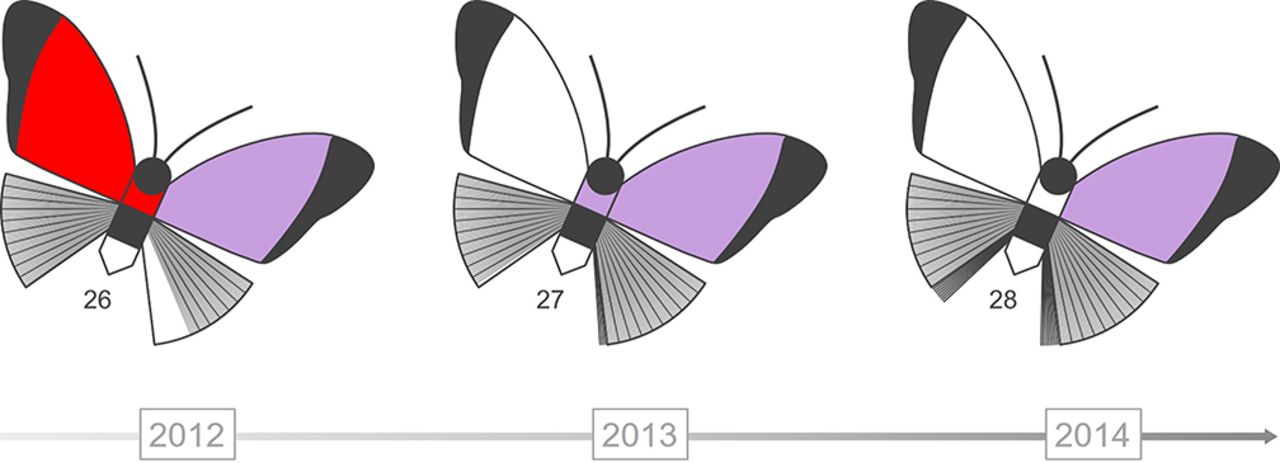
Evolution of the health status of an SLE patient over years through the butterfly tool
Conclusions We implemented an automated tool that transposes complex and heterogeneous clinical dataobtained from patients with SLE, into an intuitive visual medium. In addition to helping physicians to rapidlycomprehend the health status of SLE patients, this data visualization shall facilitate communication betweenphysicians, scientists, patients, and the public in general. Also, we believe it could help patients takeownership of their own condition, raise public awareness about SLE, and act as an incentive to furtherinvolve patients in research.
This is an open access article distributed in accordance with the Creative Commons Attribution Non Commercial (CC BY-NC 4.0) license, which permits others to distribute, remix, adapt, build upon this work non-commercially, and license their derivative works on different terms, provided the original work is properly cited, appropriate credit is given, any changes made indicated, and the use is non-commercial. See: http://creativecommons.org/licenses/by-nc/4.0/.