Article Text

Abstract
Background: The presence of “anti-DNA antibodies in abnormal titres” is a well established criterion for SLE classification, but there is no agreement on the performance of this test.
Objective: To study the correlation between clinical findings and five different solid and solution phase anti-DNA antibody assays.
Methods: 158 consecutively collected ANA positive sera were studied in a double blind fashion. Anti-DNA antibodies were determined by different solid phase assays (ssDNA-, dsDNA- specific ELISA, EliA anti-dsDNA assay, Crithidia luciliae assay), and by an experimental solution phase anti-DNA assay using biotinylated pUC18 plasmid, human, calf thymus, and E coli DNA. Antibody affinity was determined by surface plasmon resonance. Clinical data were obtained independently of the laboratory analyses and later related to the anti-dsDNA findings.
Results: Anti-dsDNA antibodies were most frequently detected by ELISA, but were not specific for SLE as they were present in up to 30% of other disease groups. Those detected by the Crithidia luciliae assay were predictive for SLE, while antibodies binding in solution phase ELISA using the pUC18 correlated strongly with the Crithidia luciliae assay. Surface plasmon resonance analysis showed that antibody binding to pUC18 was not due to higher relative affinity for dsDNA in general, but apparently to specificity for that plasmid DNA. Serum samples from three patients with lupus nephritis were positive in both pUC18 solution phase and Crithidia luciliae assays.
Conclusions: Assay principle selection is decisive for the detection of clinically significant anti-DNA antibodies. Revision of the anti-DNA antibody criterion in the SLE classification may be needed.
- anti-DNA antibodies
- affinity
- surface plasmon resonance
- diagnosis
- systemic lupus erythematosus
- ACR, American College of Rheumatology
- CLIFT, Crithidia luciliae immunofluorescence test
- CT, calf thymus
- EliA, enzyme linked immunoassay
- ELISA, enzyme linked immunosorbent assay
- OD, optical density
- PBS, phosphate buffered saline
- PBST, phosphate buffered saline-Tween
- RA, rheumatoid arthritis
- SLE, systemic lupus erythematosus
- SPADE, solution phase anti-dsDNA ELISA
- SPR, surface plasmon resonance
- UCTD, undifferentiated connective tissue disease
- VORD, various other rheumatic diseases
Statistics from Altmetric.com
- ACR, American College of Rheumatology
- CLIFT, Crithidia luciliae immunofluorescence test
- CT, calf thymus
- EliA, enzyme linked immunoassay
- ELISA, enzyme linked immunosorbent assay
- OD, optical density
- PBS, phosphate buffered saline
- PBST, phosphate buffered saline-Tween
- RA, rheumatoid arthritis
- SLE, systemic lupus erythematosus
- SPADE, solution phase anti-dsDNA ELISA
- SPR, surface plasmon resonance
- UCTD, undifferentiated connective tissue disease
- VORD, various other rheumatic diseases
The potential to generate measurable B cell and T cell autoimmunity to DNA and nucleosomes is an inherent property of the normal immune system.1–7 Thus, if B cells with sufficient affinity bind nucleosomal DNA and process and present nucleosome derived peptides in the context of HLA class II to T cells committed to respond to such peptides, these B cells may clonally expand and affinity maturate towards double stranded (ds)DNA. Several experimental and descriptive results are consistent with this presumption.8,9
According to present paradigms, B and T cell autoimmunity to nucleosomes, and particularly to their individual components—dsDNA and histones—are important in establishing the diagnosis systemic lupus erythematosus (SLE),10 and also because of the potential of anti-DNA antibodies to induce nephritis.11–15 The main problems in this context are that the aetiology of SLE remains unknown and has a highly diverse clinical picture, whereas anti-dsDNA antibodies can be produced by people without SLE. SLE may thus represent a heading for a wide variety of intrinsically unrelated disease manifestations, and not a single disease entity.
It is therefore important to reconsider the clinical impact of anti-DNA antibody subpopulations, and to determine whether specificity for DNA structures other than simply ssDNA/dsDNA and intrinsic affinities are important to conceive a better understanding of their role in SLE.
Several comparisons of anti-DNA antibody measuring assays have been performed over the past 25 years.16–22 These studies included patients mostly from preselected diagnostic groups, and thus actively excluded antibody populations in people with other autoimmune or non-autoimmune disorders. Screening for antibodies in unselected sera and subsequently defining a diagnosis in antibody positive subjects represents a clinically more relevant approach, a strategy followed in this study.
MATERIALS AND METHODS
Patients, sera, and the ANA assay
One hundred and fifty eight consecutively collected antinuclear antibody (ANA) positive sera were included. These sera had been sent to the Department of Immunology and Transfusion Medicine for ANA determination, which was considered clinically indicated by the physician requesting the analysis.
IgG ANAs were determined by an ANA screening enzyme linked immunosorbent assay (ELISA; Pharmacia Diagnostic, Freiburg, Germany). The strength is given as an optical density (OD) ratio of the patient sample and a weakly positive reference antibody, as recommended by the manufacturer. Cut off was set to a ratio of 1.4 in agreement with in-house determination23 and determinations in other European centres using this assay. A cut off ratio of 1.4 represents a value approximating the cut off titre value for the indirect immunofluorescence HEp-2 test in a comparison analysis, although for some sera high ANA titres may be seen in the HEp-2 test (data not shown). This may be due to the simultaneous presence of other ANA specificities detected by the HEp-2 test, but where the corresponding nuclear antigens are not included in the spectrum of antigens used in the ELISA for ANA determination because such specificities may be regarded as clinically insignificant. This makes direct comparison of titres (in HEp-2) and ratios (in ELISA) difficult.23
An experienced rheumatologist, who was aware of the positive ANA result but was unaware of all the other analytical results, examined the clinical records of all subjects included and attempted to reach a classifying diagnosis on the basis of their symptoms. For the classification of SLE, the 1982 American College of Rheumatology (ACR) criteria were used,24 but with the exclusion of anti-dsDNA antibodies. Thus only patients fulfilling at least three clinical criteria were classified as having SLE as all were ANA positive. Classification of patients with rheumatoid arthritis (RA) followed the 1987 ACR criteria,25 classification of patients with Sjögren’s syndrome followed the preliminary European criteria,26 and fibromyalgia was characterised according to Wolfe27; patients with typical symptoms, but not satisfying the required number of criteria in any of these criteria sets were classified as undifferentiated connective tissue disease (UCTD), while nine other patients with inflammatory rheumatic diseases (giant cell arteritis (two patients), Wegener’s granulomatosis (two), mixed connective tissue disease (one), CREST/scleroderma (two), dermatomyositis (one), drug-induced lupus erythematosus (one)) were grouped as various other rheumatic diseases (VORD). The remaining patients were grouped as having no apparent systemic rheumatic disorders, and were in this study provisionally denoted “normal subjects” to separate them from those with systemic autoimmune disorders. This group contained the following disorders (number observed): hepatitis/hepatitis B (two), angina pectoris (one), apnoea syndrome (one), arthralgia/lumbago (twelve), asthma/bronchitis (two), cataract/cornea bleeding, (four) claudicatio intermitting (one), cerebrovascular accident (one), epilepsy (one), primary erythematosus nodosum (one), fibromyalgia (six), haematuria (one), headache (one), hypothyroidism (one), urinary tract infections (two), mamma/kidney cancer (two), meniscus rupture (one), migraine (one), myasthenia gravis (one), panniculitis (one), psoriasis (two), rash (one), urine incontinence (one), observation (nine), periorbital oedema (one), Stevens-Johnson syndrome (one), newborn (SLE offspring (one)). The study was approved by the regional ethical committee.
Antigens
Human, calf thymus (CT), and E coli ssDNA and S1 nuclease digested dsDNA were prepared as described previously.28 The cloning vector pUC18 (Amersham Pharmacia Biotech) was processed into three forms: circular (mainly supercoiled but partially open circular), and BamH1/S1 nuclease digested (linear dsDNA), the latter also converted to ssDNA by boiling and chilling. All the DNA preparations were purified by phenol/chloroform extraction and ethanol precipitation. The DNA preparations were devoid of proteins according to Coomassie stained sodium dodecyl sulphate-polyacrylamide gels (data not shown). Oligonucleotides, 32 bases long (single stranded oligonucleotides with the sequence 5′-GTC TGT CTA CTT TAC TTG CCT AAT CTA GCT AG-3′, or the corresponding double stranded variant), were synthesised and used as ligands in the surface plasmon resonance studies described below. The sequence of the oligonucleotide derived from a non-coding region in the immunoglobulin heavy chain locus of the human genome.
Anti-DNA assays
All the assays used in this study were configured to detect IgG antibodies only.
IgG antibodies to ssDNA and dsDNA
IgG antibodies to ssDNA and dsDNA were determined and quantified by widely used commercially available and internationally validated anti-DNA antibody kits (Varelisa, Pharmacia). The cut off values were determined through a continuously running internal quality assessment programme, as recently described.23 Lot to lot variation of analytical ELISA based kits, relevant to determination of cut off values, was examined and adjusted when necessary by internal and external reference antibodies. Through our participation in national and international (UK NEQUAS, http://www.uknequas.org.uk) quality assessment programmes, our selected cut off values were similar to those of other laboratories participating in these quality programmes. A result was regarded positive at ⩾55 units for both the anti-ssDNA and anti-dsDNA ELISAs.
Crithidia luciliae immunofluorescence test (CLIFT)
The CLIFT was performed as described.29 A positive result was defined at titres ⩾10.
Fluorescence enzyme linked immunoassay for IgG anti-dsDNA: the EliA test
The fluorescence enzyme immunoassay for IgG anti-dsDNA, the EliA test (Pharmacia), is a fully automated assay processed using UniCap100 (Pharmacia) as recommended by the manufacturer.30 The EliA anti-dsDNA test is a solid phase, indirect assay principally similar to an ELISA, claimed to detect anti-DNA antibodies with higher avidity than those detected by ELISA (see http://www.diagnostics.com for information). The DNA used is a plasmid dsDNA, which is coated to a solid support. Serum samples were diluted 1/101, using the diluent supported by the manufacturer, and the assay was run automatically according to their instructions. Both diluted sera and the conjugate were incubated for 30 minutes. Bound human anti-dsDNA antibodies are detected by using mouse antihuman Fcγ antibody conjugated with β-galactosidase and 4-methylumbelliferyl-β-d-galactoside as substrate. The wells were washed with a stringent washing buffer, which dissociates and thus avoids detection of low avidity antibodies. A six point standard curve, calibrated against WHO reference sera, was used for quantitative measurements. Results are given as international units (IU). A positive result was defined at ⩾20 IU. The assay had a detection limit of 0.5 IU, and was linear up to 400 IU (for the lot used in this study). For values above 400 IU, the sera were retested at higher serum dilutions.
Solution phase anti-dsDNA ELISA (SPADE)
This assay measures antibody binding to DNA in solution using biotinylated DNA, as originally described, and denoted SPEED, by Radic et al.31 Biotinylation of DNA was carried out as recommended by the manufacturer (Pierce Chemical Company). Each of human, CT, E coli, and pUC18 DNAs (1 μg/μl H2O) were mixed with equal volumes of EZ-Link photoactivable biotin (1 μg/μl H2O) on ice and irradiated for 3 minutes using a 275 W sun lamp at a distance of 8 cm from the light source. The biotinylated DNA molecules were subsequently purified by 2-butanol extraction and ethanol precipitation.
SPADE was performed by mixing 0.5 μg of the various DNA molecules with serially diluted serum samples (solution phase step). After incubation for 30 minutes, the mixtures were added to microtitre plates (Nunc MaxiSorp, Nunc, Denmark) coated over night at 37°C with 50 μl streptavidin (5 μg/ml in phosphate buffered saline (PBS). After incubation for 30 minutes, the plates were washed three times with PBS, 0.05% Tween 20 (PBST), and incubated for 1 hour with horseradish peroxidase conjugated antimouse or antihuman Fcγ antibodies (Sigma) in PBST. After washing the plates, substrate (o-phenylenediamine dihydrochloride; Sigma) was added. The reaction was stopped after 30 minutes by adding 1 M HCl. The reaction was read at 490 nm. Checkerboard titration, using serial dilutions of both sera and biotinylated DNA molecules, was performed to optimise the assay system (data not shown). Titres for antibody binding to each test DNA antigen were established as the serum dilution giving 30% of maximum binding of a positive reference serum binding human dsDNA.1,28
Surface plasmon resonance (SPR)
Affinities of anti-DNA antibodies were determined by SPR (Biacore AB, Uppsala, Sweden). Streptavidin coated chips (Biacore) were loaded with biotinylated 32-mer single or double stranded oligonucleotides or biotinylated circular pUC18 to give about 1000 (oligos)–4000 (pUC18) response units. SPR was performed using twofold dilutions (four steps) of human oligoclonal IgG in PBS; the highest concentration was about 1000 nmol/l of the individual antibodies (see below for calculations). The samples (50 μl each) were injected over 5 minutes. This was followed by a 4 minute dissociation period, where PBS was injected over the chip. Background binding was subtracted by passing the diluted antibodies over an empty chip. After each cycle, the chips were stripped by injecting 1 M NaCl, glycine/HCl, pH 4.3. For calculations, we eliminated the first part of the association and the dissociation phases, because these parts of the curves may be affected by the buffer changes (mass transport phenomenon).
The ka/kd determination by SPR is dependent on antibody concentration. In this study, we purified IgG on protein G-Sepharose to eliminate potential DNA binding proteins in human sera that could interfere with the SPR measurements. The exact IgG anti-DNA antibody concentrations derived from the sera were difficult to establish. We therefore determined titres versus IgG concentration of the murine monoclonal anti-DNA antibodies denoted DNA 6, 163p77, 163p64.1, and 452s46, all binding both ssDNA and dsDNA as determined by competition ELISA (see Krishnan et al32 and references therein), and, extrapolating from this information, provisionally determined the concentrations of specific human IgG anti-DNA antibodies related to their titres. Although exact affinities cannot be determined by this approach for human antibodies, the relative affinities of each antibody for the different DNA antigens can be determined. Affinities (ka/kd) and Kd were calculated using the BIA evaluation 3.0 calculation program.
Statistics
Differences between values for the various groups were analysed with Fisher’s exact test for dichotomous measures and by analysis of variance for continuous variables, while correlations were estimated by Spearman’s rank test coefficient. All analyses were performed with the use of SPSS (version 11.0). Resulting p values <0.05 were considered to indicate significance.
RESULTS
Anti-DNA antibody detection comparing different solid phase assays
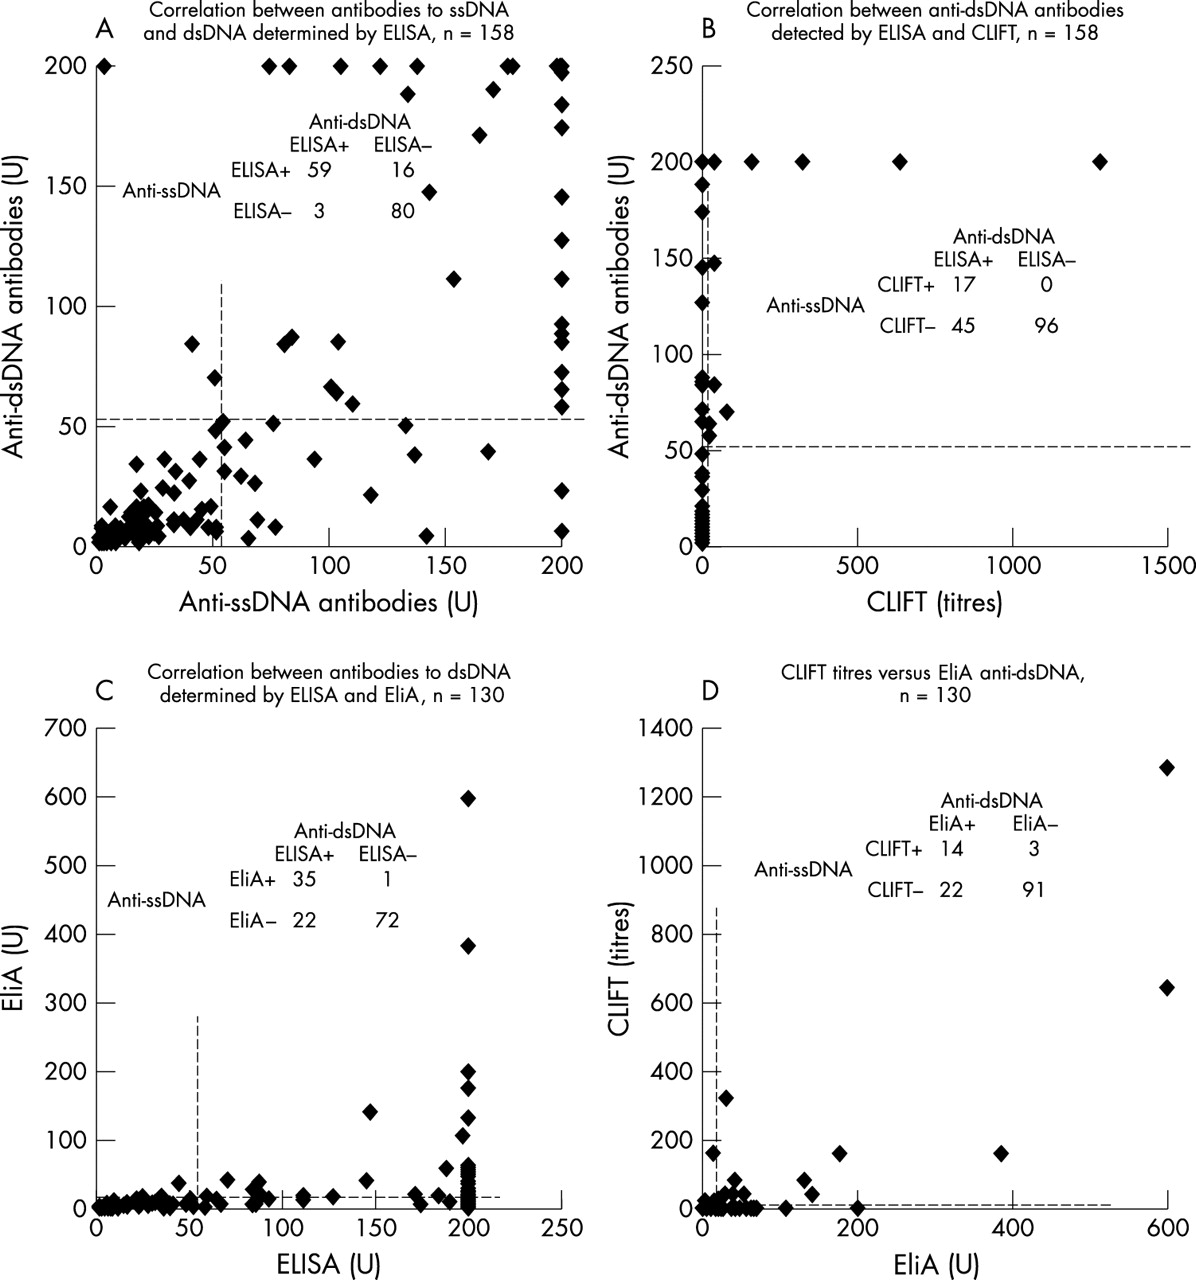
Of 158 ANA positive sera, 75 (47%) were positive for anti-ssDNA antibodies, while 62 (39%) contained antibodies to dsDNA, as determined by solid phase ELISAs (fig 1A). Most of the sera were anti-ssDNA/dsDNA double positive (59, 37%) or double negative (80, 51%). Seventeen (11%) of the sera were positive in the CLIFT assay. All these were dsDNA ELISA positive (fig 1B).

Consecutively collected ANA positive sera were examined for anti-DNA antibodies by different solid phase assays. Correlations are shown for anti-ssDNA and anti-dsDNA as detected by solid phase ELISA (rs = 0.4, p = 0.002) (A); anti-dsDNA antibodies detected in dsDNA ELISA versus CLIFT (rs = 0.11, p = 0.4) (B); dsDNA ELISA versus EliA dsDNA assay (rs = 0.55, p = 0.001) (C); and CLIFT versus EliA dsDNA assays (rs = 0.58, p<0.0001) (D). Inserted in each figure (A–D) are 2×2 tables showing the number of patients. The cut off values are 55 (U), 20 (U), and 10 (titre), for ELISA ssDNA/dsDNA, EliA dsDNA and CLIFT, respectively.
Of these sera, 130 were available in sufficient amounts and analysed using the EliA anti-dsDNA assay. Figure 1C shows that 57 (44%) of the 130 sera were positive in the solid phase dsDNA ELISA. Of these, 35 (61%) were positive in the EliA test. One serum sample contained antibodies binding in the EliA test, but not in the ELISA (fig 1C).
Of the 17 sera positive in the CLIFT, 14 (82%) were positive in the EliA dsDNA assay (fig 1D).
SPADE
Five ANA positive, anti-ssDNA/dsDNA negative sera, eight sera positive for anti-dsDNA antibodies by ELISA, and 12 sera positive in the CLIFT, were tested against biotinylated ssDNA and dsDNA derived from human, CT, or E coli, and against circular or linear pUC18 dsDNA or ssDNA.
Sera having ELISA positive anti-dsDNA antibodies that were negative in CLIFT bound dsDNA and ssDNA from both prokaryotic and eukaryotic origin, but not circular pUC18 dsDNA (figs 2A and B) with one exception, serum 108, which possessed a relative titre of 74 against circular pUC18. All 12 sera that were positive in the CLIFT, on the other hand, bound all test antigens, including circular pUC18 (figs 2C, 2D, and 2E). Antibody binding to linearised pUC18 ssDNA/dsDNA correlated with binding to circular pUC18 DNA (data not shown). ANA positive sera that were negative for DNA in solid phase ELISA did not bind to any of the biotinylated test DNA molecules (fig 2F). Thus, CLIFT positive, but not CLIFT negative antibodies recognised pUC18 dsDNA in solution. To investigate whether intrinsic affinity is a critical measure for antibodies to bind solution phase pUC18 DNA, antibody affinities were determined by SPR (Biacore).

Groups of sera, selected as ELISA anti-dsDNA antibody positive, CLIFT negative (n = 8, A, B); anti-dsDNA antibodies positive in ELISA as well as in CLIFT (n = 12, C-E); or ANA positive, anti-ssDNA/dsDNA antibody negative sera (n = 5, F), were analysed in solution phase, biotinylated DNA ELISA (SPADE) using human, CT, E coli ssDNA/dsDNA or circular pUC18 dsDNA as antigens. Mean OD 490 (SD) for each group of sera at each serum dilution is presented for antibody binding to human dsDNA and ssDNA, and pUC18 circular and linear dsDNA (A, C, F). Correlation between CLIFT and relative pUC18 titres in all 25 sera included in these analyses is presented (E). Mean titres (SD) of anti-DNA antibodies from CLIFT negative (B) and CLIFT positive (D) sera against circular pUC18 dsDNA, human, calf thymus or E coli ssDNA/dsDNA demonstrate that in CLIFT positive sera, but not negative ones, antibodies are detected that recognise structures unique to pUC18 dsDNA (B, D).
Intrinsic affinities of anti-DNA antibodies as determined by SPR
The data presented above show that a hierarchy exists of anti-DNA antibodies reacting in ELISA, EliA, CLIFT, and SPADE with increasing stringency in that order.
SPR analysis allows measurement of intrinsic affinities and is suitable for investigating whether antibody binding in the different assays depends on antigen recognition in the sense of relative affinities for certain DNA structures, or as an all or none recognition of unique DNA structures, as discussed by Karush.33 IgG molecules from three CLIFT positive and three CLIFT negative, ELISA dsDNA positive sera (table 1) were analysed with the Biacore instrument. Affinity was determined for single stranded or double stranded oligonucleotides, or circular pUC18 plasmid DNA. Data in table 1 show that all six antibodies bound both ssDNA and dsDNA oligonucleotides. However, only antibodies that bound in CLIFT (antibodies 144, 148, and 160) recognised dsDNA oligonucleotides and circular pUC18 dsDNA (table 1, figs 3A and B for antibody 160). Thus, the strong association of antibody binding in CLIFT and pUC18 SPADE was confirmed in the SPR analysis. Binding to pUC18 did not correlate with affinity for dsDNA oligonucleotides, as those antibodies binding with the highest affinity to dsDNA oligonucleotides (4.16×10⁹ and 1.29×10⁹ for antibodies 75 and 135, respectively, table 1) did not bind pUC18 (figs 3C and 3D for antibody 135).
Affinity for circular pUC18 dsDNA does not correlate with affinity for dsDNA oligonucleotides, but with antibody binding to Crithidia luciliae DNA

Surface plasmon resonance sensograms obtained at different concentrations of IgG anti-DNA antibodies interacting with immobilised 32 bp oligonucleotide or circular pUC18 dsDNA. IgG anti-DNA antibodies from CLIFT positive serum 160 binds both DNA ligands, while those from CLIFT negative serum 135 bind the oligonucleotide, but not pUC18. See table 1 for extended data, and “Materials and methods” for experimental details.
Clinical data in relation to anti-DNA antibody assay results
Based on clinical record information patients were classified into various disease groups (table 2). In 59 patients (37%), no classifying rheumatological diagnosis could be made at that time and this was the largest group of ANA positive patients. The strength (as OD ratio) of the ANA test did not vary significantly between all groups (p>0.1). Anti-ssDNA antibodies were detected most frequently in patients with SLE (82%) and least in patients with UCTD (22%).
Results of ANA and anti-dsDNA testing by various methods grouped according to disease classification in a randomly collected cohort of ANA positive subjects. Figures represent mean values (SD) unless otherwise indicated
Anti-dsDNA antibodies determined by solid phase ELISA were more frequently present in patients with SLE than in all other groups combined (79% v 26%; p<0.001) as were anti-dsDNA antibodies determined with the EliA anti-dsDNA assay (44% v 16%, p<0.001) and CLIFT (41 v 1%, p<0.0001). Thus, a positive result in the two last assays discriminated better between SLE and the other groups with CLIFT (and pUC18 SPADE, which correlated with CLIFT) being the most precise SLE related test (table 3). The titre of anti-dsDNA antibodies, as determined in the different assays, did not vary significantly between the groups, except for CLIFT titres (table 2).
Diagnostic value for SLE of anti-dsDNA antibodies, as detected by the various methods in sera of randomly collected ANA positive subjects
When comparing patients with SLE with or without anti-dsDNA reactivity in CLIFT/pUC18 SPADE, we found that CLIFT/pUC18 SPADE positive patients with SLE were younger (29.2 v 47.0 years; p<0.001), had higher modified SLE Disease Activity Index (M-SLEDAI) scores (5.47 v 2.5; p = 0.38), and had higher EliA anti-dsDNA levels (153.6 IU v 17.1 IU; p = 0.009), while disease duration (94.8 v 100.1 months, p = 0.8) and ELISA anti-dsDNA levels (167 IU v 173 IU) were similar in both groups. Three of 39 patients with SLE had active renal disease (increasing proteinuria and/or active urinary sediment) and all three possessed anti-dsDNA antibody reactivity by CLIFT and pUC18 SPADE.
DISCUSSION
Although anti-dsDNA antibodies detected by any of the available methods can be used in classifying patients with SLE,24 our data clearly demonstrate that IgG isotype anti-dsDNA antibodies in abnormal titres are not in themselves distinctive for SLE. This is in accordance with new insight into the cellular and molecular origins of overt autoimmunity to DNA and nucleosomes.9 For example, in situations definitively not compatible with SLE, such as infections, drug intake,10 or single genetic aberrations (see below), B and T cell autoimmunity to DNA and nucleosomes may be initiated (reviewed by Rekvig and Nossent9). This indicates that difficulties will arise when one uses “anti-DNA antibodies in abnormal titres” to classify SLE and suggests that only subpopulations of anti-dsDNA antibodies may be unique to SLE.
Antibody specificity for a given antigen is determined by its relative affinity for that antigen compared with other test antigens. This may be true also for different DNA structures.34 This important aspect is not fully implemented in our analytical strategies for characterising anti-dsDNA antibodies. Thus, both affinity as well as specificity for unique DNA (and possibly non-DNA11,12) structures may have important impact on selection of anti-dsDNA antibody assays. There are problems with all currently used anti-DNA assays. Assays using immobilised DNA have two inherent problems: (a) antibodies with low affinity may bind, and (b) the structure of DNA may be altered when DNA interacts with a solid support. This makes solid phase based assays questionable for clinical use, at least as the sole anti-DNA assay. Among the solution phase anti-DNA antibody assays, Farr is the most widely used, which generally measures antibodies with higher intrinsic affinity. In the Farr assay the ka is drastically reduced as compared with solid phase assays like ELISA.35 Potential disadvantages of the Farr assay are that we principally do not always know whether antibodies or other DNA binding serum proteins account for precipitation of radiolabelled DNA, and the isotype of the antibodies remains unknown.36–38
Our data show a certain hierarchy of IgG isotype anti-DNA antibodies and corresponding assay systems, with antibodies detected at higher frequency by ELISA than by EliA, CLIFT, and SPADE, in that order. This indicates that there exist subpopulations of anti-dsDNA antibodies that correlate with SLE, even though the SLE diagnosis is not very precise and based on clusters of aetiologically apparently unrelated manifestations.24 These subpopulations are detected by CLIFT or by pUC18 SPADE. The reason why these techniques, more than others, detect SLE related anti-DNA antibodies is not known, but might be explained by the higher avidity of antibodies detected in these assays compared with the others implemented in this study.
To investigate this, CLIFT and ELISA dsDNA positive sera were selected and applied to SPR. The data deriving from these analyses are interesting as all six antibodies bound ssDNA and dsDNA oligonucleotides, whereas only three bound pUC18 and Crithidia DNA. Thus, the strong association between CLIFT and pUC18 SPADE was confirmed in the SPR analysis. Importantly, antibody binding in CLIFT or pUC18 SPADE was independent of the magnitude of affinity for dsDNA oligonucleotides, indicating recognition of pUC18 or Crithidia luciliae DNA structures, which may be unique to these molecules.
Although the exact determination of antibody affinities for these DNA structures requires exact concentrations of the antibodies used in the SPR, the relative affinities for the different DNA ligands can be determined for each antibody without having this exact information. Another, theoretically more accurate approach would be to purify anti-dsDNA antibodies by their affinity for DNA coupled to cellulose, for example, and determine the concentration of these antibody preparations. There are, however, several arguments for purifying IgG rather than anti-dsDNA antibodies for these measurements. (1) purifying anti-dsDNA antibodies by their affinity for DNA would imply binding to the SPR chips of clinically insignificant IgM antibodies also, which may have low affinities but high avidities, a fact that could influence the outcome of the study10. (2) Specific purification of anti-dsDNA antibodies by affinity chromatography using a dsDNA-cellulose column may result in selective purification of those antibodies with the highest affinities, with loss of the low affinity antibodies in the washing procedure. This was actually demonstrated in pilot experiments in the SPR assay, as low affinity antibodies dissociated rapidly from the chips when they were washed with PBS (see for example the initial dissociation part of the curves presented in figs 3A and B). (3) Inaccuracies with respect to concentrations of the IgG anti-dsDNA antibodies do not seriously affect the affinity constant, while the dissociation constant is unaffected. This can be demonstrated using the simulation program provided with the Biacore instrument. (4) The reason for analysing affinities by the SPR derived from the observations obtained in the SPADE, where CLIFT positive antibodies bound pUC18 in solution (pUC18 SPADE), while CLIFT negative anti-dsDNA antibodies bound in solid phase anti-dsDNA assays. As this opened the way for development of an automated version of a CLIFT analogue assay, it was important to confirm this binding pattern by measuring the relative differences in affinity for the different DNA molecules. The results of these analyses using three pUC18 SPADE positive and three negative antibodies, all binding dsDNA in solid phase ELISA, completely corresponded with the binding patterns in solid phase ELISA or EliA assays and the CLIFT.
That the CLIFT or pUC18 SPADE detected high avidity anti-dsDNA antibodies in general is in the present study largely being excluded because anti-dsDNA antibodies binding pUC18 did not possess higher intrinsic affinity than those anti-dsDNA antibodies binding ds-oligonucleotides only (see table 1 for details). Alternatively, and consistent with the affinity data presented in table 1, DNA in the CLIFT or pUC18 SPADE may contain structures specifically recognised by certain anti-DNA antibody subpopulations.
The correlation between the CLIFT and the SPADE test using pUC18 DNA can be explained by the fact that the two types of DNA share a unique feature with nucleosomal DNA that may be important for anti-dsDNA classification. Nucleosomal DNA is tightly wrapped around the histone core such that it is highly bent. Similar to this, kinetoplast DNA has one of the greatest known degrees of stable curvature,39 and the pUC plasmid DNA has a pronounced curve near the promoter of the antibiotic resistance gene.40 Thus, the assays may disclose antibody binding to DNA structures that are only formed by strong deformations from the more common linear B helical DNA structure. Thus, antibodies recognising the kinetoplast DNA of the haemoflagellate Crithidia luciliae may specifically bind unique structures shared by nucleosomes, kinetoplast DNA, and circular pUC18 plasmid DNA. This stringent antibody specificity may well reflect structures on eukaryotic nucleosomal DNA that induce such immune responses.
The diagnostic impact of anti-DNA antibodies on SLE thus depends on the assays used for their detection.41–44 There are surprisingly few studies that use a “blinded” screening approach that may provide answers to the question: Does the diagnostic impact of antibodies correlates with discrete binding patterns, avidity, molecular specificity,33 or purely with titres. Our patient material was not completely unselected as we chose to study sera with positive results upon ANA screening at a tertiary facility. The fact that in nearly 50% of these ANA positive subjects a classifying diagnosis could not be made indicates that selection bias was not a large confounder. The results presented indicate that these IgG anti-DNA antibody assays allow for either a high diagnostic sensitivity or a high diagnostic specificity for SLE, but not both.45 Thus, the question whether it is better to err on the false negative rather than on the false positive side remains unanswered here.
We observed a higher incidence of antibody specificity for soluble, circular pUC18 or Crithidia luciliae kinetoplast DNA in SLE than any of the other solid or solution phase assays. While purified Crithidia luciliae kinetoplast DNA is not easily available for routine use, SPADE using pUC18 may be of interest in the development of an objective, automated quantitative anti-dsDNA assay that allows a higher diagnostic precision than a conventional ELISA.
If only anti-DNA antibodies with unique binding patterns correlate with SLE and its manifestations, then such anti-DNA antibodies should be included in SLE classification as the anti-DNA antibody criterion. Our data do not, however, allow a definite conclusion about the pathogenic impact of anti-dsDNA antibodies detected by the various assays. Progressive development of pathogenicity due to somatic mutations of the anti-dsDNA antibodies may require sustained stimulation of DNA-specific B cells, possibly caused by genetic defects.46–54 If longstanding stimulation and affinity maturation create pathogenic anti-dsDNA antibodies, these may deposit in, for example, kidneys, that become diseased and show proteinuria. Although genetic defects disposing for sustained anti-dsDNA antibody production have been described in mouse models,46–54 a search for similar defects in human SLE is awaited. Still, however, we do not know what constitutes the distinction between pathogenic and epiphenomenal anti-DNA antibodies.
From basic knowledge obtained in studies of regulation of tolerance and immunity to DNA and nucleosomes, we predicted9 that anti-dsDNA antibodies themselves cannot be diagnostic for SLE. From the combined assay and clinical parameters described in this study, we provide data indicating that this may be correct. The pathogenic potential of an anti-DNA antibody may depend on qualities other than pure affinity/avidity or specificity for DNA structures, because patients with SLE may have nephritis irrespective of whether they have or have not antibodies detected by CLIFT and circular pUC18 in solution. However, from the data presented here, assay principle selection may be implemented in the ACR criteria for SLE to detect at least diagnostically significant anti-DNA antibodies.
Acknowledgments
This study was supported by grants from Norwegian Research Council and Signe Johansen Fund. The pUC18 plasmid was kindly prepared by Dr Signy Bendiksen, and the murine monoclonal anti-DNA antibodies were kindly provided by Dr T N Marion.