Article Text

Abstract
Objective Epstein–Barr virus (EBV) has for long been associated with systemic lupus erythematosus (SLE). In this study, we investigated the levels of latent and lytic antigen EBV-specific T-cells and antibodies in SLE patients.
Methods T cells were analyzed by flow cytometry and antibodies were analyzed by enzyme-linked immunosorbent assay.
Results SLE patients showed a significantly reduced number of activated (CD69) T-cells upon ex vivo stimulation with EBV nuclear antigen (EBNA) 1 or EBV early antigen diffuse (EBV-EA/D) in whole blood samples compared with healthy controls. Also, a reduced number of T-cells from SLE patients were found to produce interferon-γ upon stimulation with these antigens. Importantly, responses to a superantigen were normal in SLE patients. Compared with healthy controls, SLE patients had fewer EBV-specific T-cells but higher titres of antibodies against EBV. Furthermore, an inverse correlation was revealed between the number of lytic antigen EBV-specific T-cells and disease activity of the SLE patients, with high-activity SLE patients having fewer T-cells than low-activity SLE patients.
Conclusions These results indicate a limited or a defective EBV-specific T-cell response in SLE patients, which may suggest poor control of EBV infection in SLE with an immune reaction shift towards a humoral response in an attempt to control viral reactivation. A role for decreased control of EBV as a contributing agent in the development or exacerbation of SLE is proposed.
- Systemic lupus erythematosus
- Epstein-Barr virus
- T-cells
- antibodies
This is an Open Access article distributed in accordance with the Creative Commons Attribution Non Commercial (CC BY-NC 3.0) license, which permits others to distribute, remix, adapt, build upon this work non-commercially, and license their derivative works on different terms, provided the original work is properly cited and the use is non-commercial. See: http://creativecommons.org/licenses/by-nc/3.0/
Statistics from Altmetric.com
Key messages
-
SLE patients have decreased numbers of EBV-specific T cells.
-
SLE patients have increased levels of EBV-specific antibodies.
-
These results indicate reduced control and frequent reactivation of EBV in SLE.
Introduction
Systemic lupus erythematosus (SLE) is an autoimmune systemic disease that usually presents in women (90% of cases) in the reproductive age. SLE is a chronic disease that is characterised by flares of disease activity alternating with remission. The aetiology of SLE is believed to be multifactorial, comprising genetic and environmental factors.1–5 Infections are believed to be a major environmental risk factor for SLE, including Epstein–Barr virus (EBV) infection.6–9
Primary EBV infection during childhood is mostly asymptomatic, but infection in adolescence may cause infectious mononucleosis (IM).10 ,11 Following primary infection, EBV persists in its latent stage within memory B-cells and expresses a limited number of genes, including EBV nuclear antigen (EBNA) 1.12–14 Occasionally, EBV is able to reactivate and switch to a lytic cycle, resulting in viral gene expression and viral genome replication.15 This gives rise to release of new virus particles capable of infecting other cells.14
In immune competent individuals, an immune response is initiated during EBV infection, which keeps the infection under control and restrains EBV to its latent stage. Cell-mediated immunity is fundamental in controlling the EBV infection and keeping EBV from entering lytic replication16 ,17 as CD8 T-cells can eradicate infected B cells.17 Interferon-gamma (IFN-γ) is suggested to play a key role in this context as it has been demonstrated in high plasma concentrations in patients with IM, probably due to increased numbers of activated T-cells.18 Moreover, a humoral immune response is initiated during EBV infection. In early stages of infection and during reactivation/reinfection with EBV, antibodies against various lytic cycle antigens such as EBV early antigen diffuse (EBV-EA/D) are produced. IgG antibodies to the latent stage antigen EBNA1 develop later in infection and are detectable in the circulation of the host throughout life.19–22
Nearly all SLE patients (99.5%) and a large proportion of healthy adults (94.5%) are infected with EBV.23 However, studies have shown a reduced control of the EBV infection in SLE patients with an increased number of latently EBV-infected cells6 and an abnormally high viral load in the peripheral blood mononuclear cells (PBMCs) of SLE patients.7–9 ,24 Furthermore, a serologic connection between EBV and SLE has been demonstrated by increased titres of antibodies to EBV antigens in SLE patients compared with healthy controls (HCs).23 ,25–37 Previous studies on EBV-specific T-cells are in discordance. Three individual studies have shown that SLE patients have fewer cytotoxic CD8 T-cells with a decrease in effector responses upon stimulation with EBV.24 ,38 ,39 On the contrary, Kang et al7 observed increased responsiveness of CD4 T-cells producing IFN-γ and only a tendency of a reduced EBV-specific T-cell response in SLE patients upon stimulation with EBV.
To elaborate on previously obtained results of EBV-specific T-cell responses in SLE patients and to assess whether the revealed poor control of EBV infection in SLE patients is an effect of an inadequate cell-mediated immune response against EBV, we have monitored T-cell immunity to EBNA1 and EBV-EA/D in SLE patients. Furthermore, we examined its relation to SLE disease activity and to EBV antibody status.
Materials and methods
SLE patients and HCs
Whole blood samples were collected in heparin and EDTA tubes (for ex vivo stimulation and lymphocyte counts/EBV PCR, respectively) from 27 SLE patients and 27 sex-matched and age-matched HCs. The blood samples from SLE patients were collected at the Department of Infectious Diseases and Rheumatology, Rigshospitalet, Copenhagen University Hospital, Denmark, and blood samples from apparently HCs were obtained from volunteers at Statens Serum Institut, Copenhagen, Denmark. All patients fulfilled internationally accepted classification criteria for SLE.40 Written informed consent for the studies was obtained from all patients in accordance with the protocol as approved by the Scientific Ethical Committee of the Capital Region of Denmark (no. H-A-2007-0114).
Four of the twenty-seven included SLE patients were found to have an unusually low number of T-cells (determined here as less than 3% of acquired leucocytes on the flow cytometer), indicating T-cell lymphopenia, and were excluded from the study to eliminate void measurements of misleading low T-cell responses. Furthermore, one SLE patient had an undefined viral infection at the time of inclusion and was also excluded from the study.
The clinical characteristics of the included 22 SLE patients and 22 sex-matched and age-matched HCs are outlined in table 1. The mean age for the SLE patients was 42.6 years and 95% were females, and the HCs had a mean age of 38.1 years and 91% were females. The range of the SLE disease activity index (SLEDAI) score was 0–22 with a lower quartile of 2, a median of 4 and an upper quartile of 7. SLE patients were subdivided into two groups consisting of 10 with low activity (laSLE) (SLEDAI <4) and 12 with high activity (haSLE) (SLEDAI≥4), divided by the SLEDAI median value.
Clinical characteristics of SLE patients
Ex vivo stimulation of whole blood samples with viral antigens
Heparinised whole blood samples were incubated with either recombinant mosaic EBNA1 (5 µg/mL, Escherichia coli-derived, EBV-271, Prospec Protein Specialist, Ness-Ziona, Israel) or recombinant EBV-EA/D (5 µg/mL, E coli-derived, EBV-272, Prospec Protein Specialist, Ness-Ziona, Israel) at 37°C for 24 h. Samples stimulated with staphylococcal enterotoxin B (SEB) (10 µg/mL, Sigma-Aldrich, St. Louis, Missouri, USA) or phosphate-buffered saline (PBS) were prepared in parallel as positive and negative controls, respectively. The negative control with PBS stimulation is used to determine baseline stimulation and thereby control if the T-cells are already activated before stimulation with EBV antigens. Brefeldin A (BFA) (10 µg/mL, Sigma-Aldrich, St. Louis, Missouri, USA) was added after 8 h of stimulation in order to inhibit cytokine secretion. After 24 h of stimulation, cold 20 mM EDTA (100 µL/mL) was added to the whole blood samples to stop the reaction and incubated for 15 min at room temperature.
The EBNA1 protein contains a glycine/alanine repeat domain, which results in inhibition of degradation of the protein by the proteasome of the host, functioning as an immune evasion mechanism of the virus.16 ,41 In order to assure processing and presentation of EBNA1 on antigen presenting cells, a mosaic version of the EBNA1 protein without this domain was used for ex vivo antigen stimulation of T-cells.
The EBV-EA/D antigen used for ex vivo antigen-stimulation of T-cells comprise only a fraction of the protein (C-terminal region amino acids 306–390) and is fused to a GST tag.
To facilitate comparability between results on SLE patients and HCs, each sex-matched and age-matched HC sample had the same lag time before stimulation with EBV antigens as the matched SLE patient. Furthermore, the HC with corresponding lag time was always analysed simultaneously with the SLE patient. The lag time was determined as the time period from blood collection until beginning of the stimulation with antigens, ranging from 44 to 130 min subsequent to collection.
Detection of immune responses by flow cytometry
CD69 is thought to be among the earliest induced surface markers upon activation of T-cells with detection of CD69 transcripts after less than an hour of stimulation,42 and following 2–3 h of stimulation, CD69 can be detected on the surface of cells reaching peak levels after 18–24 h.43 Thus, surface CD69 was chosen as a marker for activated T-cells. Furthermore, as IFN-γ is produced by both CD8 and CD4 T-cells during antigen-specific responses, and as it also is demonstrated in high plasma concentrations in patients with IM, IFN-γ production was chosen as an indicator of effector responses from antigen-specific T-cells.
All incubations were performed at room temperature, and all centrifugations were executed at 500×g for 5 min. All of the following volume indications are for 2 mL of stimulated whole blood.
Erythrocytes were initially lysed by incubation with FACS Lysing solution (13 mL, BD Fastimmune, Franklin Lakes, New Jersey, USA) for 10 min following centrifugation and decantation of supernatant. Next, the lymphocytes were permeabilised by incubation with permeabilising solution (9 mL, 0.1% w/v Tween20, 0.5% w/v paraformaldehyde in PBS) for 10 min and subsequent addition of washing solution (4 mL, 5% w/v filtrated calf serum, 0.5% w/v BSA, 0.07% w/v sodium azide). After centrifugation, the supernatant was decanted and washing solution (5 mL) was added, followed by another centrifugation and decantation of supernatant. Lymphocytes were subsequently stained with a mixture of allophycocyanin (APC)-conjugated anti-CD3, cyanine 5.5 peridinin chlorophyll (PerCP-Cy5.5)-conjugated anti-CD8, phycoerythrin (PE)-conjugated anti-CD69 and fluorescein isothiocyanate (FITC)-conjugated anti-IFN-γ (20 µL in total, BD Fastimmune, Franklin Lakes). A SEB-stimulated sample was furthermore stained with an isotype-specific control antibody mix (anti-CD3-APC, anti-CD8-PerCP-Cy5.5, IgG1-PE and IgG2a-FITC, BD Fastimmune, Franklin Lakes). This isotype control was included to control the staining and assess the level of non-specific background staining and autofluorescence. After staining for 1 h in the dark, lymphocytes were washed twice in 2 mL washing solution and then kept in fixation solution (1.5 mL, 1% w/v paraformaldehyde in PBS) at 4°C overnight. Flow cytometer analyses were performed by FACSCalibur flow cytometer and CELLQuest software (BD Biosciences, Franklin Lakes, New Jersey, USA). Before application of samples, fluorescence compensation was accomplished by the use of CaliBRITE Beads (BD FastImmune, Franklin Lakes). Data for 100000 CD3 events were analysed by use of FLOW JO software (Tree Star, San Carlos, California, USA). Intracellular cytokine measurements are in general low with only a few percentages of T-cells producing IFN-γ upon stimulation. However, inclusion of this very large number of T-cells (100 000 events) ensures that even low percentages account for a considerable number of cells. Gates were set on a SEB-stimulated blood sample and the same gates were applied in all flow cytometry data analyses. For each measurement, the results obtained from the negative control with PBS stimulation were subtracted.
A sample was considered positive for activated (CD69) T-cells if the percentage of CD69 T-cells was higher than the cut-off value of 1.00% (mean) and was considered to have a high number of activated T-cells if the percentage of CD69 T-cells was above the high cut-off value of 3.70% (mean+2×SD).
Lymphocyte count kit
Percentages and absolute counts of lymphocytes in EDTA whole blood samples were determined for eight of the included SLE patients and the sex-matched and age-matched HCs using BD multitest IMK kit (BD Biosciences, Franklin Lakes) according to the manufacturer's instructions.
Detection of EBV antibodies in plasma by ELISA
All incubations and washings were performed at room temperature on a shaking table using 100 µL in each well for incubations and 250 µL in each well for washing and blocking. TTN buffer (0.025 M Tris, 0.5% Tween 20, 0.15 M NaCl, pH 7.4) was used as blocking, incubation and washing buffer. Recombinant EBV-EA/D (1.0 μg/mL, E coli-derived, EBV-272, Prospec Protein Specialist, Ness-Ziona, Israel) or recombinant full-length EBNA1 (0.5 μg/mL, MyBioSource, #MBS318777, California, USA) was coated onto NUNC PolySorp microtitre plates (Thermo Fisher Scientific, Roskilde, Denmark) in carbonate buffer (50 mM sodium carbonate, pH 9.6). After coating overnight at 4°C, plates were washed 3×1 min, followed by blocking for 30 min. Subsequently, plasma diluted 1:20 for IgA/IgM detection and 1:100 for IgG detection were incubated for 1 h. Each sample was tested in duplicate in both coated and non-coated wells. After another three washes, the plates were incubated for 1 h with alkaline phosphatase (AP)-conjugated goat antihuman IgG/IgA/IgM (1:2000, Sigma-Aldrich, St. Louis, Missouri, USA). Following another three washes, immunoglobulins were quantified using p-nitrophenylphosphate (p-NPP) (1 mg/mL, Sigma-Aldrich, St. Louis, Missouri, USA) diluted in AP substrate buffer (1 M diethanolamine, 0.5 mM MgCl2, pH 9.8). The absorbance was read at 405 nm, with background subtraction at 650 nm, on a Versamax microplate reader (Molecular Devices, Sunnyvale, California, USA). For each sample, the blank values from the non-coated wells were subtracted. A standard curve was created for each assay using a high-titre plasma sample, and all absorbance values were normalised relative to this standard. A plasma sample was considered positive for EBV-EA/D and EBNA1 antibodies if the antibody binding was higher than the cut-off values (14.53, 2.98 and 22.78 arbitrary binding units regarding IgG, IgA and IgM EBV-EA/D antibodies, respectively, and 1.5, 18.38 and 8.27 arbitrary binding units regarding IgG, IgA and IgM EBNA1 antibodies, respectively). Cut-off values were determined as mean+2×SD, except for the cut-off value for EBNA1 IgG antibodies, which had an arbitrary cut-off value (as more than 90% of individuals are positive for these antibodies) of 1.5 arbitrary binding units (with the blank value being 0.001 arbitrary binding units).
Quantitative EBV PCR
Quantitative EBV PCR analyses of EDTA whole blood samples were performed on all included SLE patients and HCs. This was done using an absolute quantitative assay targeting a 105 bp region of the EBER-1 small RNA gene in EBV. The assay has a sensitivity limit of 200 copies/mL and is calibrated using the WHO international standard (NIBSC code 09/260) (NIBSC, Hertfordshire, UK).
Total nucleic acids were extracted from 200 μL of patient plasma sample on a MagnaPure 96 extraction robot (Roche Diagnostics A/S, Hvidovre, Denmark) using the MagNA Pure 96 DNA and Viral NA small volume kit (Roche Diagnostics A/S, Hvidovre, Denmark) and the ‘plasma small volume protocol’ choosing an elution volume of 100 μL.
Quantitative real-time PCR was performed on a Stratagene Mx3005 QPCR system (Agilent Technologies, AH diagnostics A/S, Aarhus, Denmark) using 5 μL of extraction in a total reaction volume of 25 μL. The assay contains QuantiTect Multiplex PCR NoROX kit (Qiagen, Copenhagen, Denmark) mixed with 1 μM primers and 200 nM FAM labelled Taqman Probe. Cycling conditions were as follows: 2 min at 50°C, 15 min at 95°C, 45 cycles of denaturation—15 s at 95°C, annealing and elongation 1 min at 60°C.
Statistical analyses
Statistical analyses of data were carried out using GraphPad Prism software 5 (GraphPad Software, Inc, La Jolla, California, USA). Comparisons of T-cell responses between the sex-matched and age-matched pairs of SLE patients and HCs were performed using the Wilcoxon matched-pairs test. Comparisons of T-cell responses between low-active and high-active SLE patients were performed using the unpaired non-parametric two-tailed Mann–Whitney test. Univariate correlation analyses were performed using Spearman's correlation test for non-parametric data sets. Data are presented with mean values±SEM with statistical significant differences indicated with *, ** or *** for p values less than 0.05, 0.01 or 0.001, respectively.
Results
Gating on T-cell subpopulations
A multiparameter flow cytometric analysis was performed to characterise T-cells upon stimulation of whole blood samples with EBNA1 and EBV-EA/D using SEB and PBS as a positive and negative control, respectively. A plot with forward scatter and cells binding CD3 antibodies was created in order to gate on the acquired T-cells (figure 1A).

Representative example of gating on T-cell subpopulations. (A) Flow cytometric plot of collected cells from a healthy control upon SEB stimulation with forward scatter and cells binding CD3 antibodies. Gate settings on CD3 cells are indicated. (B) Examination of subpopulations of gated T-cells (CD3) from a healthy control after whole blood stimulation with SEB, EBNA1, EBV-EA/D and phosphate-buffered saline. B(i) Dot plot of CD8 and CD69 T-cells. B(ii) Dot plot of CD8 and IFN-γ-producing T-cells. B(iii) Dot plot of CD69 and IFN-γ-producing T-cells. SEB, staphylococcal enterotoxin B; EBNA1, Epstein–Barr virus nuclear antigen 1; EBV-EA/D, Epstein–Barr virus early antigen diffuse; IFN, interferon.
Figure 1B illustrates a representative example of gated T-cells with examination of populations of activated CD69-expressing T-cells (figure 1B(i)) and T-cells producing IFN-γ (figure 1B(ii)+(iii)). As demonstrated in figure 1B, stimulation with SEB, EBNA1 and EBV-EA/D yielded T-cell populations of activated (CD69) and IFN-γ-producing CD4 and CD8 T-cells, whereas stimulation with PBS did not result in activated subpopulations of T-cells.
Reduced T-cell response in SLE patients upon EBV antigen stimulation
In order to characterise different T-cell subpopulations, we studied EBNA1 and EBV-EA/D-responding T-cells in 22 SLE patients and 22 age-matched and sex-matched HCs. Through ex vivo stimulation of primary T-cells in whole blood samples, we quantified the percentages of activated EBNA1-responding and EBV-EA/D-responding T-cells by multiparameter flow cytometry analyses. The percentages of activated T-cells in samples stimulated with PBS were subtracted from the percentages of activated T-cells upon EBV antigen stimulation.
Figure 2 illustrates the percentages of T-cells (CD3) from SLE patients and HCs that express CD69 on their surface (activated) upon stimulation with EBNA1 (figure 2A) and EBV-EA/D (figure 2B). Results showed a statistically significant reduced level of both EBNA1-specific and EA/D-specific T-cells in SLE patients compared with HCs. The reaction to EBNA1 was shown especially to be reduced in the SLE patients. The SLE patients experienced a weaker response to the EBV antigens compared with the HCs with statistically significant fewer T-cells, both CD8 and CD4, becoming activated (p=0.0001, 0.0007 and <0.0001 regarding total, CD8 and CD4, CD69-expressing T-cells upon EBNA1 stimulation, respectively, in figure 2A, and p=0.0015, 0.0103 and 0.0005 regarding total, CD8 and CD4, CD69-expressing T-cells upon EBV-EA/D stimulation, respectively, in figure 2B).
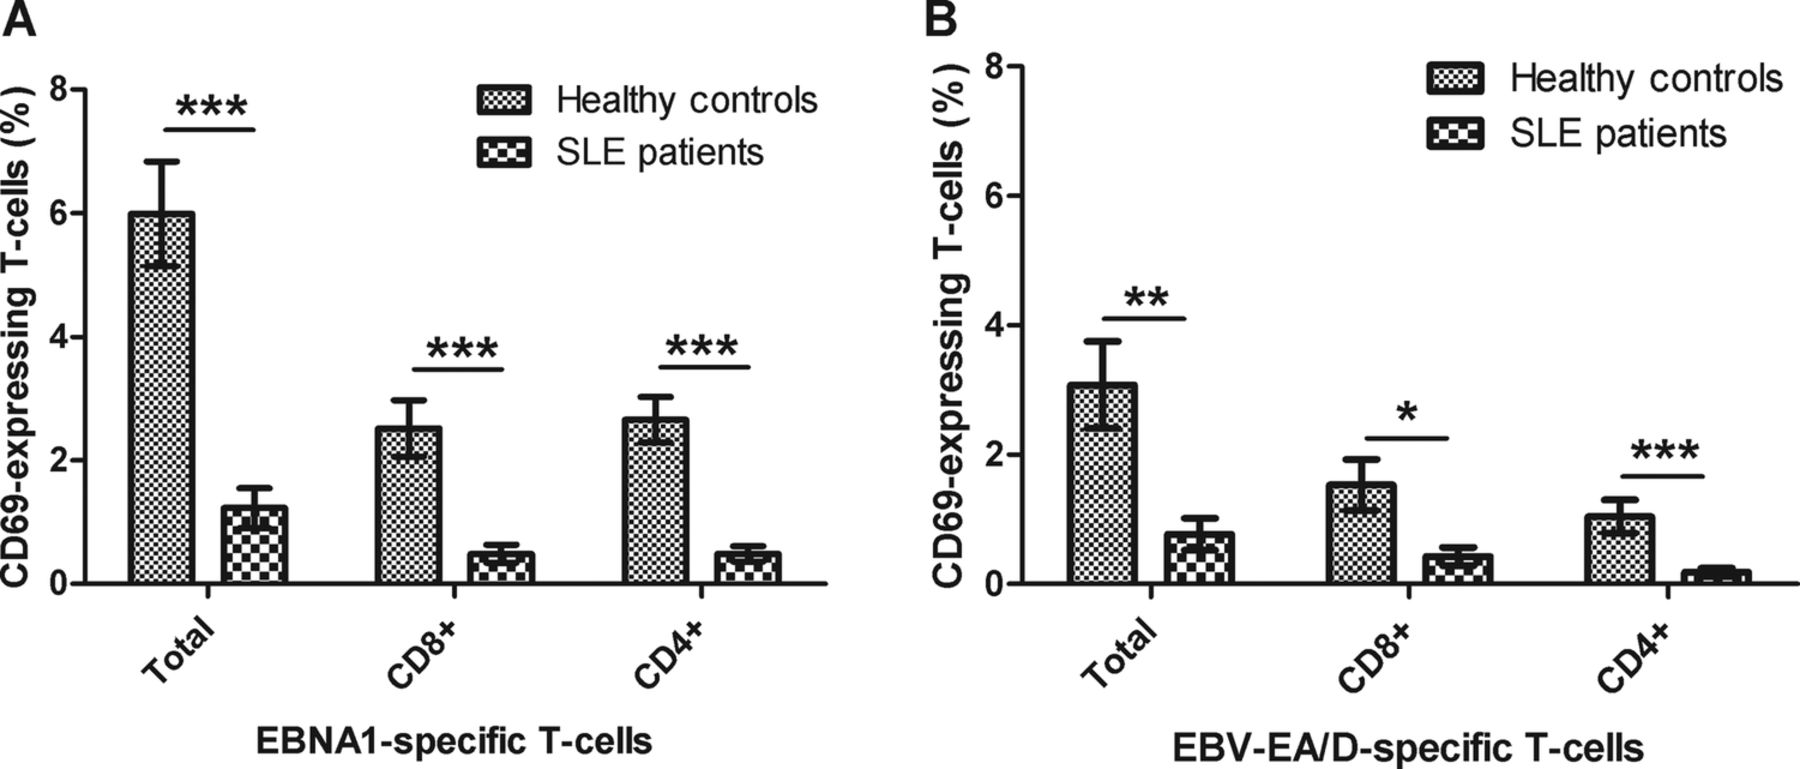
Activated T-cells in SLE patients and healthy controls upon EBV antigen stimulation. Heparinised whole blood samples from SLE patients (n=22) and sex-matched and age-matched healthy controls (n=22) were stimulated with EBNA1 (A) and EBV-EA/D (B). The percentages of activated T-cells (with bound CD69 antibodies) are shown divided into the total number of CD69 T-cells and CD8 and CD4 (CD8−) T-cells expressing CD69, respectively. Data are represented as mean±SEM. p Values for comparison of SLE patients and healthy controls are 0.0001, 0.0007 and <0.0001 regarding total, CD8 and CD4 CD69-expressing T-cells upon EBNA1 stimulation, respectively (A), and 0.0015, 0.0103 and 0.0005 regarding total, CD8 and CD4 CD69-expressing T-cells upon EBV-EA/D stimulation, respectively (B). SLE, systemic lupus erythematosus; EBNA1, Epstein–Barr virus nuclear antigen 1; EBV-EA/D, Epstein–Barr virus early antigen diffuse.
By comparison of percentages of EBNA1-specific T-cells (CD69) and EBV-EA/D-specific T-cells (CD69), respectively, in SLE patients stratified according to immunosuppressant medication, the observed reduced response of EBV-specific T-cells in SLE patients was found not to be related to treatments with immunosuppressant medication (unpaired non-parametric two-tailed Mann–Whitney test, p=0.6094 and p=0.2503, respectively).
It was further investigated whether the EBV antigen-stimulated T-cells were able to produce IFN-γ. Results showed a similar tendency with lower percentages of T-cells responding to EBV antigens in SLE patients compared with HCs (figure 3). The SLE patients demonstrated statistically significant decreased percentages of T-cells producing IFN-γ upon EBNA1 stimulation both regarding CD8 and CD4 T-cells and CD69 T-cells (p=0.0013, <0.0001 and 0.0003, respectively) (figure 3A), with a very limited production of IFN-γ in T-cells from SLE patients. Furthermore, a statistically significant reduced percentage of CD4 T-cells in SLE patients was shown to produce IFN-γ upon EBV-EA/D stimulation (p=0.0037) in contrast to CD8 T-cells (figure 3B). However, measurements of IFN-γ-producing T-cells upon EBV-EA/D stimulation were all very low.

IFN-γ-producing T-cells in SLE patients and healthy controls upon EBV antigen stimulation. Heparinised whole blood samples from SLE patients (n=22) and sex-matched and age-matched healthy controls (n=22) were stimulated with EBNA1 (A) and EBV-EA/D (B). The percentages of T-cells producing IFN-γ are shown divided into CD69 T-cells and CD8 and CD4 (CD8−) T-cells producing IFN-γ, respectively. Data are represented as mean±SEM. p Values for comparison of SLE patients and healthy controls are 0.0003, 0.0013 and <0.0001 regarding CD69, CD8 and CD4 IFN-γ-producing T-cells upon EBNA1 stimulation, respectively (A), and 0.3754, 0.3944 and 0.0037 regarding CD69, CD8 and CD4 IFN-γ-producing T-cells upon EBV-EA/D stimulation, respectively (B). SLE, systemic lupus erythematosus; EBNA1, Epstein–Barr virus nuclear antigen 1; EBV-EA/D, Epstein–Barr virus early antigen diffuse; IFN, interferon.
Results in figures 2 and 3 indicate that the SLE patients either have fewer EBV-specific T-cells than HCs or that the EBV-specific T-cells of SLE patients are not activated upon stimulation.
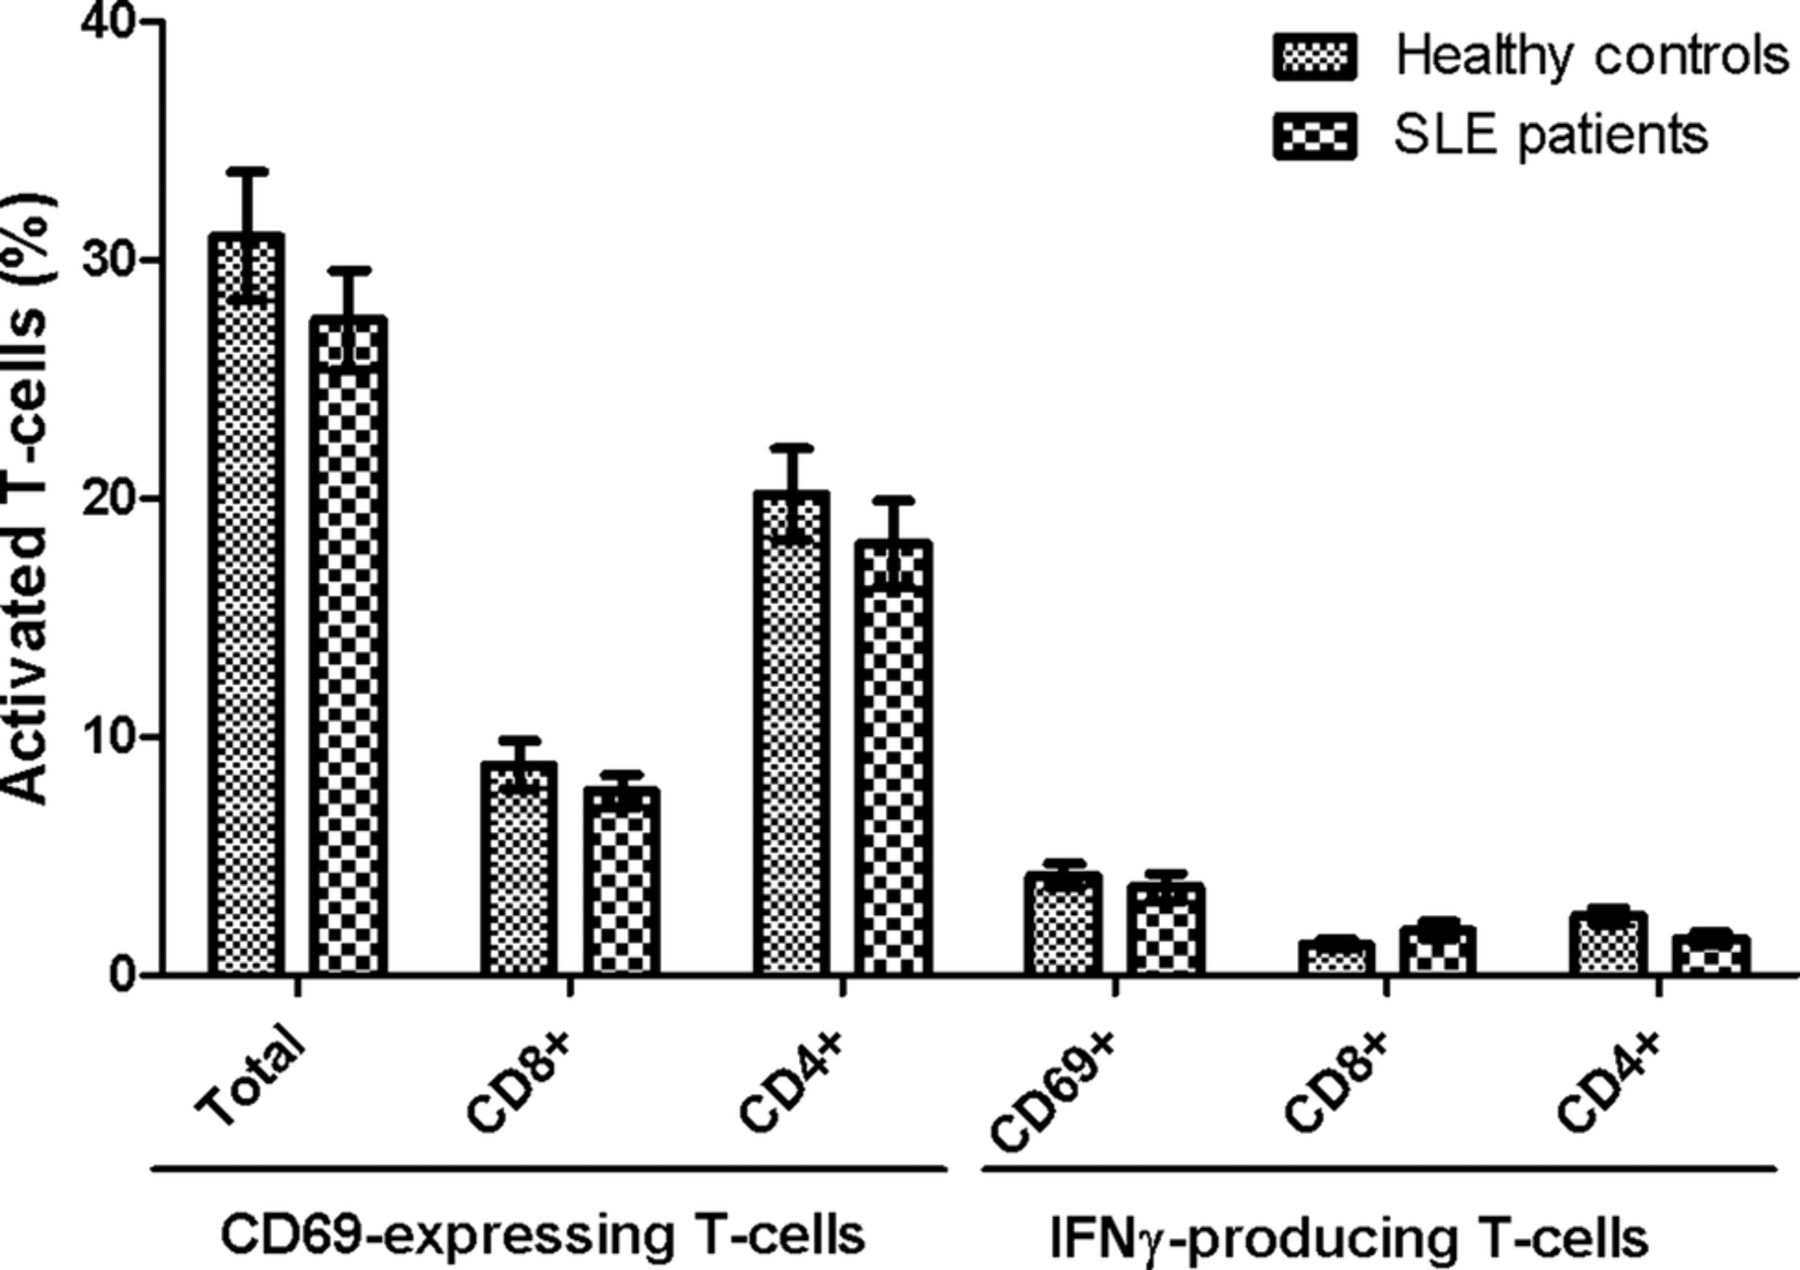
Importantly, no statistical significant differences were observed in either CD69 induction or IFN-γ production between SLE patients and HCs upon stimulation with the superantigen SEB (figure 4). Thus, the results achieved on EBNA1-specific and EBV-EA/D-specific T-cells are not a result of a general T-cell defect in the included SLE patients, although they tended to have slightly lower levels of activated T-cells.

No difference in T-cell response between SLE patients and healthy controls upon superantigen stimulation. Heparinised whole blood samples from SLE patients (n=22) and sex-matched and age-matched healthy controls (n=22) were stimulated with SEB. Percentages of SEB-responding T-cells are presented as mean±SEM, and shows both CD69-expressing and IFN-γ-producing T-cells, and are divided into CD8 and CD4 (CD8−) T-cells. No statistical significant differences were found between SLE patients and healthy controls in either CD69-expressing cells or in IFN-γ-producing cells. SLE, systemic lupus erythematosus; SEB, staphylococcal enterotoxin B; IFN, interferon.
Inverse correlation between lytic antigen EBV-specific T-cells and disease activity in SLE patients
In order to examine whether the decreased T-cell response observed in SLE patients was associated with disease activity, we conducted a stratification analysis for the EBV-specific T-cell responses (CD69-expressing cells upon stimulation) in SLE patients based on disease activity determined by the SLEDAI score.
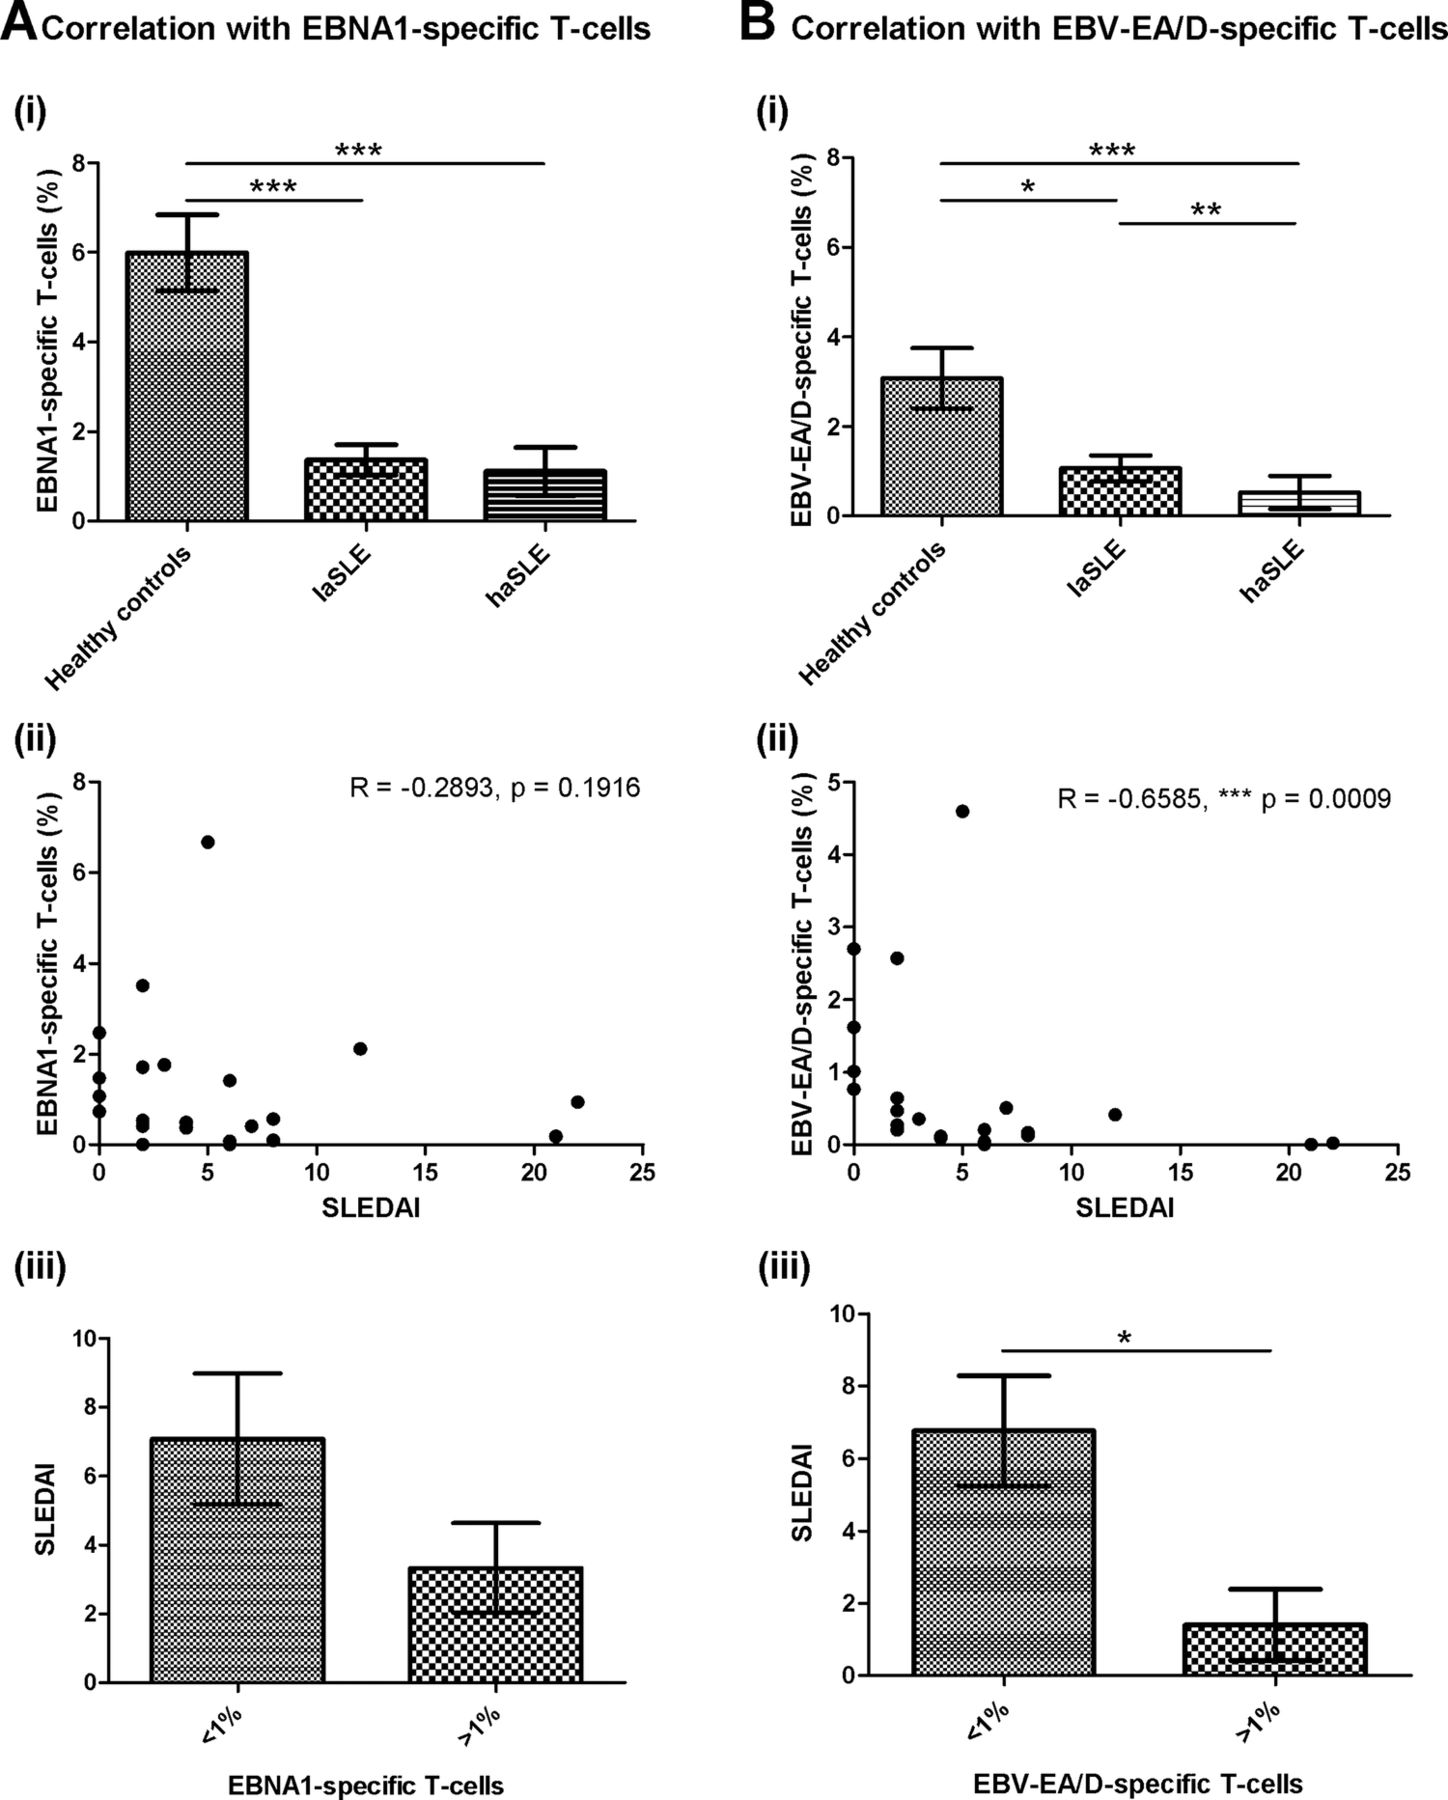
As demonstrated in figure 5A, no correlation was observed between disease activity of SLE patients and EBNA1-specific T-cells. Both laSLE and haSLE patients showed a statistical significantly reduced percentage of EBNA1-specific T-cells compared with HCs (p=0.0004 and <0.0001, respectively), but no difference was observed between laSLE and haSLE patients (figure 5A(i)). Furthermore, a correlation analysis showed no correlation between SLEDAI score and percentage of EBNA1-specific T-cells in the SLE patients (figure 5A(ii)), although when dividing SLE patients into two groups according to their percentage of EBNA1-specific T-cells, a tendency of a higher SLEDAI score was observed in patients with low percentages of EBNA1-specific T-cells (<1%) (figure 5A(iii)).
Correlations of EBV-specific T-cells and disease activity of SLE patients. Correlation analyses between disease activity and EBNA1-specific T-cells (CD69-expressing T-cells upon stimulation) (A) and EBV-EA/D-specific T-cells (CD69-expressing T-cells upon stimulation) (B) in SLE patients (n=22). A(i)+B(i) EBNA1-specific T-cells (A(i)) and EBV-EA/D-specific T-cells (B(i)) in healthy controls, laSLE and haSLE patients presented as mean±SEM. p Values for comparison of healthy controls/laSLE, healthy controls/haSLE and laSLE/haSLE are 0.0004, <0.0001 and 0.1468, respectively, regarding EBNA1-specific T-cells (A(i)) and 0.0328, <0.0001 and 0.0062, respectively, regarding EBV-EA/D-specific T-cells (B(i)). A(ii)+B(ii) Spearman's correlation coefficients are −0.2893 (p=0.1916) and −0.6585 (p=0.0009) when correlating SLEDAI score of SLE patients with EBNA1-specific (A(ii)) and EBV-EA/D-specific T-cells (B(ii)), respectively. A(iii)+B(iii) Comparison of SLEDAI score of SLE patients with less and more than 1% of T-cells being EBNA1-specific (p=0.1129) (A(iii)) and EBV-EA/D-specific (p=0.0195) (B(iii)). laSLE, low-activity systemic lupus erythematosus; haSLE, high-activity systemic lupus erythematosus; SLEDAI, SLE disease activity index; EBNA1, Epstein–Barr virus nuclear antigen 1; EBV-EA/D, Epstein–Barr virus early antigen diffuse.
Contrarily, an association was found between disease activity of SLE patients and EBV-EA/D-specific T-cells (figure 5B). As illustrated in figure 5B(i), the haSLE patients showed a statistically significant reduced percentage of EBV-EA/D-specific T-cells compared with laSLE patients (p=0.0062) in addition to a statistically significant difference between HCs and both laSLE and haSLE patients (p=0.0328 and <0.0001, respectively). Additionally, a correlation analysis showed an inverse correlation between percentage of EBV-EA/D-specific T-cells and SLEDAI score of SLE patients with a Spearman's correlation coefficient of −0.6585 (p=0.0009) (figure 5B(ii)). Even with data from the three SLE patients with the highest SLEDAI scores (12, 21 and 22, respectively) excluded from the calculation, an inverse correlation was obtained (Spearman's correlation coefficient=−0.6124 and p=0.0053). Moreover, the SLE patients with low percentages of EBV-EA/D-specific T-cells (<1%) displayed a statistically significant elevated SLEDAI score than SLE patients with EBV-EA/D-specific T-cells (>1%) (p=0.0195) (figure 5B(iii)).
Results in figure 5 suggest that haSLE patients have fewer functional lytic EBV-specific T-cells than laSLE patients, and showed an inverse correlation between lytic antigen EBV-specific T-cells and SLEDAI score. Collectively, the fewer lytic EBV-specific T-cells in the circulation, the higher disease activity was found in the SLE patients.
Inverse relation between EBV-specific T-cells and EBV antibody status
The status of EBNA1-directed and EBV-EA/D-directed antibodies in the plasma obtained from unstimulated blood samples of SLE patients and HCs was examined by indirect ELISA, and the results are listed in tables 2 and 3. The majority (91%) of all individuals included in the study were positive for EBNA1-directed IgG antibodies, indicating previous EBV infection, which is consistent with the background population.
EBV antibodies and EBV-specific T-cells in SLE patients and healthy controls
Overview of EBV antibody status and EBV-specific T-cells in SLE patients and healthy controls
In table 2, an outline of results on both EBV-specific T-cells (CD69-expressing cells upon stimulation) and EBV-directed antibodies for each included individual is presented with colour codes. Dark green signifies high percentages of EBV-specific T-cells (>high cut-off, >3.7%) and high titres of EBV-directed antibodies. Medium green indicates presence of EBV-specific T-cells (>cut-off, >1%) and antibody titres above cut-off values, and light green specifies no EBV-specific T-cells (<1%) and EBV antibodies. SLE patients are divided into laSLE and haSLE patients and listed with increasing SLEDAI score (the sex-matched and age-matched HCs are listed according to the SLE patients).
Table 2 reveals an inverse relation between EBV-specific T-cells and EBV-directed antibodies. The HCs had high percentages of EBV-specific T-cells and few antibodies to EBV. In contrast, the SLE patients with very few EBV-specific T-cells had high titres of EBV-directed antibodies.
Table 3 provides an overview of percentages of SLE patients and HCs positive for EBV-specific T-cells (>1%) and EBV-directed antibodies (>cut-off values), which further illustrate the inverse relation. Results on EBV antibody status shows that higher percentages of SLE patients were positive for EBV-directed antibodies, especially EBV-EA/D-directed antibodies with 73%, 64% and 27% compared with 9%, 9% and 5% of HCs regarding positivity of IgG, IgA and IgM antibodies, respectively (table 3). The opposite was demonstrated concerning EBV-specific T-cells with 21 of 22 HCs (95%) positive for EBNA1-specific T-cells compared with 9 of 22 SLE patients (41%), with lower percentages of both CD8 and CD4 EBNA1-responding T-cells in SLE patients compared with HCs. Furthermore, 68% of HCs compared with 23% of SLE patients were found positive for EBV-EA/D-specific T-cells, with equivalent results on individual percentages of CD8 and CD4 EBNA-1 specific T-cells, respectively.
Furthermore, in order to investigate the infection status, viremia in the whole blood samples from SLE patients and HCs were determined by quantitative EBV PCR. However, all individuals were found to have less than 500 virus copies per mL whole blood (results not shown), indicating that no severe acute infection is in progress in the included individuals.
Discussion
In this study, the levels of latent antigen (EBNA1) and lytic antigen (EBV-EA/D) EBV-specific T-cells were investigated in SLE patients and HCs by multiparameter flow cytometry analyses. The results showed significantly reduced percentages of activated T-cells upon ex vivo stimulation with EBNA1 or EBV-EA/D in blood samples of SLE patients compared with HCs. A reduced number of T-cells from SLE patients were found to produce IFN-γ upon stimulation compared with HCs. In addition, an inverse correlation between lytic EBV-specific T-cells and disease activity of the SLE patients was demonstrated, and an inverse relation between EBV-specific T-cells and EBV-directed antibodies was observed.
A reduced EBV-specific T-cell response has previously been observed in SLE patients.7 ,24 ,39 Berner et al39 applied MHCI tetramers with a lytic cycle EBV antigen peptide, and subsequent ELISPOT assay, using PBMCs from six SLE patients and five HCs, and showed that the EBV-specific CD8 T-cells in SLE patients were incapable of producing IFN-γ upon stimulation. Similarly, by stimulation of PBMCs from SLE patients and HCs with MHCI tetramers loaded with either latent or lytic EBV antigen peptides, Larsen et al24 demonstrated that EBV-specific CD8 T-cells from SLE patients were less cytotoxic with decreased effector responses. Both the secretion of inflammatory cytokines, including IFN-γ, and exocytosis of cytotoxic granules from the EBV-specific CD8 T-cells were found to be decreased in SLE patients.24 On the contrary, Kang et al7 only found a tendency of a decreased amount of EBV-specific CD8 T-cells and a significantly increased frequency of EBV-specific CD4 T-cells producing IFN-γ upon exogenous EBV stimulation of whole blood samples from SLE patients.
In the present study, the number of both functional CD8 and CD4 lytic and latent antigen EBV-specific T-cells was found to be reduced in SLE patients, which is similar to the results obtained by both Larsen et al24 and Berner et al39 and opposite of the results obtained by Kang et al,7 even though our experimental approach is more similar to Kang et al. However, the differences between the results of the current study and Kang et al might be due to a difference in stimulation time (6 h compared with 24 h in the current study) or in the EBV antigens employed.
Current results on reduced number of functional EBV-specific T-cells in SLE patients could not be explained by intake of immunosuppressive medication. SLE patients with indications of T-cell lymphopenia were excluded from the study to eliminate void measurements of misleading low T-cell responses, and as no difference in T-cell responses was observed between SLE patients and HCs upon SEB stimulation, these results on EBV-specific T-cells are not a consequence of general T-cell deficiencies in the included SLE patients.
It should be noted that the size of the EBV-EA/D T-cell IFN-γ responses in the study could theoretically be due to the fact that only a fraction of one lytic antigen was used. Investigations of T-cell responses to other lytic EBV antigens are necessary for further elucidation of the inverse correlation between lytic antigen EBV-specific T-cells and disease activity of SLE patients.
A challenge in the current study is the process of activation of CD8 T-cells upon stimulation with exogenous antigens. Consequently, the findings on activated CD8 T-cells might be an underestimate compared with cells stimulated also by intracellular antigens. Several studies have indicated the presence of a special exogenous MHCI pathway, in which exogenous antigens are presented on MHCI by macrophages and dendritic cells after internalisation by phagocytosis.44–48 This cross-presentation pathway is further indicated to be important especially during human viral infections. Furthermore, neighbouring bystander activation may occur.
The reduced EBV-specific T-cell reactivity found in SLE patients is possibly a consequence of limited or defective EBV-specific T-cells. A possible reason for the decreased cell-mediated response against EBV could be hyperactivation and subsequent exhaustion of EBV-specific T-cells upon continuous exposure to EBV antigens following frequent and recurrent EBV reactivations. This theory is also proposed by Larsen et al.24 They found that the impaired CD8 response was due to an increased expression of programmed cell death 1 (PD-1), which is known to negatively regulate T-cell responses and associate with T-cell exhaustion.49 This might also be the case for the EBV-specific T-cells measured in this study and perhaps for both the CD8 and also the CD4 EBV-directed T-cells leading to the observed reduced production of IFN-γ. This theory on hyperactivation and subsequent exhaustion of EBV-specific T-cells would presumably also result in the observed production of antibodies to the lytic cycle EBV protein EBV-EA/D. Another possibility is direct EBV infection of T-cells during widespread EBV infection, which several research groups have demonstrated to be possible.50–52 This would presumably lead to destruction of the infected cells.
The current results on reduced number of functional EBV-specific T-cells in the circulation cannot directly clarify whether EBV-specific T-cells in SLE patients are more locally present in sites of inflammation typical of SLE, including the skin and joints, and perhaps also are located at lymph nodes and secondary lymphoid organs. However, we believe that this would be reflected by the circulating T-cell population.
In order to control and maintain EBV in its latent stage and keep it from reactivation, cell-mediated immunity is fundamental. Thus, the fewer functional EBV-specific T-cells found in SLE patients possibly imply a poor control of EBV infection in the SLE patients.
The higher percentages of SLE patients positive for EBV directed antibodies, especially to the lytic cycle antigen EBV-EA/D compared with HCs, furthermore suggest poor control of EBV and indicate recent reactivations of EBV in the SLE patients, as EBV-EA/D is one of the first antigens expressed by EBV in the initiation of lytic cycle. Thus, an antibody response to EBV-EA/D with production of both IgG, IgM and IgA antibodies possibly suggest a more disseminated EBV infection, with both infected B-cells and epithelial cells in lytic cycle. However, elevated concentrations of total immunoglobulins are sometimes observed in SLE patients, which could be an influential factor in the increased EBV antibody levels. Still, we do not believe that this issue can fully explain the elevated EBV antibodies in SLE patients.
An inverse relation was observed between EBV-specific T-cells and EBV-directed antibodies. The HCs showed high percentages of EBV-specific T-cells and few EBV-directed antibodies (except EBNA1 IgG, which is positive in all individuals with previous EBV infection), and, in contrast, the SLE patients demonstrated very few EBV-specific T-cells, but had high titres of antibodies against EBV. It could be speculated that a deficiency in the EBV-specific T-cell responses, and thereby deficient control of EBV in SLE patients, may shift the immune reaction towards a humoral response in order to compensate and thereby attempt to control viral reactivations. Further investigations regarding this issue are necessary to determine the exact interplay between the EBV antibodies and EBV-directed T-cells in the blood samples. However, since this inverse association is observed for both SLE patients and HCs, the reduced functional EBV-specific T-cell response in SLE patients is presumably not an effect of the elevated titres of EBV antibodies. Instead, it might be a result of immune deficiencies either regarding T-cells in general or reduced EBV antigen removal subsequent to recurrent EBV reactivations.
Only 1 of the 22 SLE patients (aSLE-06) showed high percentages of EBV-specific T-cells, and interestingly this patient only had EBNA1 antibodies of the IgG isotype (and in low titres) and no antibodies against EBV-EA/D (an observation generally only demonstrated with the HCs), corroborating the inverse relation. This patient dissociated from the other SLE patients by the fact that it was the only included patient with pleurisy, which could be speculated to originate from another viral infection that transactivates EBV. However, the reason for the unusual results on this SLE patient compared with the rest of the data set remains to be determined.
Just one individual, a healthy control (HC-04), did not follow the observed inverse relation between EBV-specific T-cells and antibodies and was unexpectedly demonstrated to be positive for EBV-EA/D IgA antibodies, and in addition had high percentages of EBV-specific T-cells. However, it is imagined that an occasional reactivation of EBV has occurred in HC-04, and the EBV-specific T-cells and B-cells of the immune system are responding normally to this event, which may not be the case for the SLE patients.
An inverse correlation between lytic antigen EBV-specific T-cells and disease activity of the SLE patients was demonstrated. The fewer functional lytic antigen EBV-specific T-cells in the circulation of the SLE patients indicate less control of a lytic EBV infection with more widespread latent infection and more frequent reactivation. This establishes an increased number of EBV-infected cells, which would lead to enhanced apoptosis of cells and amplified cellular waste load and thereby retain the immune system in a more activated state, contributing to a vicious cycle of increasing disease activity with stimulation of autoreactive B-cells and production of autoantibodies against cell components. This increased number of lytic EBV-infected cells also gives rise to release of EBV antigens, resulting in the increased production of EBV-directed antibodies in the SLE patients, reflecting the hosts’ attempt to control the reactivation as compensation for lack of cell-mediated control.
In addition, the four excluded SLE patients (with indications of T-cell lymphopenia) all had active disease (with SLEDAI scores of 3, 7, 8 and 12, respectively) and also high titres of antibodies against EBV-EA/D. This further support the current results on reduced T-cell response to EBV and its relationship to active SLE and production of EBV antibodies.
In conclusion, the results obtained in this study expand previously suggested associations between EBV infection and the development of SLE. Numerous research groups have demonstrated that SLE patients have an abnormal high viral load, indicating difficulties in suppressing the latent infection. The present results verify previous results by Larsen et al and Berner et al and suggest that the defective control of the virus probably involves a reduced latent and lytic EBV-specific T-cell response in SLE patients. This may possibly result in frequent reactivation of the virus and an increased amount of EBV-infected cells, resulting in a vicious cycle of immune activation and increased disease activity. Thus, in interplay with genetically determined and acquired immune deficiencies, EBV might be a contributing agent to the development or exacerbation of SLE.
Acknowledgments
Esin Güven and Dorthe Olsen, Department of Clinical Biochemistry, Immunology and Genetics, Statens Serum Institut, Copenhagen, Denmark, are thanked for collecting blood samples.
References
Footnotes
-
Contributors Esin Güven and Dorthe Olsen (Department of Clinical Biochemistry, Immunology and Genetics, Statens Serum Institut, Copenhagen, Denmark) do not meet the criteria for authorship, but are listed in the ‘Acknowledgements’ section for collection of blood samples.
-
Competing interests None.
-
Ethics approval Scientific Ethical Committee of the Capital Region of Denmark.
-
Provenance and peer review Not commissioned; externally peer reviewed.
-
Data sharing statement No additional data are available.