Article Text

Abstract
Objective In geriatric populations, frailty is associated with poor health outcomes, including mortality. Frailty has not been examined in lupus, although components of the phenotype seem relevant.
Methods Women with lupus (n=152) participated in research visits in 2008–2009. Frailty was assessed by Fried's frailty phenotype criteria: low weight/unintentional weight loss, slow gait (4-m walk using sex and height criteria), weakness (grip strength using gender and body mass index criteria), exhaustion (2 specific questions) and inactivity (from physical activity questionnaire). Women accumulating 3+ components were classified as ‘frail’, one or two components as ‘prefrail’, and none as ‘robust’. Physical function (36-item Short Form (SF-36) Physical Functioning subscale and Valued Life Activities disability scale), cognitive function (from a 12-test battery) and mortality were examined as outcomes. Mortality was determined as of December 2015. Multiple regression analyses examined concurrent and 2-year function controlling for age, lupus duration, race/ethnicity, glucocorticoid use, obesity, self-reported disease activity and damage and, for longitudinal analyses, baseline function. Mortality analyses controlled for age, lupus duration and baseline disease damage scores.
Results Mean age was 48 (±12) years, mean lupus duration was 16 (±9) years. 20% of the sample was classified as frail and 50% as prefrail. Frail women had significantly worse physical functioning than both robust and prefrail women and were more likely to have cognitive impairment. Frail women were also more likely to experience declines in functioning and onset of cognitive impairment. Mortality rates were significantly higher in the frail group (frail 19.4%; prefrail 3.9%; robust 2.3%). Odds (95% CI) of death for frail women were elevated, even after adjusting for age, lupus duration and baseline disease damage (5.9 (0.6 to 57.1)).
Conclusions Prevalence of frailty in this sample of women with lupus was higher than in samples of older adults. Frailty was associated with poor physical and cognitive function, functional declines and mortality.
- Quality of LIfe
- Systemic Lupus Erythematosus
- Outcomes research
This is an Open Access article distributed in accordance with the Creative Commons Attribution Non Commercial (CC BY-NC 4.0) license, which permits others to distribute, remix, adapt, build upon this work non-commercially, and license their derivative works on different terms, provided the original work is properly cited and the use is non-commercial. See: http://creativecommons.org/licenses/by-nc/4.0/
Statistics from Altmetric.com
Frailty has been conceptualised as an accumulation of deficits across multiple physiologic systems. These deficits result in a reduction in the body's physiologic reserves and a generalised vulnerability to stressors, making individuals more susceptible to poor outcomes.1 ,2 The concept was developed first in geriatrics, but has since been extended to other populations, such as individuals awaiting or receiving solid organ transplantation. While several definitions or characterisations of frailty have been studied, the Fried's frailty phenotype,1 which consists of a constellation of low weight or weight loss, weakness, slowness, exhaustion and inactivity, has received the greatest attention. Among older adult populations, the frailty phenotype increases risk for numerous subsequent poor health outcomes, including falls, incident disease, disability, cognitive decline, hospitalisation, postoperative complications and mortality, independent of other comorbid conditions.3–8 Less work has examined the impact of frailty in younger populations, except among transplant patients where preoperative frailty has been linked to delayed graft function, postoperative complications and mortality.9–12
Elements of the frailty phenotype are present in lupus. Alterations in body composition have been noted in lupus, including higher body fat percentages and corresponding lower lean mass at given weights.13–15 Persons with lupus have been found to exhibit muscle weakness16–18 and high levels of fatigue.16 ,19 ,20 Previous research has documented very low rates of physical activity among persons with lupus.21–24 Gait speed has not been directly studied in lupus, but there is evidence of low exercise capacity in lupus,25 ,26 which may lead to slow gait when combined with low muscle mass and strength, deconditioning from inactivity and disease activity.
While each of these elements may be associated with poor outcomes individually, the conceptualisation of the frailty phenotype suggests that the ‘whole is greater than the sum of the parts’; in other words, the presence of the constellation of factors contributes more to the risk of poor outcomes than the individual elements. In this paper, we examine the prevalence of the frailty phenotype as defined by Fried in a cohort of women with SLE, and the relevance of frailty as a comorbid condition that confers risk for poor outcomes.
Methods
Subjects
Data from the Arthritis, Body Composition and Disability (ABCD) study were used for these analyses. Subjects in the ABCD study were recruited from participants in the University of California San Francisco (UCSF) Lupus Outcomes Study (LOS). Details of the LOS have been previously published,27 but in brief, participants were recruited from both clinical and community-based sources and participated in annual structured telephone interviews. SLE diagnoses using American College of Rheumatology (ACR) criteria28 were verified by medical record review. LOS participants who lived in the greater San Francisco Bay Area were recruited for ABCD, which entailed two in-person assessments in the UCSF Clinical and Translational Science Institute's Clinical Research Center (CRC), 2 years apart. Exclusion criteria were non-English-speaking, younger than age 18, current daily oral prednisone dose ≥50 mg (a proxy for severe lupus flare), current pregnancy, uncorrected vision problems that would interfere with reading ability and joint replacement within 1 year.
Three hundred and twenty-five individuals appeared to be eligible for the ABCD study and were asked to participate during one of their annual telephone interviews; 74 (22.8%) were ineligible (35 were outside the recruitment area, 25 were too ill, 9 had recent surgery, 2 were pregnant, 2 were insufficiently proficient in English and 1 had severe cognitive deficits and was unable to complete the telephone interview). Of 251 eligible individuals, 84 (33.5%) declined participation, most commonly because of transportation (n=12) or scheduling difficulties (n=39). One hundred and fifty-two women completed study visits.
The study was approved by the UCSF Committee on Human Research and all participants gave written consent.
Variables
Frailty
Frailty was measured according to the criteria defined by Fried. Although frailty was not the focus of the ABCD study, data were collected that could address each of the five criteria (see table 1 for specific definitions). Weight loss was defined as body mass index (BMI)<18.5 kg/m2 calculated from measured height and weight or self-report of unintentional weight loss in the past month on the Systemic Lupus Activity Questionnaire (SLAQ).29 ,30 Exhaustion was identified from two items from the Center for Epidemiologic Studies Depression scale,31 ‘felt that everything I did was an effort in the last week’, and ‘could not get going in the last week’. A response of ‘3–4 days’ or ‘5–7 days in the previous week’ to either item defined exhaustion. Physical activity was assessed by self-report with the long form of the International Physical Activity Questionnaire (IPAQ32 ,33), which queries activity over the past week. The IPAQ cutpoint for low activity was used to identify inactivity. Gait speed was measured over a 4-m marked course, during which participants were instructed to walk at their usual speed. Two trials were conducted, and the fastest time used. Grip strength was measured with a handheld dynamometer (Jamar dynamometers, Sammons Preston Roylan, Bolingbrook, IL, USA). Three trials were conducted for each hand, and the maximum strength measure was used to identify weakness.
Frailty components and definitions
Twenty-two women did not perform the grip strength test, with the primary reasons being pain and/or weakness (ie, difficulty holding the dynamometer). Women with missing grip strength data who reported trying to perform the test but were unable, or did not perform the test because of pain were coded as weak (n=15 of 22); other women with missing grip strength data were coded as not weak. Gait speed results were not available for 28 women, with the most common reasons being dizziness in the past month (which was an a priori exclusion) and error in performing or recoding the results. Women with missing gait speed data who were unable to perform the walk or did not attempt the walk because they felt unsafe, were coded as slow (n=2 of 28); other women with missing gait speed data were coded as not slow.
To calculate the frailty index score, a point is given for each criterion met. Accumulation of three or more criteria classifies the individual as ‘frail’, one or two criteria as ‘prefrail’ and none as ‘robust’.
Outcomes
Physical and cognitive function and mortality were examined as potential outcomes of frailty. Physical and cognitive function were assessed concurrently with the frailty assessment and again at the follow-up, an average of 2.4 years later, permitting analysis of cross-sectional associations with frailty and the ability of frailty classifications to predict changes in function over time.
Physical function
Physical function was assessed with the Valued Life Activities (VLA) disability scale34 and the Physical Functioning (PF) subscale of the SF-36.35 The VLA disability scale consists of 21 items for which respondents rate difficulty in performance on a 4-point scale (0=no difficulty and 3=unable to perform). Activities that individuals deem unimportant to them or that they do not perform for reasons unrelated to lupus are not rated and are not included in scoring. A mean difficulty score is calculated based on items rated (range 0–3), with higher scores reflecting greater disability. The SF-36 PF subscale includes 10 items assessing actions such as lifting and carrying, bending or kneeling, walking, and climbing stairs. Scores are standardised to range from 0 to 100, with a mean±SD of 50±10 and higher scores reflecting better function.
Cognitive function
Cognitive function was assessed with a battery of 12 tests modified from the ACR-recommended 1-hour battery for SLE, which has been previously determined to be reliable and valid in SLE.36 ,37 The battery included: California Verbal Learning Test-II (CVLT-II) Learning Trials 1 through 5, Short Delay Free Recall and Long Delay Free Recall;38 Rey Complex Figure Test Copy Trial, Immediate Delay and Long Delay;39 ,40 Controlled Oral Word Association Test total correct on phonemic fluency (letters);41 Delis-Kaplan Executive Function Test (DKEFS) Design Fluency Test—Shifting condition;42 DKEFS Color Word Inhibition Test—Inhibition Condition;42 DKEFS Color Word Inhibition Test—Switching condition;42 DKEFS Card Sorting Test—Total Correct sorts (set 1)42 and DKEFS Trail Making Test—Shifting Condition.42 Performance on each test was considered impaired if scores fell below −1.0 SD of age-adjusted population normative data. Individuals were classified as having cognitive impairment if they were impaired on at least one-third of the tests completed.37 To be included in analysis, participants must have completed at least 6 of the cognitive tests; 10 women were excluded from analysis of cognitive function because of incomplete data.
Mortality
Mortality was determined as of 31 December 2015. Determinations of death were primarily collected through reports of family members or other backup contacts when scheduling for annual interviews was attempted. If individuals were lost to follow-up and no family report was available, women were classified as alive.
Other variables
Sociodemographic characteristics (age, race/ethnicity, education, duration of disease) and smoking were obtained from the baseline LOS telephone interview. Height was measured with a wall-mounted stadiometer. Weight was measured with subjects wearing light indoor clothing and no shoes. BMI was calculated as weight (kg) divided by height (m2). Obesity was defined from BMI as BMI ≥30 kg/m2. Disease activity was assessed using the SLAQ, a validated, self-report measure of disease activity in SLE, and a 0–10 rating of SLE activity.29 ,30 The Brief Index of Lupus Damage (BILD) was used to estimate lupus-related cumulative organ damage.43 ,44 The BILD is based on the Systemic Lupus International Collaborating Clinics Damage Index (SDI), and consists of items paralleling SDI items including determinations of important comorbid conditions such as cardiovascular disease and events and diabetes. Pain was measured with the SF-36 Pain subscale.35
Analysis
Frequencies or means and SDs were calculated for sociodemographic and other characteristics, frailty index components and outcomes. Frailty index scores were calculated, and participants classified as robust, prefrail or frail. Differences in functioning among the frailty classification groups were examined first with analyses of variances (VLA, SF-36 PF) or χ2 analyses (cognitive impairment). To examine the independent contribution of frailty to functioning concurrently, multivariate linear or logistic regression models were constructed for each measure of functioning, adjusting for age, duration of lupus, race/ethnicity, use of oral steroids, obesity, baseline SLAQ score, baseline BILD score and baseline pain. Longitudinal multivariate analyses controlled for the same variables, and added the baseline value of the measure of function. To determine if specific components of the frailty phenotype were driving associations with outcomes, additional cross-sectional and longitudinal regression analyses were conducted, replacing the frailty classifications with presence of individual frailty components in separate regression models. Mortality rates were compared across frailty classifications by χ2 analysis. A Kaplan-Meier survival analysis was calculated by frailty classification. Cox proportional hazards regression was used to calculate the risk of mortality, first unadjusted for covariates, then adjusting for age and duration of lupus, and finally adjusting for age, duration of lupus and baseline BILD score.
Results
Sample characteristics
Mean age was 48.0 years (±12.3), 64.5% were white non-Hispanic, 13.8% had low educational levels and mean duration of lupus was 15.6 years (±9.4) (table 2). Forty-six per cent were currently using glucocorticoids; among women using glucocorticoids, the average daily dose was 3.9 mg (±5.9). Mean rating of SLE activity was 4.4 (±2.8) on a 0–10 scale. Mean SLAQ score was 12.8 (±7.4) and mean BILD was 2.1 (±2.0). Mean SF-36 Pain score was 42.0 (±10.9), close to 1 SD worse than the population mean. Thirty per cent were classified as obese. Slightly over one-third were ever smokers, but only 4% were current smokers.
Sample baseline characteristics, total and by frailty classification
Prevalence of frailty
Overall, 20.4% of the sample was classified as frail and 50.7% as prefrail (table 3). The prevalence of frailty was higher than in other studies of older adults and other cohorts of transplant patients, with the exception of individuals awaiting lung transplantation (mean age 59 years), individuals with congestive heart failure (mean age 71 years) and individuals ≥age 65 years with high levels of depressive symptoms. Exhaustion, weakness and inactivity were the components of frailty most commonly present (45.4%, 30.9% and 29.0%, respectively). Twenty-two per cent of the sample met the criterion for weight loss and 9.2% for slow gait.
Prevalence of frailty components and categorisation, compared with other studies
There were no differences in age, race, education, lupus duration or smoking history by frailty classification (table 2). Steroid use was more common among prefrail and frail women. There was a significant gradient of worsening in ratings of disease activity, SLAQ scores, damage and pain as frailty status moved from robust, to prefrail, to frail. Mean dose of glucocorticoids was higher for the frail women, although the difference between groups was not significant. Even though weight loss is a component of frailty, obesity was more common in the prefrail and frail groups.
Baseline VLA score was 0.80 (±0.55), indicating moderate disability. Baseline SF-36 Physical Function score was 40.8 (±11.5), approximately 1 SD below the population mean. One-third of the samples were classified as cognitively impaired.
Frailty classification and functioning
In bivariate analyses, women classified as frail had significantly worse PF according to both the VLA disability scale and the SF-36 PF than either robust or prefrail women, and were more likely to have cognitive impairment (table 4). Women classified as prefrail had intermediate levels of functioning compared with those who were frail or those who were not frail. After adjusting for covariates, cross-sectional differences in PF remained. VLA scores were 0.34 and 0.62 points higher for women who were prefrail and frail, respectively, than for women who were robust. Although no minimum clinically important difference (MCID) has been validated for the VLA, using 0.5 SD as an approximation of the MCID,45 each of these differences appear to be clinically important.
Functioning by frailty classification: Cross-sectional and longitudinal analyses
Women who were prefrail had SF-36 PF scores 5.9 points lower than those were classified as robust, and women who were frail had scores 10.5 points lower. Again, both of these differences appear to be clinically important. Women who were frail had almost six times the odds of being cognitively impaired (OR=5.9, 95% CI 1.2 to 28.6). Women who were prefrail also had an elevated risk of cognitive impairment, but the CI did not exclude one (OR 2.6, 95% CI 0.8 to 8.4).
Longitudinal analyses examined the role of frailty status in predicting functioning 2 years later. Follow-up data were available for 140 women. There was no significant difference in loss-to-follow-up by frailty status (p=0.90). Women who were frail were more likely to experience declines in functioning (VLA score increase by 0.31, SF-36 PF score decline by 6.7 points), and were more likely to experience onset of cognitive impairment (OR 37.3, 95% CI 1.1 to >999).
Frailty components and functioning
In the cross-sectional bivariate analyses, both physical function measures were significantly worse in the presence of each frailty criterion, while differences in the prevalence of cognitive impairment were seen only for the weakness criterion (table 5). After adding covariates, VLA disability was significantly greater in the presence of three of the frailty components: weight loss, exhaustion and inactivity. Estimates of significant increases in VLA scores associated with these components ranged from 0.19 to 0.38. SF-36 PF scores were significantly worse for women with exhaustion, weakness and inactivity. Each of these components was associated with decrements in SF-36 PF scores from −4.1 to −4.7. Cognitive impairment was significantly associated only with exhaustion.
Functioning by frailty components: cross-sectional and longitudinal analyses
In the multivariate longitudinal analysis, significant differences in functioning were seen in VLA disability only in the presence of weakness and inactivity, in SF-36 Physical Function only for inactivity and in the onset of cognitive impairment only for weakness.
Frailty and mortality
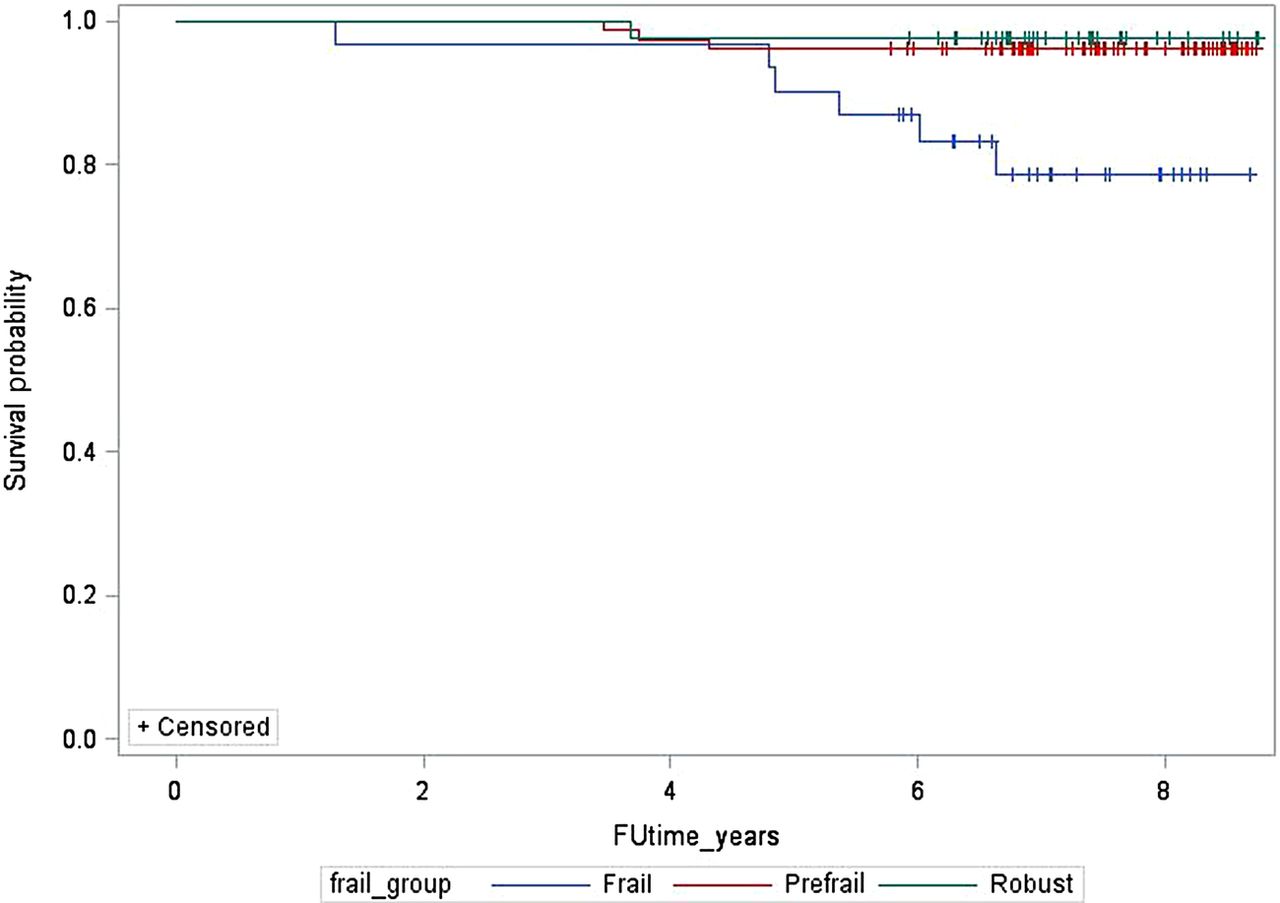
Mean follow-up time was 7.2 (±1.1) years, and ranged from 1.3 to 8.8 years. Ten of the 152 women died between the ABCD assessment (2007–2008) and December 2015. Twenty other women were lost to follow-up but were classified as alive for this analysis. Follow-up time for those who died was significantly less: 4.4 (±1.5) vs 7.4 (±0.8) years (p<0.0001). Mortality rates were significantly higher in the frail group, 19.4% (n=6) vs 3.9% (n=2) for the prefrail group and 2.3% (n=1) for the robust group (figure 1). The HR for death for the frail group was 9.2 (95% CI 1.1 to 76.6; table 6). After adjusting for age and duration of lupus, risk of death for frail women decreased to 8.5 (95% CI 1.0 to 72.8). Further adjustment for baseline disease damage decreased risk of death to 5.9 (95% CI 0.6 to 57.1).
Frailty and risk of death

Kaplan-Meier survival curve by frailty classification.
Discussion
In this cohort of women with lupus, a significant portion, one in five, was classified as frail and another one in two as prefrail. This rate of frailty is twice as high as that seen in many studies of adults more than two decades older. For example, Fried reported a prevalence of 7% in a sample of men and women aged ≥65 years. Recent systematic reviews reported frailty rates of 10% and 14% in adults aged ≥65 years. An analysis of data from the National Health and Aging Trends Study (n=7439) found rates of prefrailty and frailty similar to those found in our sample of women with a mean age of 48 years, but in individuals aged 75–79 years.7 Rates of prefrailty in these studies of older adults were similar to that found in the current study.
As in studies of older adults, we found that frailty was associated with poor PF. Furthermore, the impact of frailty extended beyond static differences in function. Frail individuals had significantly greater declines in physical function over the subsequent 2 years.
A number of studies in the geriatric literature show associations of frailty with concurrent cognitive impairment and frailty as a risk for cognitive decline. The reciprocal relationship has also been demonstrated (ie, cognitive impairment is a risk factor for incident frailty). However, some of the previous studies showed that the relationship between frailty and cognitive decline could be explained by baseline health and social conditions, or baseline cognitive status.46 In contrast, we found that even controlling for baseline health and other conditions, frailty was associated with concurrent cognitive impairment and conferred risk of the onset of cognitive impairment.
The prevalence of individual frailty components differed in the lupus sample from previous studies of older adults. Among this group of women with lupus, exhaustion and weakness were almost twice as frequent as among older adults, whereas slow gait was much less frequent. The components of frailty that were most strongly associated with poor functioning were exhaustion, weakness and inactivity. Exhaustion was associated concurrently with both physical and cognitive function. Fatigue has been identified as one of the most common symptoms of lupus, and is associated with decreased quality of life and disability.47 Weakness has also been linked independently to declines in functioning among women with lupus,18 ,48 and inactivity has been linked previously in SLE to higher risk of cognitive impairment.23
Because the frailty criteria include two measures of PF—gait speed and weakness—it may seem obvious that frailty would be linked to poorer function and greater disability. However, both the cross-sectional and longitudinal analyses suggested that it was not a single component of the frailty phenotype that was associated with poor function or declines in function, but rather the accumulation of frailty components. For example, in cross-sectional analyses, prefrailty and frailty accounted for increases in VLA scores of 0.29 and 0.62 points, respectively, compared with increases of 0.14, 0.19, 0.24 and 0.38 for the individual components of weakness, weight loss, inactivity and exhaustion, respectively. Similarly, the individual components of exhaustion, weakness and inactivity accounted for decreases in SF-36 PF that were approximately half of the decrease associated with frailty.
Although mortality was a rare outcome in this sample, frailty was also linked to a higher risk of death. While adjusting for age, disease duration and disease damage reduced the risk, mortality risk was still almost six times higher among women classified as frail than for women classified as robust, a risk similar to that reported by Bandeen-Roche for older women (HR 6.03).2 Of particular note, this elevation in risk was seen even after adjusting for a measure of disease damage, which included cardiovascular disease and events, diabetes and renal disease.
Results from this study suggest two future areas of research. First, the low frequency of gait speed impairment in this cohort and the very high frequency of fatigue in SLE suggest that the configuration of the frailty phenotype as defined for geriatric populations may have limitations in SLE. It is possible that a lupus-specific measure of frailty might include different or additional factors that would better predict predisposition to poor functional outcomes. For example, a lupus-specific measure might include severe joint problems or previous history of avascular necrosis that may limit mobility, or, because of the high rates of depression in SLE, a measure of exhaustion that is not derived from items measuring depressive symptoms. Identification of frailty using the Fried's criteria requires physical performance testing, which can limit the feasibility of use in clinical settings. Future studies can work towards developing measures to identify frailty that may be more relevant to lupus and easier to implement on a larger scale.
The second area of future research to pursue is that of interventions. Physical activity and exercise interventions address a specific component of the frailty phenotype (inactivity), and can potentially affect other components such as weakness or gait. Geriatric researchers have found that physical activity interventions can both prevent and treat frailty.49 ,50 Likewise, physical activity interventions have shown beneficial effects in SLE, including decreases in fatigue and improvements in physical function and quality of life, although no improvements in disease activity have been noted.51 ,52 However, if a lupus-specific measure of frailty can be identified, interventions targeting frailty in lupus may need to be specifically tailored to address the needs of the population.
This research does have limitations. The analysis includes only women; results among men with lupus may be different. Although about one-third of our subjects were minorities, we included only English-speaking individuals. Minority patients, some of whom may be non-English-speaking, often have more severe disease, which could affect several frailty components. Our sample size was relatively small and some of the estimates lacked precision (ie, had wide CIs), yet the effects were robust enough to be detected in spite of the sample size. Women who participated in this study may not represent the full spectrum of disease in SLE; women with severe disease are especially likely to be under-represented because they may have been unable to attend research visits. A fraction of this sample did not complete the performance measures (grip strength and gait speed walk). While we attempted to characterise the presence of deficits in those two areas based on reasons for not completing the measure, it is possible that our characterisation was incorrect. Our ascertainment of mortality may have mischaracterised some of those who died as missing; however, this would have created a bias towards a null result.
Limitations are offset by strengths and advantages of this study. This was the first study to include all of the variables relevant to measuring the frailty phenotype in lupus. Both cross-sectional and longitudinal measures were available, and valid and reliable measures of both physical and cognitive functioning were available. Follow-up for mortality was available for up to 8 years and a minimum of 6 years.
In summary, frailty appears to be a relevant concept in lupus, predicting declines in physical and cognitive functioning and higher risk of mortality. The effects noted were not simply due to the disease itself—the effects were seen even after adjusting for disease activity and damage. Furthermore, the combined elements of the frailty phenotype appear to represent a risk for poor functional outcomes greater than the risk conferred by any of the elements alone. Future research can continue to explore the best means to identify frailty in lupus, and, more importantly, best methods to reduce frailty.
References
Footnotes
Twitter Follow patricia katz @patti_katz
Contributors All authors were involved in the study conception and design and analysis and interpretation of data. PPK and EY were involved in the collection of data. All authors have contributed to drafting and revising this work, and all have read and approved the submitted version. All authors agree to be accountable for all aspects of the work in ensuring that questions related to the accuracy or integrity of any part of the work are appropriately investigated and resolved.
Funding This research was funded by the National Institute for Arthritis, Musculoskeletal and Skin Diseases, grant P60 AR053308.
Competing interests None declared.
Ethics approval University of California San Francisco Committee on Human Research.
Provenance and peer review Not commissioned; externally peer reviewed.
Data sharing statement No additional data are available.