Article Text

Abstract
Objectives To characterise the prevalence and associations of metabolic syndrome (MetS) in a multiethnic cohort of patients with SLE.
Methods Using a standardised protocol, baseline demographics, per visit disease activity (Systemic Lupus Erythematosus Disease Activity Index-2K) and treatment data, and annual recording of organ damage accrual (Systemic Lupus International Collaborating Clinics/American College of Rheumatology (SLICC-ACR) Damage Index) were captured on patients with SLE from a single tertiary centre. The presence of MetS, defined using modified updated joint consensus criteria, was assessed at the final visit from patient records. Serum concentrations of adipocytokines were measured by Quantibody.
Results 116 patients, with median (Q1, Q3) age at enrolment of 39.5 (31.4–51.1) years and disease duration of 6.1 (1.4–12) years, were followed for a median of 6.7 (4.1–8.1) years. The prevalence of MetS was 29% (34/116), while the prevalence of MetS components varied: hypertension (59%), low high-density lipoproteins (HDLs) (51%), hypertriglyceridaemia (32%), obesity (16%) and hyperglycaemia (22%). In univariable analysis, MetS was associated with baseline organ damage (OR 4.34; 95% CI 1.80 to 10.48; p<0.01) and organ damage accrual (OR 2.34; 95% CI 1.02 to 5.36; p=0.04) but not with disease activity. In multivariable analysis, baseline organ damage remained significantly associated with MetS (adjusted OR 3.36; 95% CI 1.32 to 8.59; p=0.01). Glucocorticoid use was not associated with MetS or any of its five components. High serum concentrations of resistin were significantly negatively associated with MetS (OR 0.17; 95% CI 0.04 to 0.70; p=0.014).
Conclusion MetS was common in a multiethnic cohort of patients with SLE, with the most frequent components being hypertension and low HDL. An independent association was found between MetS and organ damage but not glucocorticoid exposure or disease activity.
- lupus erythematosus
- systemic
- cardiovascular diseases
- autoimmune diseases
This is an open access article distributed in accordance with the Creative Commons Attribution Non Commercial (CC BY-NC 4.0) license, which permits others to distribute, remix, adapt, build upon this work non-commercially, and license their derivative works on different terms, provided the original work is properly cited, appropriate credit is given, any changes made indicated, and the use is non-commercial. See: http://creativecommons.org/licenses/by-nc/4.0/.
Statistics from Altmetric.com
Introduction
SLE is a chronic autoimmune condition in which unregulated tissue inflammation and the adverse effects of treatment result in the development of irreversible organ damage.1 SLE is known to be strongly associated with accelerated atherosclerotic coronary artery disease, with young women aged 35–44 years over 50 times more likely to have a myocardial infarction compared with their age-matched healthy peers.2 Patients with SLE have a higher prevalence of traditional cardiovascular risk factors, in particular arterial hypertension and type 2 diabetes.3–5 Even after adjustment of the traditional Framingham risk factors,6 the risk of cardiovascular events remains elevated in patients with SLE. This suggests that other factors such as systemic inflammation due to disease activity, antiphospholipid antibodies and the effects of medications are likely to be involved.
Metabolic syndrome (MetS) is a chronic proinflammatory and prothrombotic state that is associated with an increased risk of atherosclerosis, cardiovascular events and type 2 diabetes.7 It is diagnosed in the presence of at least three of five metabolic and atherosclerotic risk factors, that is, abdominal obesity, arterial hypertension, hypertriglyceridaemia, low high-density lipoproteins (HDL) and insulin resistance.8 While the pathophysiology of MetS is complex and remains incompletely understood, a state of chronic low-grade inflammation occurs as a result of visceral adiposity, through the release of proinflammatory cytokines by adipocytes.9 10 The proinflammatory adipokines include resistin, tumour necrosis factor (TNF), interleukin (IL)-1, IL-6, monocyte chemoattractant protein-1 (MCP-1), lipocalin-2 and plasminogen activator inhibitor-1 (PAI-1), which combine to mediate effects including promoting insulin resistance, thereby increasing glucose and free fatty levels.11 The imbalance between proinflammatory and anti-inflammatory adipokines in the setting of MetS leads to an overall increase in inflammation, endothelial dysfunction and oxidative stress.12 This results in an increase in the development of atherosclerosis, cardiovascular events and mortality.7
Based on the association of MetS with cardiovascular outcomes, and the increased prevalence of these outcomes in patients with SLE, several groups have reported that the prevalence of MetS in patients with SLE is higher compared with the general population.12 In a recent meta-analysis, the estimated pooled prevalence of MetS in patients with SLE was found to be 26%, with the prevalence in individual studies ranging between 3.3% and 45.2%.13 Multiple associations of MetS in SLE have been described, including an older age at diagnosis, disease duration, disease activity, renal involvement, organ damage and glucocorticoid use, along with smoking.12 However, no single parameter has consistently been demonstrated to be independently associated with MetS in SLE across studies. In addition to the cardiovascular effects, MetS is associated with poorer quality of life, potentially related to increased anxiety and depressive symptoms in SLE.14 15
The contribution of glucocorticoids to the development of MetS in SLE is not clear. Glucocorticoid use is highly prevalent in patients with SLE, with up to 80% of patients prescribed chronic glucocorticoid therapy,16–18 and clear links between glucocorticoid exposure and adverse outcomes including damage accrual.1 19 The potential links between the metabolic effects of glucocorticoids and MetS are multifactorial, with increased gluconeogenesis, changes in lipid metabolism (increased triglycerides and lower HDL), inhibition of insulin secretion and peripheral insulin resistance all potentially implicated.20
In this study, we aimed to describe the prevalence and clinical associations of MetS, including with glucocorticoid use, in a well-characterised single-centre multiethnic cohort of patients with SLE, distinguished from previously reported cohorts by the combination of recency of care, multiethnicity including a high proportion of Asians and being studied under a universal healthcare model with subsidised access to prescription medications.
Methods
Patients
Adult patients with SLE were recruited from the Monash Lupus Clinic in Melbourne, Australia during the period 2007–2015. Patients who fulfilled criteria for SLE (either the 1997 American College of Rheumatology (ACR) criteria21 or the 2012 Lupus International Collaborating Clinics (Systemic Lupus Collaborating Clinics (SLICC)) criteria)22 were eligible and were included in this study if all required data for assessment of MetS were available in the medical record. Data collection took place during the routine ambulatory care of each patient with SLE using a standardised protocol, as previously described.23 Of a total of 271 patients screened, 116 had complete MetS data and were included in this study.
SLE clinical assessments
Baseline data included age, gender, self-reported ethnicity, date of onset of SLE and diagnosis, smoking status, highest education level and family history. At each clinical visit, disease activity was assessed using the Systemic Lupus Erythematosus Disease Activity Index-2K (SLEDAI-2K)24 modified as per Thanou et al,25 and data were collected on all medication use, including glucocorticoids, antimalarials, immunosuppressants, antihypertensive agents, lipid-lowering therapies and glucose-lowering agents. Prednisolone dose was recorded at each review, allowing cumulative exposure to be calculated. The time-adjusted mean SLEDAI-2K (AMS) was calculated as a measure of disease activity over time.26 Active lupus disease was defined as SLEDAI-2K >4 as defined by Yee et al.27 Lupus low disease activity state (LLDAS) was calculated as defined by Franklyn et al.23 Organ damage was measured at baseline and annually using the SLICC-ACR Damage Index (SDI),28 which comprises 38 items in 12 domains. A change of one unit in SDI has been demonstrated to be clinically significant29 and was chosen to define damage accrual.
Arterial blood pressure measured in millimetres of mercury (mm Hg) and weight measured in kilograms (kg) was recorded at each clinic visit. Frequency of testing for fasting blood lipids and glucose were as determined by the physician and were retrospectively captured from patient records.
MetS assessment
Patients records were assessed at the last recorded visit for the presence of MetS, defined according to modified 2001 National Cholesterol Education Program (Adult Treatment Panel (ATP)) III 2001 guidelines,30 with MetS defined as present if three or more of the following five criteria were fulfilled: (1) obesity (BMI >30 kg/m2 used as a surrogate marker of abdominal obesity consistent with the definition of abdominal obesity in the National Institutes of Health obesity guidelines31; (2) elevated triglycerides (≥1.7 mmol/L) or medication; (3) reduced HDL-cholesterol (<1.3 mmol/L in females; <1.0 mmol/L in males) or medication; (4) elevated arterial blood pressure (>130/85 mm Hg) or medication for hypertension; and (5) elevated fasting glucose (>5.6 mmol/L) or antidiabetic medication.
Serum adipocytokine measurement
Biobanked serum samples matching with MetS status assessment were available on a subset of 59 patients. Briefly, whole blood was collected by venepuncture at routine clinical visit. Serum was extracted and stored at −80°C until further use, as previously described.32 Serum concentrations of adipocytokines (resistin, lipocalin-2, TNF, MCP-1, IL-6 as well as insulin) were measured using the Quantibody platform (Raybiotech, Norcross, Georgia, USA) as part of 40-plex commercial panels. Assays were performed by Veracity Biolabs (Scoresby, Victoria), following manufacturer’s instruction, as previously described.33
Statistical analysis
All statistical analyses were performed using Stat V.14.2. Continuous variables analysed in this study were non-normally distributed, hence were described as median (first and third quartiles) (Q1, Q3) or (range) and compared using Wilcoxon rank-sum test. Categorical variables were described as frequency (%) and compared using χ2 test. Associations with serum adipocytokines were analysed by comparing patients with levels greater versus less than median concentrations. Univariable and multivariable logistic regression analyses were carried out to identify factors associated with the presence of MetS as an outcome variable. Variables associated with the presence of MetS with p<0.1 in univariable analyses were included in multivariable model to account for potential confounders. Results were reported as ORs with 95% CIs. Values of p<0.05 were regarded as statistically significant.
Results
Patient demographics and SLE disease characteristics
In this study, 116 patients with SLE, with a complete dataset, were included. The median (Q1, Q3) age at enrolment was 39.5 (31.4, 51.1) years, with a median disease duration of 6.1 (1.4–12) years (table 1). Baseline characteristics of the entire cohort from which these patients were included are found in the online supplemental table 1. There were no significant differences between the groups at baseline; however, the studied group had an increased duration of observation and correspondingly had increased total clinic visits and cumulative prednisolone.
Supplemental material
SLE patient demographic and clinical characteristics at baseline and follow-up
At baseline, 41% (48/116) of patients had active disease (SLEDAI-2K>4), and 49% (57/116) had organ damage (SDI >0). Patients were followed for a median (Q1, Q3) of 6.7 (4.1, 8.1) years, during which the median AMS was 3.7 (2.1, 5.2). Mild-to-moderate flare rate was found to be 0.61 per year, and severe flare rate was 0.13 per year. Half of the cohort (58/116) accrued damage during the study period, with 97 new events captured, and six of those were in cardiovascular domains of the SDI. Eighty per cent of patients were exposed to glucocorticoids with time-adjusted mean (TAM) prednisolone dose of 3.7 mg/day (0.5–7.0).
Prevalence and association of MetS in SLE
The diagnostic criteria for MetS were met by 34 patients with SLE (29%) (figure 1). We next analysed associations between demographic and clinical SLE features (exposure) with the presence of MetS (outcome) using a logistic regression model. In univariable analysis, MetS was associated with baseline organ damage (SDI >0) (OR 4.34; 95% CI 1.80 to 10.48; p<0.01), and with organ damage accrual over the study period (change in SDI >0) (OR 2.34; 95% CI 1.02 to 5.36, p=0.04) (table 2). Only six patients (6/116, 5.2%) recorded new cardiovascular damage as captured by the SDI. MetS was not statistically significantly associated with glucocorticoid use (OR 0.94; 95% CI 0.35 to 2.53, p=0.90) or cumulative glucocorticoid dose, nor was it statistically significantly associated with high disease activity over time (AMS ≥4) (OR 1.44; 95% CI 0.64 to 3.21, p=0.38) or LLDAS (OR 0.97; 95% CI 0.40 to 2.32, p=0.94). No statistically significant associations were observed between MetS and age at diagnosis, gender or ethnicity, or other clinical variables including disease activity (TAM-SLEDAI), antimalarial exposure or flare (table 2). The association of baseline organ damage (SDI >0) with presence of MetS remained significant following adjustment for damage accrual and age at diagnosis (adjusted OR 3.36; 95% CI 1.32 to 8.59; p=0.01), while other associations observed in univariable model were attenuated (table 2).
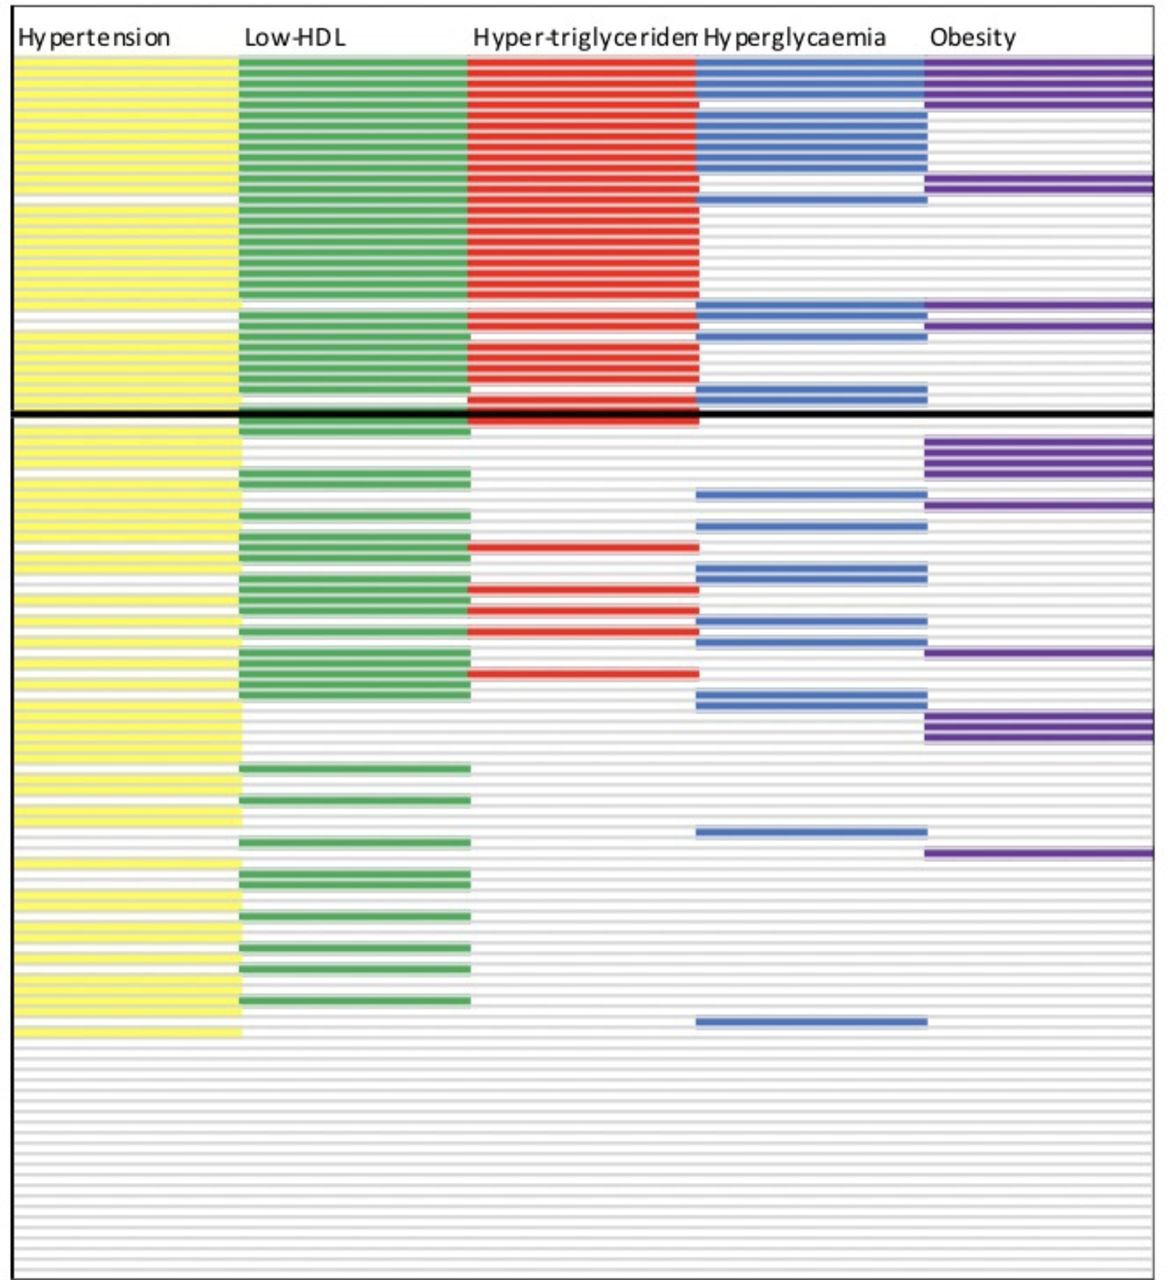
Heatmap of the components of the MetS in SLE patients. SLE patients (N =116, shown one per row) were assessed for components of MetS. Patients above the bold line fulfilled the diagnostic criteria for MetS (≥3/5 components).
Univariable and multivariable associations between demographic and clinical SLE characteristics with MetS
Prevalence and association of individual components of MetS in SLE
Figure 1 illustrates that over 80% (95/116) of patients in the cohort had at least one component of the MetS, while the median (Q1, Q3) number of MetS components per patient was 2 (1, 3). The prevalence of components of the MetS is shown in table 3, with arterial hypertension the most common component (59%). Sixteen per cent of patients (19/116) had a BMI defined as obese (BMI >30), with a further 25% (29/116) having a BMI in the overweight category (BMI 25–30).
Prevalence of MetS and its components in patients with SLE
We next analysed the association between clinical variables and obesity. Patients that were exposed to glucocorticoids during the study (n=93) had a significantly lower final median BMI compared with those that were not (n=23) (23.3 kg/m2 vs 27.0 kg/m2, p=0.02). While the prevalence of obesity was higher in the group not exposed to glucocorticoids (26% (6/23) vs 14% (13/93)), this did not reach statistical significance (p=0.16). In univariable analysis, older age at diagnosis (>60 years) was positively associated with obesity, while negative associations were found with Asian ethnicity, prednisolone exposure and disease activity with obesity (online supplemental table 2). In the multivariable model, the association between an older age at diagnosis and obesity remained significant but other associations attenuated (online supplemental table 2). Obesity was not statistically significantly associated with damage accrual.
Supplemental material
Fifty-nine per cent of patients (68/116) fulfilled criteria for arterial hypertension. Three-quarters (51/68) of these patients were on antihypertensive medications. Nine per cent (10/116) of patients had a history of renal disease at baseline, with 90% (9/10)) fulfilling criteria for arterial hypertension and 70% were on antihypertensive medications. There was no statistically significant association found between baseline renal disease or glucocorticoid exposure with arterial hypertension in univariable analysis (data not shown).
Fifty-one per cent and 32% of patients fulfilled MetS diagnostic criteria for low HDL and hypertriglyceridaemia, respectively. Less than one-third of patients (34/116) were on lipid-lowering therapies. The median fasting blood glucose recorded was 4.7 (4.4–5.2). Twenty-two per cent of the cohort had high fasting glucose. There were no statistically significant differences in lipid profiles or prevalence of hyperglycaemic in patients exposed to glucocorticoids (data not shown).
MetS and adipocytokines
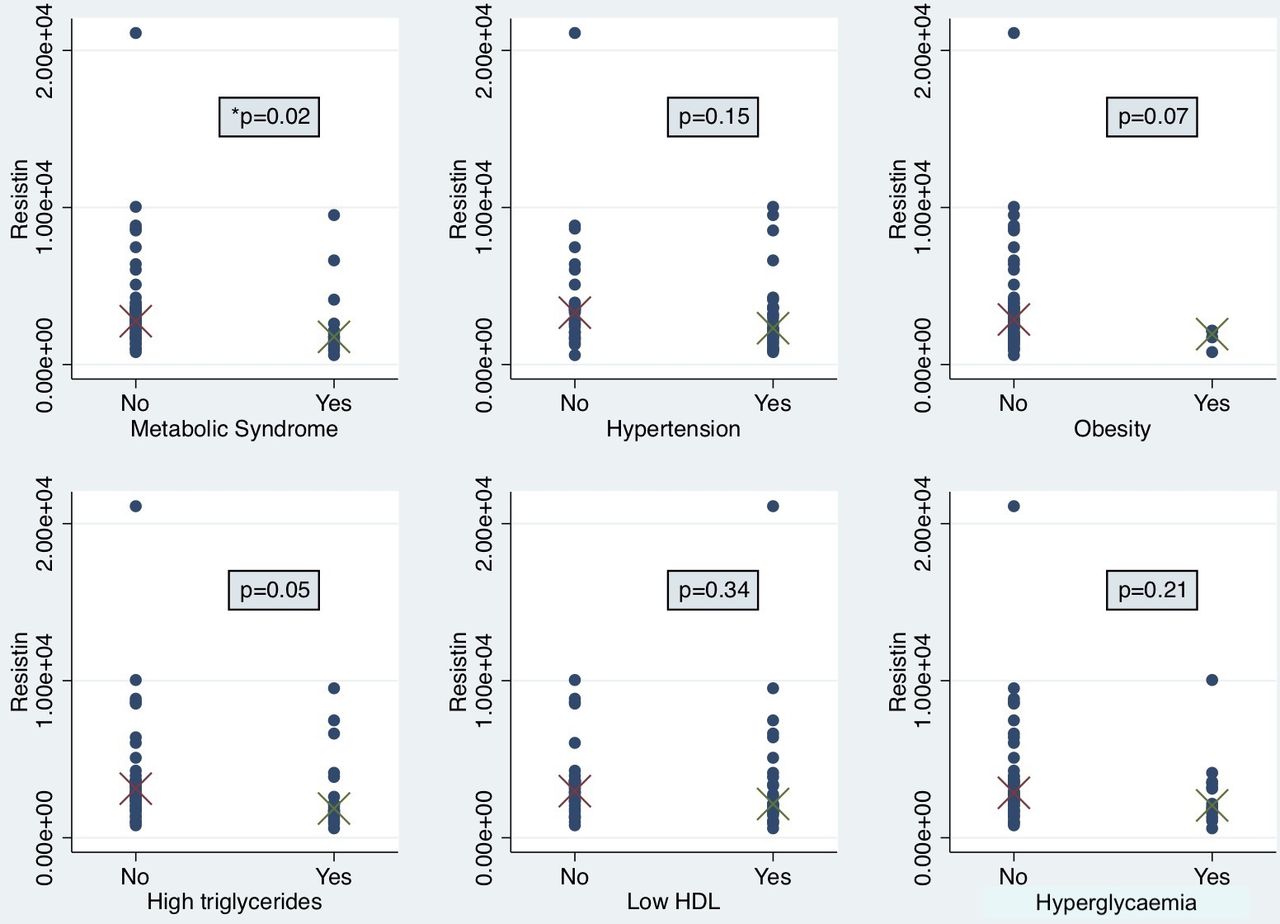
Serum samples matching MetS assessments were available on 59 patients, with the concentrations of measured biomarkers shown in table 4. Lower serum concentrations of resistin were statistically significantly associated with the presence of MetS (OR 0.17; 95% CI 0.04 to 0.70; p=0.01) and hypertriglyceridaemia (OR 0.2; 95% CI 0.08 to 0.91; p=0.03) (table 4). Serum resistin concentrations were statistically significantly lower in patients with MetS compared with those without (median (Q1, Q3) 3170 ng/mL vs 1760 ng/mL, respectively; p=0.02) (figure 2). Of the individual components of MetS, patients with high triglyceride had lower serum concentrations of resistin with borderline statistical significance compared with those without (median (Q1, Q3) 1858 ng/mL vs 3124 ng/mL, respectively; p=0.05). Lower serum concentrations of lipocalin-2 were also associated with MetS (OR 0.25; 95% CI 0.07 to 0.92; p=0.04). There were no statistically significant associations seen between serum concentrations of MCP-1, TNF, IL-6 or insulin with the MetS or its components.
Serum adipocytokine concentrations and associations with MetS and its components in SLE

Serum resistin concentrations in SLE patients categorised according to MetS and its individual components. Differences in serum resistin concentrations (pg/mL) according to the presence of (A) MetS, (B) arterial hypertension, (C) obesity, (D) high triglycerides, (E) low HDL and (F) hyperglycaemia analysed using Wilcoxon rank-sum test in n = 59 patients. HDL, high-density lipoprotein.
Discussion
The presence of MetS may be important to diagnose in patients with SLE, as a potential contributor to the higher risk of accelerated atherosclerosis and cardiovascular disease. Here, we evaluated the prevalence and clinical associations of MetS in SLE. Using established diagnostic criteria, MetS was identified in 29% of patients with SLE. Four out of five patients had at least one component of the MetS, highlighting the significant burden of comorbidities in SLE. The most common component of MetS observed was arterial hypertension, followed by dyslipidaemia, hyperglycaemia and obesity. Baseline organ damage was statistically significantly and independently associated with the presence of MetS. Surprisingly, glucocorticoid use was not associated with MetS in this cohort. Lower serum concentrations of resistin and lipocalin-2 were statistically significantly associated with the presence of MetS in SLE.
MetS is recognised to have greater significance than simply that of a cluster of risk factors in the prediction of cardiovascular disease.34 Through the release of adipokines, a cascade of low-grade chronic inflammation, insulin resistance and enhanced oxidative injury to vessels and tissues is triggered. It has previously been suggested that the risk of MetS in SLE is approximately double that of control populations.13 The prevalence of MetS in our cohort was 29%, which is in line with the pooled prevalence of 26% reported in a recent meta-analysis of multinational SLE patients.13 The prevalence of MetS in SLE has geographical variation, with patients from Europe and Asia having lower prevalence when compared with Africa and South America.13 This is considered to be associated with a combination of genetic predisposition along with environmental and lifestyle factors, such as diet. In addition, in common with worldwide trends in obesity, the prevalence of MetS in the general population has been steadily increasing since 2006, with a pooled prevalence in 2006–2010 of 23%, compared with a pooled prevalence after 2016 of 30%.13
We found a significant association between organ damage and the presence of MetS, with both baseline and damage accrual significant in univariable analysis and baseline damage remaining significant after adjustment. In an extant, rather than inception, cohort, organ damage at study entry is contributed to by exposures prior to enrolment, most likely to active disease and glucocorticoid treatment, as these are the major risk factors for damage accrual.1 19 Although we did not find associations between MetS and these variables during the observation period, we cannot exclude a contribution to the risk of MetS linked to these risk factors for damage accrual. We did not find any significant association between LLDAS and MetS and hypothesise that the cohort size may have constrained the ability to find a significant association. Additionally, unexpectedly, no association was seen with antimalarial use and MetS. Antimalarials have been found to exhibit favourable effects on lipid profile and glucose control, with studies finding lower level of triglycerides, low-density lipoproteins, and increased HDL in patients with SLE using hydroxychloroquine, along with lower insulin resistance and decreased fasting insulin levels,35 36 with previous study finding an association with lower prevalence of MetS in SLE.37 Alternatively, risk factors for MetS, potentially including adipocytokines, could be novel risk factors for organ damage accrual in SLE; this requires further investigation.
Glucocorticoid use has been found to indirectly contribute to the risk of atherosclerosis by increasing the levels of traditional coronary artery disease risk factors (hypercholesterolaemia, arterial hypertension and obesity), and both lupus-induced injury to coronary vessels as well as glucocorticoid use have been reported to accelerate atherosclerosis in SLE.38 In our study, glucocorticoid use was not associated with either the presence of MetS, or any of its components. This was unexpected and may be explained by the predominantly young, female cohort, and by the low median dose of glucocorticoid used in this cohort.
Obesity was found in 16% of this cohort, with an additional 25% of patients classified as overweight. In data from the Australian Bureau of Statistics from 2014 to 2015 on the equivalent ‘median’ patient (female, age 45–54 years),39 the reported prevalence of obesity was 33%, which is much higher than in our SLE cohort. These findings indicate that BMI of patients with SLE are lower than in the general community. We investigated if high SLE disease activity or organ damage contributed to lower BMI and found no association between BMI and high disease activity, or damage either at baseline, or accrued. Unexpectedly, we report that the BMI of patients with SLE exposed to glucocorticoids was lower than in patients not exposed to glucocorticoids, although glucocorticoid use was not associated with obesity in multivariable analysis. The possibility that the ethnic diversity of our cohort contributed to this finding was further explored. Asian ethnicity was negatively associated with obesity in univariable analysis, although this association attenuated in multivariable analysis. The lower BMI in patients with SLE exposed to glucocorticoids, that is, the majority of patients with SLE, highlights the complexity of analysing MetS in this condition, and relationships between genetics, disease factors, medications and body weight, in SLE. It is possible that a modified MetS definition emphasising components other than obesity and, including therapies, such as glucocorticoids, could have more utility in SLE, along the lines of modified cardiovascular risk calculators generated for use in SLE.6
While we know that MetS and its associated components are prevalent in SLE, specific recommendations for the management of these in SLE are currently lacking. Broadly, the recommendations for arterial hypertension would be aiming for blood pressure <130/80,40 particularly in the subset of patients with renal involvement. With regards to dyslipidaemia, both statins and fibrates have been shown to reduce triglycerides while also increasing HDL,41 thereby reducing proinflammatory cytokines. Generally, the recommendations for body weight would suggest a BMI <25 kg/m2 should be aimed for40; however, the safety and efficacy of antiobesity medications or bariatric surgery in SLE are unknown.
The analysis of adipocytokines in SLE has yielded mixed results to date. In particular, the role of resistin in insulin sensitivity and obesity remains unclear. The role of resistin in SLE has been little studied. A meta-analysis of case–control studies in patients with SLE and rheumatoid arthritis (RA) did not reveal an increase in resistin levels in patients with SLE,42 but did so in RA. In a study by Chung et al, no association between resistin levels and MetS or its components in SLE was found.43 This is in contrast to our results that show an inverse relationship between high resistin levels and MetS. The differing results may be related to differences in patient characteristics. In particular, median BMI in our cohort was 23.5 kg/m2 compared with 29.5 kg/m2 in Chung et al, and Caucasian ethnicity was lower in our cohort (52% vs 68%, respectively). We acknowledge that these findings were unexpected and contrary to the biological rationale. Lipocalin-2, a less well-studied and novel adipocytokine, has been found to be upregulated in adipose tissue of obese animals.44 45 Interestingly, it has been recently suggested as a biomarker in neuropsychiatric lupus.46 Zhang et al47 did not find an association between plasma lipocalin-2 and higher BMI or increased disease activity in SLE. We found higher serum lipocalin-2 concentrations to be negatively associated with MetS in SLE, although similarly to Zhang et al, we did not find any association with obesity or other components of the MetS. Of interest, other studies of adipocytokines in SLE have found unexpected findings, such as those of Reynolds et al,48 who reported an unexpected positive association between atheromatous plaque and adiponectin; adiponectin was not included in the panel studied here and such results would be of interest in future studies.
There are some limitations of this study and differences to previously reported cohorts. It is a single-centre study with a moderate-sized cohort analysed. However, many years of longitudinal data were available, informing analysis of time-adjusted disease activity, cumulative glucocorticoid dose exposure and damage accrual. We did not formally capture cardiovascular events other than via the relevant domains of the SDI, whereby six events were captured over the study period. These are relatively infrequent events, particularly in a cohort of predominantly young, female patients. Our lupus cohort is fairly contemporary, with data collection from 2007 onwards, potentially influencing the glucocorticoid doses documented here compared with historical cohorts. Disease activity, flare rates and damage accrual of our cohort were on par with other international cohorts.49 Nineteen per cent of patients had a disease duration less than 1 year at enrolment, but this group was too small to provide useful information regarding timing of the development of MetS in an inception subset. Arterial hypertension may have been overestimated in this study, as the MetS criteria for hypertension can be satisfied by the administration of antihypertensive treatment, and patients with lupus nephritis are often treated with ACE inhibitors or angiotensin receptor blockers.50 For the analysis of obesity, we chose to use the stringent WHO criteria of BMI >30 kg/m2, which may underestimate rates of obesity in our cohort.31 This modification, needed as waist circumference, was not collected in our dataset, has also been used in other studies of MetS in SLE.51 52 Our serum biomarker observations are based on a cross-sectional analysis and only in a subset of patients where a biosample was available. Multiple measurements of a broader panel of adipocytokines over time are likely to provide additional information.
In conclusion, we confirm that MetS is common in a multiethnic cohort of patients with SLE. Baseline organ damage was independently associated with the presence of MetS, consistent with a high risk of adverse outcome in SLE patients with irreversible organ damage. Surprisingly, glucocorticoid use during the period of observation was not associated with the presence of MetS. Serum resistin and lipocalin-2 were negatively associated with MetS in SLE. Whether the presence of MetS increases the already-high prevalence of cardiovascular events in SLE requires longer follow-up in a larger cohort, and the prevalence of MetS we observed suggests that such studies are warranted. Investigating the kinetics of adipocytokines in this context may provide further information regarding the link between MetS and adverse outcomes in SLE.
References
Supplementary materials
Supplementary Data
This web only file has been produced by the BMJ Publishing Group from an electronic file supplied by the author(s) and has not been edited for content.
Footnotes
Presented at Manuscripts based on work previously presented at a conference and published as a conference abstract (2020).
Contributors DA and EM designed the study. All authors collected the data and performed the study analyses. DA wrote the manuscript. All authors read and approved the final version of the manuscript.
Funding The authors have not declared a specific grant for this research from any funding agency in the public, commercial or not-for-profit sectors.
Competing interests None declared.
Patient consent for publication Not required.
Provenance and peer review Not commissioned; externally peer reviewed.
Data availability statement All data relevant to the study are included in the article or uploaded as supplementary information.
Supplemental material This content has been supplied by the author(s). It has not been vetted by BMJ Publishing Group Limited (BMJ) and may not have been peer-reviewed. Any opinions or recommendations discussed are solely those of the author(s) and are not endorsed by BMJ. BMJ disclaims all liability and responsibility arising from any reliance placed on the content. Where the content includes any translated material, BMJ does not warrant the accuracy and reliability of the translations (including but not limited to local regulations, clinical guidelines, terminology, drug names and drug dosages), and is not responsible for any error and/or omissions arising from translation and adaptation or otherwise.