Article Text

Abstract
Objective Quinolinic acid (QA), a kynurenine (KYN)/tryptophan (TRP) pathway metabolite, is an N-methyl-D-aspartate receptor agonist that can produce excitotoxic neuron damage. Type I and II interferons (IFNs) stimulate the KYN/TRP pathway, producing elevated QA/kynurenic acid (KA), a potential neurotoxic imbalance that may contribute to SLE-mediated cognitive dysfunction. We determined whether peripheral blood interferon-stimulated gene (ISG) expression associates with elevated serum KYN:TRP and QA:KA ratios in SLE.
Methods ISG expression (whole-blood RNA sequencing) and serum metabolite ratios (high-performance liquid chromatography) were measured in 72 subjects with SLE and 73 healthy controls (HCs). ISG were identified from published gene sets and individual IFN scores were derived to analyse associations with metabolite ratios, clinical parameters and neuropsychological assessments. SLE analyses were grouped by level of ISG expression (‘IFN high’, ‘IFN low’ and ‘IFN similar to HC’) and level of monocyte-associated gene expression (using CIBERSORTx).
Results Serum KYN:TRP and QA:KA ratios were higher in SLE than in HC (p<0.01). 933 genes were differentially expressed ≥2-fold in SLE versus HC (p<0.05). 70 of the top 100 most highly variant genes were ISG. Approximately half of overexpressed genes that correlated with KYN:TRP and QA:KA ratios (p<0.05) were ISG. In 36 IFN-high subjects with SLE, IFN scores correlated with KYN:TRP ratios (p<0.01), but not with QA:KA ratios. Of these 36 subjects, 23 had high monocyte-associated gene expression, and in this subgroup, the IFN scores correlated with both KY:NTRP and QA:KA ratios (p<0.05).
Conclusions High ISG expression correlated with elevated KYN:TRP ratios in subjects with SLE, suggesting IFN-mediated KYN/TRP pathway activation, and with QA:KA ratios in a subset with high monocyte-associated gene expression, suggesting that KYN/TRP pathway activation may be particularly important in monocytes. These results need validation, which may aid in determining which patient subset may benefit from therapeutics directed at the IFN or KYN/TRP pathways to ameliorate a potentially neurotoxic QA/KA imbalance.
- Interferon Type I
- Lupus Erythematosus, Systemic
- Autoimmunity
Data availability statement
All data relevant to the study are included in the article or uploaded as supplementary information.
This is an open access article distributed in accordance with the Creative Commons Attribution Non Commercial (CC BY-NC 4.0) license, which permits others to distribute, remix, adapt, build upon this work non-commercially, and license their derivative works on different terms, provided the original work is properly cited, appropriate credit is given, any changes made indicated, and the use is non-commercial. See: http://creativecommons.org/licenses/by-nc/4.0/.
Statistics from Altmetric.com
WHAT IS ALREADY KNOWN ON THIS TOPIC
Type I and II interferons (IFNs) contribute to SLE pathogenesis and stimulate the kynurenine (KYN)/tryptophan (TRP) pathway, producing elevated quinolinic acid (QA) relative to kynurenic acid (KA).
An elevated QA:KA ratio, a potential neurotoxic imbalance, associated with poor working memory performance in subjects with SLE when controlling for other factors known to affect cognition.
WHAT THIS STUDY ADDS
High IFN-stimulated gene expression in subjects with SLE correlated with elevated KYN:TRP ratios, suggesting IFN-mediated KYN/TRP pathway activation, and with elevated QA:KA ratios in a subset of subjects with SLE with high monocyte-associated gene expression.
These results support IFN-mediated KYN/TRP pathway activation in SLE and suggest that this pathway may be particularly important in monocytes.
HOW THIS STUDY MIGHT AFFECT RESEARCH, PRACTICE OR POLICY
These results require further validation in a separate cohort and may help identify which subset of patients with SLE may benefit from therapeutics targeting the IFN or KYN/TRP pathways to ameliorate a potentially neurotoxic QA/KA imbalance.
Introduction
Cognitive dysfunction (CD) is highly prevalent in SLE with significant impact on quality of life.1 Quinolinic acid (QA), a metabolite of the kynurenine (KYN)/tryptophan (TRP) pathway, is a N-methyl-D-aspartate receptor (NMDAR) agonist that can cause excessive glutamatergic excitotoxicity to neurons2 and may contribute to CD in SLE. The first step in the KYN/TRP pathway is regulated by indolamine 2,3-dioxygenase (IDO1), an enzyme that is readily induced by interferons (IFNs) that are also highly associated with SLE pathogenesis and possibly with disease subtypes.3 4 The objective of this study was to investigate whether serum levels of KYN/TRP pathway metabolites, including the potentially neurotoxic QA, correlate with peripheral blood type I (interferon alpha (IFN-α)) and type II (interferon gamma (IFN-γ)) interferon-stimulated gene (ISG) expression in SLE.
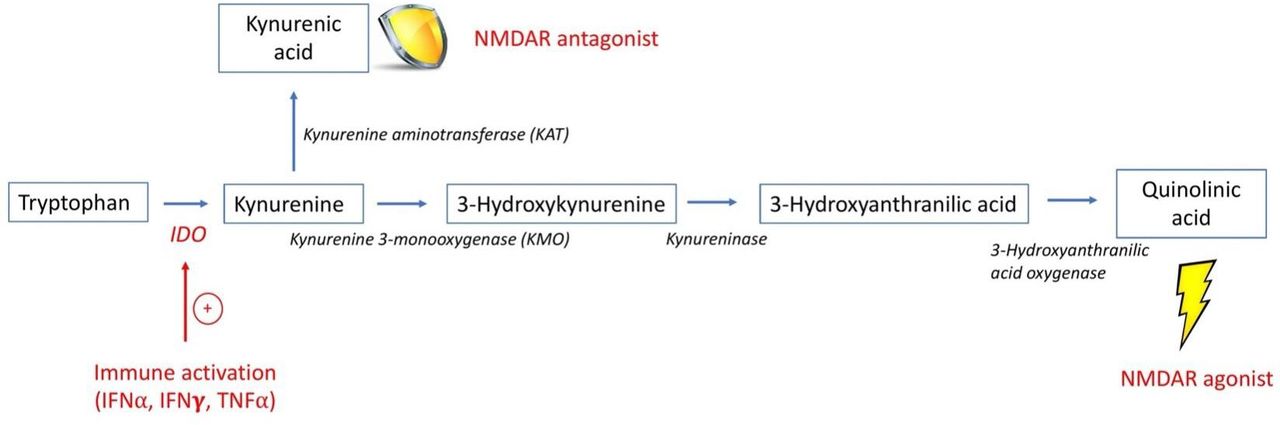
The enzyme IDO1 is present in most tissues and immune cells including monocytes, dendritic cells and microglia.5 IDO1 is most highly expressed during inflammation,5 and activation by IFN-γ, IFN-α, tumour necrosis factor alpha and interleukin-66–8 stimulates TRP degradation to KYN.7 KYN is further metabolised to QA and kynurenic acid (KA), an NMDAR antagonist with potential to protect neurons from excitotoxic damage2 (figure 1). Under inflammatory conditions, increased QA production relative to KA results in a potential neurotoxic imbalance,2 and an elevated serum QA:KA ratio may be a marker for central NMDAR activation and neurotoxicity. IDO1 expression in monocytes is strongly induced by IFN, including IFN-α,9 10 and monocytes have been reported to be more potent QA producers than microglia.11 12

The kynurenine/tryptophan pathway.1 This is a simplified schematic of the KYN/TRP pathway, highlighting the intermediates and enzymes involved in the production of QA and KA. The enzyme IDO1 is stimulated by inflammatory cytokines, such as IFN, that results in the breakdown of TRP into KYN. KYN may be further metabolised by KMO ultimately to QA, an NMDAR agonist, or by KAT to KA, an NMDAR antagonist. Since the enzyme KMO has higher affinity for KYN than KAT, metabolism proceeds preferentially towards the production of QA in the setting of inflammation.2 ,26 61 IDO1, indolamine 2, 3-dioxygenase; IFN-α, interferon alpha; IFN-γ, interferon gamma; KA, kynurenic acid; KMO, kynurenine 3-monooxygenase; NMDAR, N-methyl-D-aspartate receptor; QA, quinolinic acid; TNF-α, tumour necrosis factor alpha.
Both peripheral and central IDO1 activation by IFN may increase KYN/TRP pathway activation and contribute to elevated QA in the central nervous system (CNS). Some cytokines, including both type I and II IFNs, can cross an intact blood–brain barrier (BBB).2 13 KYN and TRP also easily cross an intact BBB, in contrast to the metabolites QA and KA that cross relatively poorly.2 14 Nonetheless, several human studies report positive correlations between QA levels in blood and cerebrospinal fluid (CSF).15–17 Recent evidence of a disrupted BBB in SLE18 19 suggests that peripheral molecules may more readily access the CNS with subsequent effects on neurons and/or microglia.2 20
An imbalance in QA relative to KA is implicated in the pathogenesis of CD in other neurodegenerative diseases, idiopathic depression and suicidal ideation, and depression related to IFN-α treatment for hepatitis C.2 21–24 In subjects with SLE, elevated serum QA is reported,25–27 which correlated with CSF levels.25 Additionally, we have reported a significant association between elevated serum QA:KA ratios and poor working memory performance in subjects with SLE when controlling for other factors known to affect cognition.26
The IFN pathway is recognised as a fundamental pathological mechanism in SLE supported, in part, by the clinical efficacy of an anti-type I IFN receptor monoclonal antibody.3 28 Due to the poor sensitivity and specificity of assays measuring IFN levels directly, most human SLE studies have measured IFN indirectly by quantifying ISG expression, collectively called the ISG signature. Multiple methodologies have been used to define the ISG signature in whole blood and specific cell types; however, there is no consensus as to which ISG best associates with functional biological processes driven by IFN.3 There is also a significant overlap between type I and type II ISG signatures in SLE.29 Pertinent to our study, it has been previously reported that serum KYN/TRP levels correlated with type I IFN activity measured by a WISH cell reporter assay.7
We have previously demonstrated elevated serum KYN:TRP and QA:KA ratios in SLE26 and speculated that this may have been a result of IFN-mediated IDO1 induction. Using RNA sequencing (RNAseq) for quantification of peripheral blood gene expression, we sought to determine relationships between whole-blood ISG expression and serum KYN:TRP and QA:KA ratios in subjects with SLE versus healthy controls (HCs). We hypothesised that ISG expression would correlate with KYN/TRP pathway metabolites. Given the results of in vitro studies revealing more effective IFN-mediated IDO1 induction in monocytes rather than lymphocytes,9 30–33 we also examined the relationship between ISG expression and elevated KYN:TRP and QA:KA ratios as a function of peripheral monocyte-associated gene expression.
Methods
Study design, subject selection and assessments
For this cross-sectional study, 72 female subjects with SLE were recruited from the Northwell Health Rheumatology Clinics as part of a previously described cohort.26 All were ≥18 years old and fulfilled either the American College of Rheumatology or Systemic Lupus International Collaborating Clinics criteria for SLE.34 35 Seventy-three female HCs, comparable to subjects with SLE in age, ethnicity and race, were recruited to the same cohort.26 SLE disease activity was assessed using the SELENA-SLEDAI (SLE Disease Activity Index),36 and blood was drawn from all subjects into PAXgene tubes, frozen and stored for analysis. For all subjects, cognition was assessed using the Automated Neuropsychological Assessment Metrics (ANAM) computerised test battery and a 2×2 array to assess object recognition and spatial memory, as previously described.37 Throughput scores (accuracy÷reaction time) were the primary measures of cognitive efficiency. Depression was assessed using the Beck Depression Inventory.38 Testing was administered in a quiet room to minimise distractions. All blood collections, clinical and neuropsychological assessments were performed within a 10-day period.
Patient and public involvement
Patients were not directly involved in the design, recruitment or conduct of the study.
Measurement of KYN/TRP pathway metabolites
Metabolite concentrations in deidentified, blinded serum samples were measured by Charles River Laboratories (www.criver.com) using high-performance liquid chromatography with tandem mass spectrometry (online supplemental methods, A).
Supplemental material
RNA sequencing
Deidentified, blinded whole-blood samples in PAXgene Blood RNA tubes were shipped to Cold Spring Harbour Laboratory, New York, frozen on dry ice, for RNAseq analysis. Details of RNA isolation and quality control measures, as well as library preparation and RNAseq technique, are described in online supplemental methods, B.
Statistical analyses
Gene expression analysis
RNAseq analysis compared global gene expression profiles of subjects with SLE versus HC. STAR V.2.6.139 index was created based on the human GRCh38 Ensembl genome and gene annotations. Single-end 76-base pair reads were directly mapped to this index with command line option ‘--outFilterMismatchNmax 3 outFilterMultimapNmax 20 --winAnchorMultimapNmax 50’. FeatureCounts software package V.2. 0.040 was then used to estimate relative gene expressions with parameter setting ‘--fraction --minOverlap 10’ on the alignments generated by STAR. All genes with at least one of the libraries above zero reads were compared between SLE and HC using DESeq2.41 Differentially expressed genes were defined as a fold change of ≥2; p value adjusted for multiple comparisons of <0.05. A heat map was constructed to represent differentially expressed genes in SLE versus HC. Gene ontology (GO) term enrichment analysis was performed using DAVID Functional Annotation Tool.42 The complete list of GO term categories with significant enrichment was extracted. An unsupervised principal component analysis (PCA) was performed to evaluate gene expression differences between subjects with SLE and HC, and among subjects with SLE only.
Identification of ISGs, derivation of IFN scores and derivation of ISG expression subgroups
ISGs were identified from published ISG sets from Arazi et al43 in their study of IFN response in infiltrating cells in lupus nephritis (n=110 ISG), Chiche et al29 in their characterisation of the whole-blood IFN signature (n=148 ISG) and the Interferome database44 (online supplemental methods, C).
IFN scores were derived for each subject to quantify individual total ISG expression for analyses of associations with metabolite ratios and clinical parameters. Individual ISG expression was quantified using z-scores of normalised and variance stabilised gene expression (Z-IFN score) (online supplemental methods, D1). Due to the absence of a ‘standard ISG signature for IFN-α’, two Z-IFN scores were determined for each subject. An ‘ISG-A score’ was derived from the 110 ISG reported by Arazi et al,43 which included ISGs responsive to both type I and II IFN. A ‘19 type 1 ISG score’ was derived from a subset of 19 of the 110 ISG reported as more responsive to type I than to type II IFN, according to Chiche et al29 (online supplemental methods, D2).
The distribution of Z-IFN scores in subjects with SLE, compared with the distribution in HC, was used to determine SLE subgroups based on ISG expression levels. These IFN subgroups were defined as ‘IFN high’ for subjects with a Z-IFN score of ≥2, ‘IFN low’ for subjects with a Z-IFN score of ≥1 to <2, and ‘IFN similar to HC’ for subjects with a Z-IFN score of <1.
Cell-type deconvolution using CIBERSORTx and derivation of monocyte-associated gene expression subgroups
Whole-blood, bulk RNAseq expression was deconvolved into single-cell proportions using CIBERSORTx,45 which provided the relative cell fractions out of 22 immune cell subtypes that are actively involved in innate and adaptive immunity. The distribution of monocyte-associated gene expression in subjects with SLE was compared with the distribution in HC to determine subgroups of subjects with SLE based on the level of monocyte-associated gene expression. As the distribution of monocyte-associated gene expression in subjects with SLE was similar to HC, high monocyte-associated gene expression (‘monocyte high’) was defined as expression of >HC mean, while low monocyte-associated gene expression (‘monocyte low’) was defined as expression of ≤HC mean.
Clinical, neuropsychological testing and metabolite associations with gene expression
Differences in subject characteristics, metabolite ratios, and monocyte-associated gene expression between SLE and HC subjects were assessed using t-tests, Mann-Whitney U tests or χ2 tests. Differences in neuropsychological test performance among subjects with SLE grouped by IFN scores and monocyte-associated gene expression were assessed using t-tests or Mann Whitney U tests. Spearman’s correlations (rs) were used to evaluate relationships between metabolite ratios (KYN:TRP and QA:KA) and IFN scores, between monocyte-associated gene expression and peripheral blood monocyte counts, and among SELENA-SLEDAI scores, IFN scores, monocyte-associated gene expression and metabolite ratios. Significant correlations had a p value of <0.05. Correction for multiple comparisons was performed using Benjamini-Hochberg procedure with a false discovery rate of ≤0.1. A more permissive false discovery rate was chosen because the risk of missing a potentially important association (false negative) is greater than the risk of a false association (false positive), given that this is the first study to evaluate the relationship between ISG expression and both KYN:TRP and QA:KA ratios in patients with SLE. Differences in SELENA-SLEDAI scores among the IFN-high, IFN-low and IFN similar to HC subgroups of subjects with SLE were assessed using a Kruskal-Wallis test with a post hoc Dunn-Bonferroni correction for multiple comparisons. GO database was used to identify biological processes associated with genes other than ISG that positively correlated with the KYN:TRP and QA:KA ratios.
Results
Subject characteristics and KYN/TRP pathway metabolite ratios
Subjects with SLE demonstrated significantly higher serum KYN:TRP and QA:KA ratios compared with HC (table 1). Subjects with SLE were racially diverse, reflective of disease demographics, with a wide range of disease activity (SLEDAI scores ranging 0–29) and medication use. There were no demographic differences between SLE and HC.
Characteristics of subjects with SLE and HCs and KYN:TRP pathway metabolite ratios
Peripheral blood gene expression in subjects with SLE and HCs
Differential gene expression analysis revealed 933 genes with ≥2-fold differential expression in SLE versus HC, with 762 genes overexpressed and 171 underexpressed (p<0.05). ISG expression was analysed using two approaches. One approach included 110 ISG that respond to stimulation with both type I and II IFNs (termed ISG-A). The second approach included 19 of these 110 ISG that have been shown to be preferentially induced by type I IFN greater than type II IFN.29 The two approaches were chosen to determine whether type I IFN, given its association with SLE pathogenesis and as a treatment target, demonstrated similar associations with KYN/TRP pathway activation as type I and II IFNs combined. Of the 110 ISG-A,43 108 had ≥2-fold higher expression in SLE versus HC (mean fold change±SD=3.1±3.0, range=1.2–28.0) (figure 2). IDO1 was one of two ISGs from this set not significantly differentially expressed in SLE versus HC. The majority of subjects with SLE (59/72, 82%) had an IFN score based on ISG-A that was ≥1 SD above the HC mean. Of the 72 subjects with SLE, 36 (50%) were classified as IFN high, 23 (31.9%) as IFN low and 13 (18.1%) as IFN similar to HC. The two ISG selection approaches (ISG-A (approach 1) and 19 type I ISG (approach 2)) used to define these IFN subgroups yielded highly similar results; of the 36 IFN-high subjects with SLE identified by the ISG-A method, 35 (97%) were also identified as IFN high by the 19 type I ISG method.
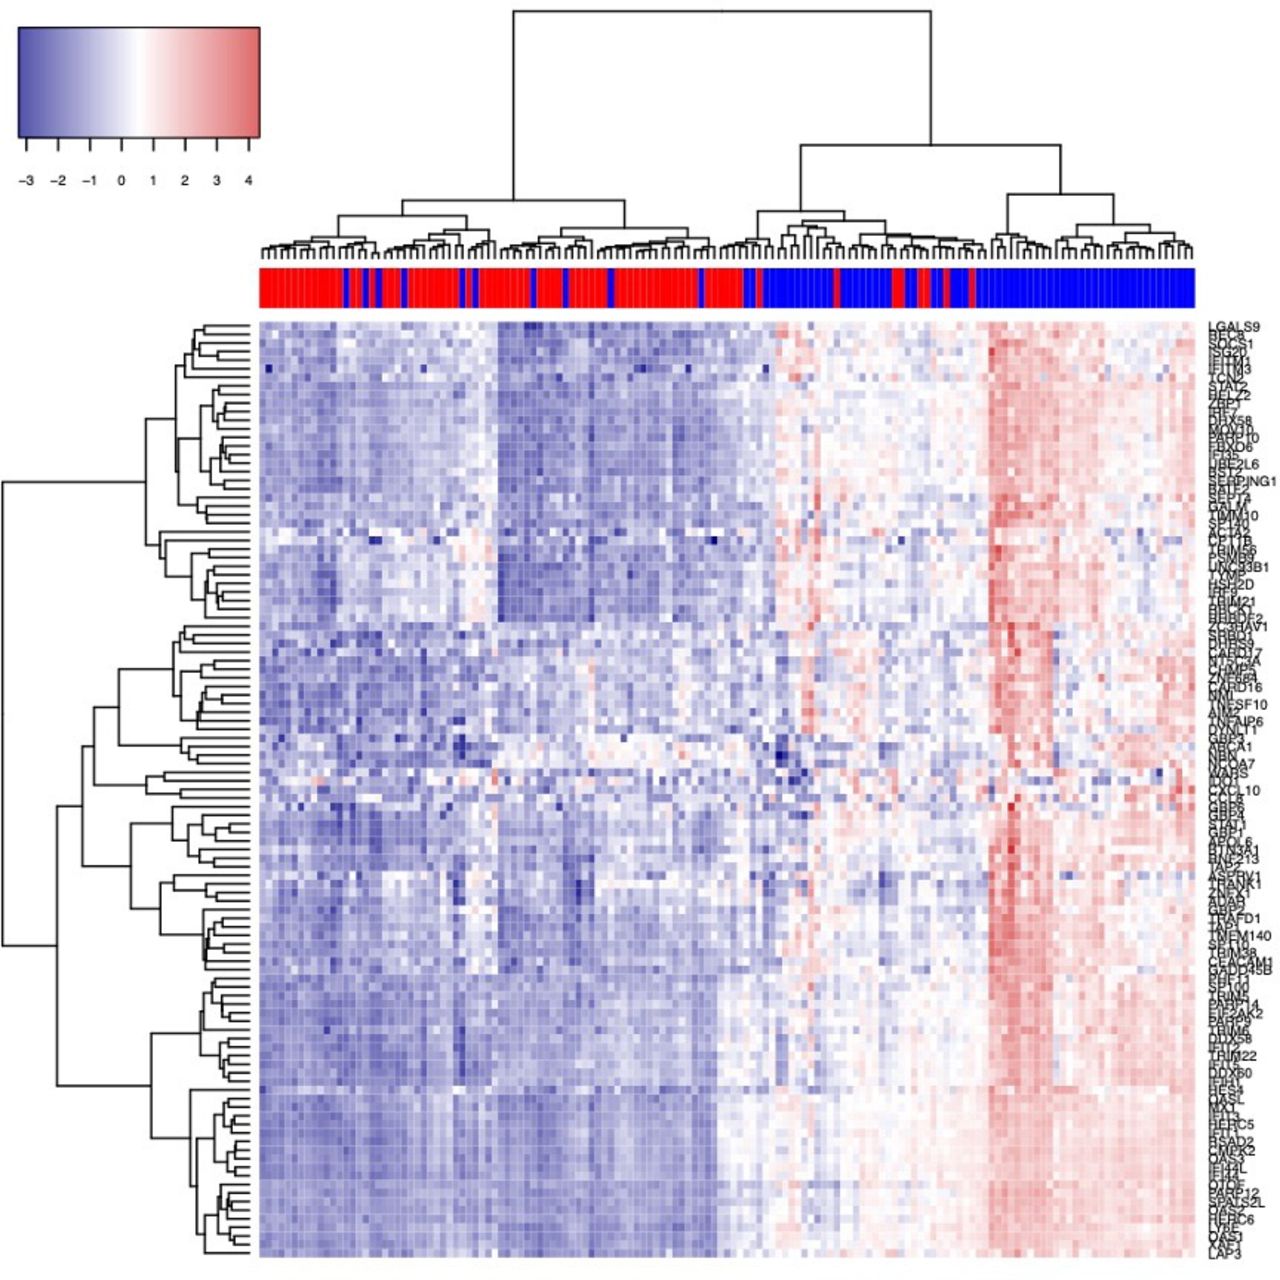
Heat map of expression of 110 interferon-stimulated genes43 in SLE compared with HC. Subjects with SLE indicated by blue in the colour bar above the map, and HC indicated by red. ‘Pheatmap’ package V.1.0.121 is applied on DESeq2 normalised and variance stabilised gene expression values to create the heat map.62 HC, healthy control.
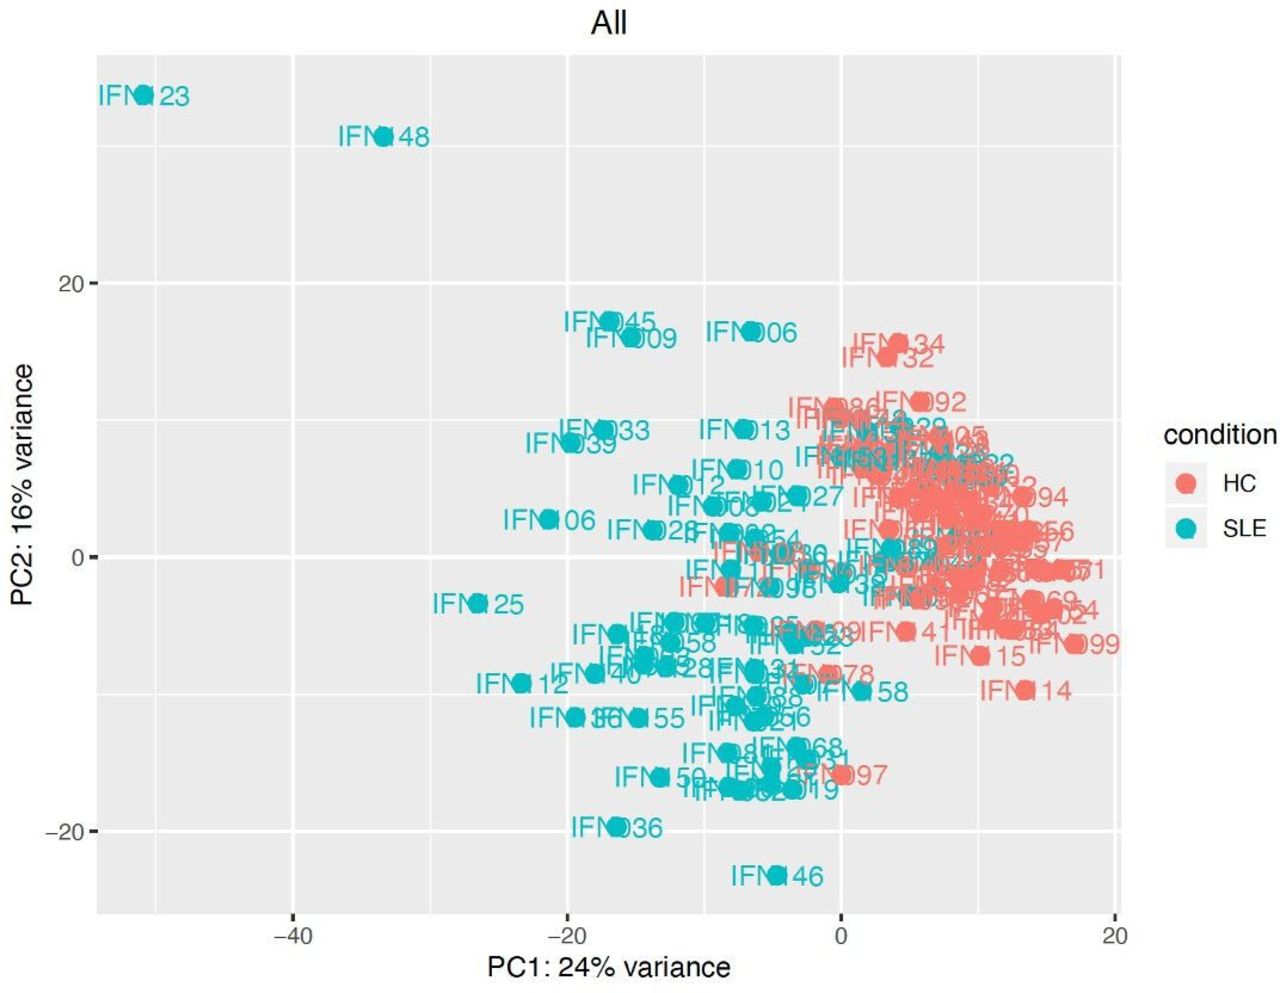
Unsupervised PCA revealed varied gene expression in SLE versus HC and clearly distinguished the two groups (figure 3). Seventy of the top 100 most highly variant genes identified by PCA according to the first principal component were ISG. Of these 70 ISG, 35 were identified in ISG-A and 35 from the Interferome database,44 and all were differentially expressed by a minimum twofold change versus HC. Unsupervised PCA of subjects with SLE alone did not differentiate subgroups based on variability in gene expression (figure 3).
PCA of gene expression in SLE compared with HC. PCA conducted on DESeq2 normalised, and variance stabilised gene expression values, using the function prcomp in R V.3.5,1 is displayed. The default top 500 most highly variant genes were selected.63 HC, healthy control; PCA, principal component analysis.
Relationships between KYN/TRP pathway metabolite ratios in subjects with SLE and ISG expression, individual IFN scores
Of the 762 overexpressed genes in subjects with SLE, 144 positively correlated with KYN:TRP ratios (p<0.05). Seventy-one (49%) of these were ISG (33 identified from the Interferome database44 and 38 from ISG-A43 or Chiche et al29), and 63 (89%) of these ISG were type I responsive (Interferome). Similarly, 81 of the 762 overexpressed genes positively correlated with QA:KA ratios in subjects with SLE (p<0.05). Thirty-eight (47%) of these were ISG (32 identified from the Interferome database44 and six from ISG-A43 or Chiche et al29), and 31 (82%) of these ISG were type I responsive (Interferome). A complete list of all genes that correlated with the KYN:TRP and QA:KA ratios is provided in online supplemental Data. Of the remaining 43/81 genes that correlated with QA:KA ratios, GO analysis revealed genes associated with immune function such as FcγR signalling, complement activation, regulation of the immune response, and antigen binding, as well as proteolysis. Six of the type I ISG had significant, positive correlations with both the KYN:TRP and QA:KA ratios (ATF3, CDK1, KLHDC7B, LAP3, MS4A4A, RMI2). LAP3, an ISG included in both ISG-A and the Chiche modules (Chiche et al), was also among the top 100 most variant genes in SLE versus HC by PCA.
Supplemental material
In all 72 subjects with SLE, IFN scores derived from ISG-A did not correlate with KYN:TRP ratios (rs=0.226, p=0.056), and IFN scores derived from the 19 type I ISG correlated weakly with KYN:TRP ratios (rs=0.294, p=0.012). Neither IFN score correlated with the QA:KA ratio (rs=0.060, p=0.617, and rs=0.120, p=0.314, respectively).
Patients with SLE display a range of ISG expression, with increased expression reported in 50–75%.3 We therefore analysed whether IFN scores correlated with KYN:TRP and QA:KA ratios among patients with SLE with high ISG expression (based on ISG-A). In 36 subjects with SLE with the highest ISG expression, both IFN scores (derived from ISG-A and the 19 type I ISG) correlated with KYN:TRP ratios, while no correlations were found with subjects with low ISG expression, or ISG expression similar to HC (table 2). The correlation between IFN scores and KYN:TRP ratios was independent of SLE-associated clinical variables, as no significant correlations were found between KYN:TRP ratios and SELENA-SLEDAI scores, anti-double stranded DNA, complement, or prednisone dose in this subgroup. No correlations were found between IFN scores and QA:KA ratios in the 3 SLE groups (table 2). Of note, there was no correlation between the IFN scores and metabolite ratios when the IFN-high and IFN-low subjects were combined into one group (n=59; data not shown), suggesting that the correlation between the IFN scores and the metabolite ratios is specific to the IFN-high group.
Correlations between IFN scores and serum KYN/TRP pathway metabolite levels in subjects with SLE according to ISG expression subgroup
Relationships between ISG expression and KYN:TRP pathway metabolite ratios in subjects with SLE stratified by monocyte-associated gene expression
Consistent with previous CIBERSORT studies in SLE,46 47 we found increased relative expression of monocyte-associated genes in SLE (mean±SD=0.188±0.072, range 0.010–0.362) versus HC (mean±SD=0.158±0.042, range 0.049–0.275) (p=0.003) that correlated with peripheral absolute monocyte counts from the complete blood count (rs=0.333, p=0.005). Of the 36 subjects with IFN-high SLE using ISG-A, 23 had relatively high monocyte-associated gene expression. In this subgroup, IFN scores correlated significantly with both KYN:TRP and QA:KA ratios (table 3). These correlations between IFN scores and metabolite ratios were independent of other SLE-associated variables, such as SELENA-SLEDAI scores, anti-doublestranded DNA, complement or prednisone dose. Conversely, IFN scores in the 13 IFN-high SLE with relatively lower monocyte-associated gene expression did not correlate with KYN:TRP or QA:KA ratios (table 3). Among subjects with SLE who were classified as IFN low or IFN similar to HC, no significant correlations were identified between IFN scores and metabolite ratios, regardless of the level of monocyte-associated gene expression.
Correlations between IFN scores and serum KYN/TRP pathway metabolite levels in subjects with SLE according to ISG and monocyte-associated gene expression subgroups
Correlations between SLE disease activity and IFN scores, monocyte-associated gene expression, KYN:TRP pathway metabolite ratios
Consistent with prior reports,3 29 both IFN scores (ISG-A and 19 type I ISG) positively correlated with disease activity measured by SELENA-SLEDAI (rs=0.237, p=0.045; ISG-A and rs=0.240, p=0.042; 19 type I ISG). Additionally, SELENA-SLEDAI scores were significantly higher in subjects with SLE classified as IFN high (6.4±5.6, range 0–29) compared with subjects with SLE classified as IFN similar to HC (2.2±2.2, range 0–6) (p=0.009). SELENA-SLEDAI scores in IFN low SLE (5.6±4.9, range 0–21) were not significantly different from IFN similar to HC,(p=0.073) or IFN high (p=1.000). SELENA-SLEDAI scores correlated modestly with QA:KA ratios (rs=0.238, p=0.044), while they did not correlate with KYN:TRP ratios (rs=0.002, p=0.990). Neither the monocyte-associated gene expression score (rs=0.238, p=0.044) nor peripheral monocyte counts (rs=−0.051, p=0.672) correlated with SELENA-SLEDAI. Of note, all correlations between IFN scores and metabolite ratios and SLEDAI scores were significant using a false discovery rate of 0.05, except the correlations between IFN scores and QA:KA ratios in the subjects with both high IFN scores and high monocyte-associated gene expression (n=23, table 3); these correlations were significant using a false discovery rate of 0.10.
Associations between neuropsychological test performance, IFN scores and monocyte-associated gene expression
Neuropsychological test performance was compared between the IFN high (n=36) and other subjects with SLE (IFN low+IFN similar to HC, n=36). There were no significant differences in cognitive scores including the ANAM subtests or 2×2 array or Beck Depression Inventory scores (all p>0.05). Comparison of neuropsychological test performance between subjects in the IFN-high and monocyte-high subgroups (n=23) and all other subjects with SLE (n=49) also found no significant differences in cognitive test scores (ANAM subtests and 2×2 array) or Beck Depression Inventory scores between these groups (all p>0.05).
Discussion
We report elevated ISG expression in SLE compared with HC that correlates with KYN/TRP pathway metabolites. The association between elevated ISG expression and an elevated KYN:TRP ratio corroborates evidence of IFN-mediated IDO1 induction from one previous study in subjects with SLE,7 and this is the first report of an association between elevated ISG expression and elevated QA:KA ratios, representing a potential neurotoxic imbalance that may contribute to cognitive impairment in SLE. The majority of ISG that correlated with KYN:TRP and QA:KA were type I ISG (89% and 82%, respectively), the predominant IFN associated with SLE pathogenesis. We observed that ISG expression correlated with both the KYN:TRP and QA:KA ratios in subjects with SLE with high monocyte-associated gene expression, consistent with in vitro studies demonstrating that IFN-induced KYN/TRP pathway activation is particularly important in monocytes.9 30–33 In aggregate, these results support our hypothesis that IFN-mediated KYN/TRP pathway activation contributes to elevated KYN:TRP and QA:KA ratios observed in patients with SLE.
The IFN scores correlated with KYN:TRP ratios in a subgroup of subjects with IFN-high SLE, but not with KYN:TRP ratios in SLE subgroups of IFN low or IFN expression similar to HC, suggesting IFN-induced IDO1 activation. It is conspicuous that IDO1 was among only two genes of the 110 ISG-A43 not differentially expressed in SLE versus HC. This finding conflicts with multiple studies demonstrating increased peripheral IDO1 activity in SLE versus HC,7 48 49 including one report that SLE sera increased IDO1 expression in a type I IFN-dependent manner.7 It is possible that IDO1 activity may vary based on SLE disease activity and medication use,48–51 which may have impacted IDO1 expression in our cohort. It is also possible that IDO1 expression is short-lived compared with protein expression (metabolite ratios) in the peripheral blood, and compensatory downregulation of IDO1 expression was captured by our measurement.
Despite a significant correlation between ISG expression and KYN:TRP ratios in the IFN-high SLE subgroup, ISG expression did not correlate with QA:KA ratios in this subgroup. Enzymes downstream of IDO1 in the KYN/TRP pathway, kynurenine 3-monooxygenase (KMO) and kynurenine aminotransferase (figure 1) lead to the production of QA and KA, respectively. However, genes encoding these enzymes were not differentially expressed in SLE versus HC (data not shown), suggesting that alteration of downstream enzymatic activity did not play a role in the lack of association with QA:KA. Nevertheless, in a subgroup of the 36 subjects with IFN-high SLE with high monocyte-associated gene expression, ISG expression did correlate with QA:KA ratios, suggesting that circulating monocytes may be important in IFN-mediated IDO1 induction. In vitro studies of cultured monocytes demonstrate expression of IDO1 and downstream KYN/TRP pathway enzymes (KMO and kynureninase, figure 1), resulting in the production of QA30 31 and a correspondingly elevated QA:KA ratio32 in response to stimulation by IFN-γ or toll-like receptor agonists. In contrast, IDO1 in B lymphocytes or T lymphocytes is poorly expressed,9 31 and stimulation of cultured B cells or T cells with IFN-γ produces little to no KYN and no QA.31 33 Further, recent single-cell RNAseq studies of peripheral blood mononuclear cells (PBMCs) in subjects with SLE revealed monocytes as the largest fraction of cell types with high ISG expression, and these ISG-expressing monocytes were enriched in those with the highest disease activity.52 53 In our study, we propose that high monocyte-associated gene expression, which correlated with high peripheral monocyte counts, suggests greater peripheral IDO1 which, in the setting of high IFN, leads to an elevated QA:KA ratio. Therefore, this potential relationship between monocytes and IFN-mediated induction of the KYN/TRP pathway in SLE, leading to an elevated QA:KA ratio, deserves further study.
We found that 19 of the 110 ISG-As that are reported to be more responsive to type I than type II IFN displayed similar correlations with the metabolite ratios compared with all 110 ISGs. This suggests that type I IFN may be important in IDO1 induction in SLE, leading to high metabolite ratios. Nevertheless, type II IFN is a strong inducer of the pathway in vitro and is reported by some to induce IDO1 more strongly than type I IFN.54 Since 104 of the 110 ISG-As (95%) are stimulated by both type I and II IFNs, it is difficult to infer which class of IFN is more highly associated with the elevated metabolite ratios observed in this study.
There are several potential limitations to this study. ISG expression, metabolite ratios and monocyte-associated gene expression were measured in peripheral blood rather than in CSF or brain tissue, which may be more representative of KYN/TRP pathway activation in the brain. However, KYN easily crosses the BBB2; the peripheral KYN/TRP pathway activation contributes to elevated levels of KYN, QA and KA in the CNS in animal models,55 56 and multiple studies report that peripheral KYN/TRP pathway metabolites in humans correlate with CSF levels.15 16 57 58 Additionally, both type I and II IFNs can cross the BBB.13 Type I IFN was measured indirectly with ISG, while newer technologies such as single-molecule array digital ELISA are now sensitive to IFN-α without cross-reactivity for other IFN species.59 These techniques can be applied in future studies using stored sera. RNAseq of whole-blood samples precludes the ability to accurately determine the contribution of individual cells to gene expression. While deconvolution methods, such as CIBERSORT used in this study, can estimate cell-type proportions from bulk RNAseq data and have been applied in studies involving subjects with SLE,46 47 sorting of PBMCs by flow cytometry or the use of single-cell RNAseq offer distinct advantages over deconvolution methods. Single-cell RNAseq enables measurement of the transcriptome in individual cells and may allow better characterisation of the heterogeneity of gene expression within cell types. Nevertheless, the CIBERSORTx method leverages single-cell RNAseq-derived reference profiles to perform the deconvolution60 and has been validated using sorted cells via flow cytometry, showing that cell-type fraction estimates from deconvolution correlates with sorted cell fractions.60 Our analyses led to observations regarding associations between circulating monocytes and IDO1 activation; however, activated monocytes migrate into tissue, and our analysis of whole blood in isolation may not provide a comprehensive analysis of the relationship between monocytes and IFN induction of the KYN/TRP pathway. As IDO1-expressing monocytes can potentially enter the CNS under inflammatory conditions following BBB disruption and contribute to excess KYN/TRP pathway metabolites in the brain,12 it would be particularly relevant to determine ISG expression in monocytes directly and analyse associations with the KYN/TRP pathway metabolites. Future studies using sorted cells or single-cell RNAseq can be employed to validate our results. Our ability to test associations of ISG expression and monocyte-associated gene expression with neuropsychological performance was limited by the relatively small number of subjects with both high-IFN and high monocyte-associated gene expression; however, future studies with adequate power to test these associations are planned. Finally, many medications can inhibit IDO1 activity, including antimalarials, immunosuppressants and corticosteroids,50 51 and this may have contributed to the lack of differential IDO1 expression in SLE versus HC. However, excluding subjects based on these medications would have severely limited the study’s feasibility and generalisability.
This is the first study in patients with SLE to examine relationships between ISG expression, KYN/TRP pathway activation and elevated QA:KA ratios. In peripheral blood, elevated ISG expression correlates with an elevated KYN:TRP ratio, suggesting IDO1 induction, and correlates with an elevated QA:KA ratio in subjects with SLE with high IFN scores and monocyte-associated gene expression. These results support our overarching hypothesis that IFN-stimulated IDO1 activation leads to increased production of KYN/TRP metabolites with potential impact on neurological function and cognition.26 These results need validation in a separate cohort, and a potential relationship between monocytes and IFN-mediated IDO1 induction in patients with SLE needs to be clarified. These further studies may aid in determining which subjects may benefit from therapeutics directed at the IFN or KYN/TRP pathways to ameliorate a potentially neurotoxic QA/KA imbalance in a personalised medicine approach.
Data availability statement
All data relevant to the study are included in the article or uploaded as supplementary information.
Ethics statements
Patient consent for publication
Ethics approval
This study involves human participants and was approved by Northwell Health Institutional Review Board (ID: 17-0389). The participants gave informed consent to participate in the study before taking part.
Acknowledgments
The authors express their gratitude towards the patients and healthy individuals who participated in this study, and the support of the research coordinators and nurses at the Feinstein Institutes.
References
Supplementary materials
Supplementary Data
This web only file has been produced by the BMJ Publishing Group from an electronic file supplied by the author(s) and has not been edited for content.
Footnotes
Contributors Study design: EWA, MM, CA and BD. Data collection: EWA, YJ, AS, SG, MM, CA, RAF and JR. Data analysis: EWA, YJ, AS, MM, CA, BD, BV and JR. Interpretation of findings: EWA, YJ, AA, MM, CA, BD and BV. Preparation of the manuscript: EWA, YJ, AA, MM, CA, BD, BV and JR. Guarantor: EWA. All authors read and approved the final manuscript.
Funding This work was supported by a grant from the Lupus Foundation of America (Gary S. Gilkeson Career Development Award, G-1904-00773, PI: EWA, MD, PhD; October 2019–September 2021).
Competing interests None declared.
Patient and public involvement Patients and/or the public were not involved in the design, conduct, reporting or dissemination plans of this research.
Provenance and peer review Not commissioned; externally peer reviewed.
Supplemental material This content has been supplied by the author(s). It has not been vetted by BMJ Publishing Group Limited (BMJ) and may not have been peer-reviewed. Any opinions or recommendations discussed are solely those of the author(s) and are not endorsed by BMJ. BMJ disclaims all liability and responsibility arising from any reliance placed on the content. Where the content includes any translated material, BMJ does not warrant the accuracy and reliability of the translations (including but not limited to local regulations, clinical guidelines, terminology, drug names and drug dosages), and is not responsible for any error and/or omissions arising from translation and adaptation or otherwise.