Article Text

Abstract
Objectives The interferon (IFN) signature (IS) in patients with systemic lupus erythematosus (SLE) includes over 100 genes induced by type I IFN pathway activation. We developed a method to quantify the IS using three genes—the IS metric (ISM)—and characterised the clinical characteristics of patients with SLE with different ISM status from multiple clinical trials.
Methods Blood microarray expression data from a training cohort of patients with SLE confirmed the presence of the IS and identified surrogate genes. We assayed these genes in a quantitative PCR (qPCR) assay, yielding an ISM from the IS. The association of ISM status with clinical disease characteristics was assessed in patients with extrarenal lupus and lupus nephritis from four clinical trials.
Results Three genes, HERC5, EPSTI and CMPK2, correlated well with the IS (p>0.96), and composed the ISM qPCR assay. Using the 95th centile for healthy control data, patients with SLE from different studies were classified into two ISM subsets—ISM-Low and ISM-High—that are longitudinally stable over 36 weeks. Significant associations were identified between ISM-High status and higher titres of anti-dsDNA antibodies, presence of anti extractable nuclear antigen autoantibodies, elevated serum B cell activating factor of the tumour necrosis factor family (BAFF) levels, and hypocomplementaemia. However, measures of overall clinical disease activity were similar for ISM-High and ISM-Low groups.
Conclusions The ISM is an IS biomarker that divides patients with SLE into two subpopulations—ISM-High and ISM-Low—with differing serological manifestations. The ISM does not distinguish between high and low disease activity, but may have utility in identifying patients more likely to respond to treatment(s) targeting IFN-α.
Clinicaltrials.gov registration number NCT00962832.
- Interferon
- serological manifestations
- SLE
This is an Open Access article distributed in accordance with the Creative Commons Attribution Non Commercial (CC BY-NC 4.0) license, which permits others to distribute, remix, adapt, build upon this work non-commercially, and license their derivative works on different terms, provided the original work is properly cited and the use is non-commercial. See: http://creativecommons.org/licenses/by-nc/4.0/
Statistics from Altmetric.com
Key messages
A three-gene surrogate (interferon signature metric, ISM) for the interferon signature in patients with systemic lupus erythematosus (SLE) has a distinct bimodal profile that is similar across different interventional clinical SLE studies.
The ISM profile distinguishes patients with SLE on serological characteristics but not on clinical phenotype.
Patients with an ISM-High status have elevated anti-dsDNA and ENA autoantibodies, hypocomplementaemia, and elevated serum BAFF levels.
Introduction
Systemic lupus erythematosus (SLE) is a chronic autoimmune disease of unknown aetiology. It is characterised by the presence of pathogenic autoantibodies to nuclear antigens, elevated immune complexes (ICs), and immunological abnormalities, including lymphopenia, elevated immunoglobulin and autoantibody levels, complement activation, and abnormal activation of the innate and adaptive immune system, and often leads to multisystem organ damage.1–3
Development of novel therapies to manage SLE has been hampered by several challenges, including poorly understood pathogenesis, the heterogeneity of disease activity across and within patient populations, and difficulties conducting interventional studies.4 ,5 One approach for development of successful therapies may follow from efforts to identify useful biomarkers that can classify patients with SLE into more homogenous subsets for use in clinical trials and clinical practice.
Activation of the type I interferon (IFN) pathway has been implicated in the initiation of SLE and perpetuation of the resultant clinical disease.6 Elevated levels of IFN-α are associated with disease activity, flares and tissue injury, especially of the skin, kidney and nervous system.7 ,8 Genetic association studies show polymorphisms in SLE associated with kinase cascade signalling genes for type I IFNs and in IFN-regulated genes (IRGs).9 ,10 Further, gene expression profiling studies have identified an IFN signature (IS), or a prominent upregulation of mRNA transcripts encoded by IRGs, in a subset of patients with SLE and other autoimmune diseases.10–12 It has been hypothesised that dysregulation of the type I IFN signalling pathway could override immune tolerance mechanisms, leading to formation of autoreactive antibodies.13 Therefore, blockade of the type I IFN pathway, especially of IFN-α, may be a strategy for selective immunosuppression in patients with SLE with elevated IS expression whose pathophysiology of disease is driven by IFN dysregulation.14
We previously described an application of a quantitative reverse transcription PCR (qPCR biomarker assay to accurately measure the IFN signature in patients with SLE using a three-gene surrogate called the IS metric (ISM).15 Here, we describe the development of the ISM assay, its validation in multiple SLE clinical trial cohorts, and characterise the clinical and serological features associated with the ISM-Low and ISM-High subsets of patients with SLE.
Patients and methods
Cohorts of patients with SLE
All patients met the American College of Rheumatology criteria for SLE. This trial is registered (NCT00962832) on the ClinicalTrials.gov website. For purposes of executing clinical trials with different end points, patients with SLE are characterised predominantly as patients with extrarenal lupus (ERL) or as patients with lupus nephritis (LN). The following cohorts were evaluated: 61 patients with ERL in the University of Michigan observational cohort, 60 patients with mild ERL enrolled in the rontalizumab Phase I trial,16 135 patients with moderate-severe ERL in the EXPLORER rituximab trial,17 80 patients with moderate-severe LN in the LUNAR rituximab trial18 and 238 patients with moderate-severe ERL in the ROSE rontalizumab (anti-IFN-α monoclonal antibody) trial.19 Further descriptions are in the online supplementary methods. Healthy control subjects (n=85) were recruited by the Genentech blood donation programme for research use of blood samples, and were age matched and gender matched to the lupus trial patients.
Blood RNA extraction and microarray analysis
Detailed methodology is presented in the online supplementary methods. RNA from SLE cohorts was isolated from peripheral blood mononuclear cells (PBMCs) and/or PAXgene whole blood samples. Genome-wide expression data were obtained using Affymetrix Human Genome U133 Plus V.2.0 expression microarrays, and data analysis was performed using Bioconductor R packages.20 Microarray ISM scores were derived from the scaled geometric mean across included genes for each sample subjected to exponentiation by 2. Microarray data have been submitted to the gene expression omnibus (GEO) repository under the accession number GSE50772.
Development of the ISM PCR assay
The qPCR assays were developed with primers and fluorescent dye-labelled probes for IRGs and housekeeping genes and run on the Agilent Mx2500P and the Applied Biosystems 7900HT platforms. The three-gene ISM score was calculated using expression values from the gene complementary DNAs (cDNAs) CMPK2, EPSTI1, HERC5, and normalised using the housekeeping gene TFRC. The ISM score was calculated from the mean of the CMPK2, EPSTI1 and HERC5 cycle threshold (Ct)—TFRC Ct (ΔCt) values and multiplied by −1 to give the correct directionality of relative log2-scaled expression. Baseline ROSE trial samples were assessed using this assay developed on the Cobas 4800 platform (Roche Molecular Systems) as a prototype diagnostic test.
Measurement of serum analytes
Levels of serum creatine were determined with Roche Modular Analysers using a modified Jaffe reaction. Levels of complement C3 and C4 components were determined using standard immunonephelometry methods. Anti-dsDNA, anti-SSA/Ro, anti-SSB/La, anti-ribonucleoprotein (RNP) and anti-Sm were measured using a bead-based immunoassay (AtheNA Multi-Lyte antinuclear antibodies Test System). Serum concentrations of B cell-activating factor of the tumour necrosis factor family (BAFF) were determined by an ELISA using monoclonal antibodies developed at Genentech, with a standard curve using recombinant human BAFF. Serum bioactivity was determined using U-937 cells stably transfected with the pGL4.14 vector containing a 1.5 kb fragment of the myxovirus influenza resistance 1 promoter,21 where samples were added to reporter cells for 24 h alongside a standard curve of recombinant IFN-α for quantification. Luciferase levels were measured by Luminometer instrumentation.
Statistical analysis
Demographics and key baseline patient characteristics were compared using descriptive statistics, that is, differences between ISM-Low and ISM-High patients in mean values. Statistical testing was performed using the Wilcoxon rank-sum test or the Fisher's exact test as appropriate. No adjustments for multiple comparisons were performed for individual statistical tests. The longitudinal stability of the ISM was evaluated in patients who received placebo, and data were used to establish the probability of reproducibility (Prep) of ISM-Low or ISM-High categorisation (range 0–100%) when samples were measured from the same patient at baseline, Week 2 on treatment and monthly visits through Week 36. Prep was derived as the average proportion of times that the ISM status observed at baseline was maintained across all available time points. The effect of rontalizumab treatment on the ISM was evaluated with a longitudinal mixed-effects linear model with an autoregressive covariance matrix. The model included the fixed effects of treatment, visit, baseline ISM score and baseline ISM score-by-treatment interaction. Multivariate model selection for determining covariates associated with the ISM score at baseline was performed using stepwise selection with PROC GLMSELECT in Statistical Analysis System (SAS) V.9.2 (SAS Institute, Cary, North Carolina, USA).
Results
Derivation of the ISM biomarker
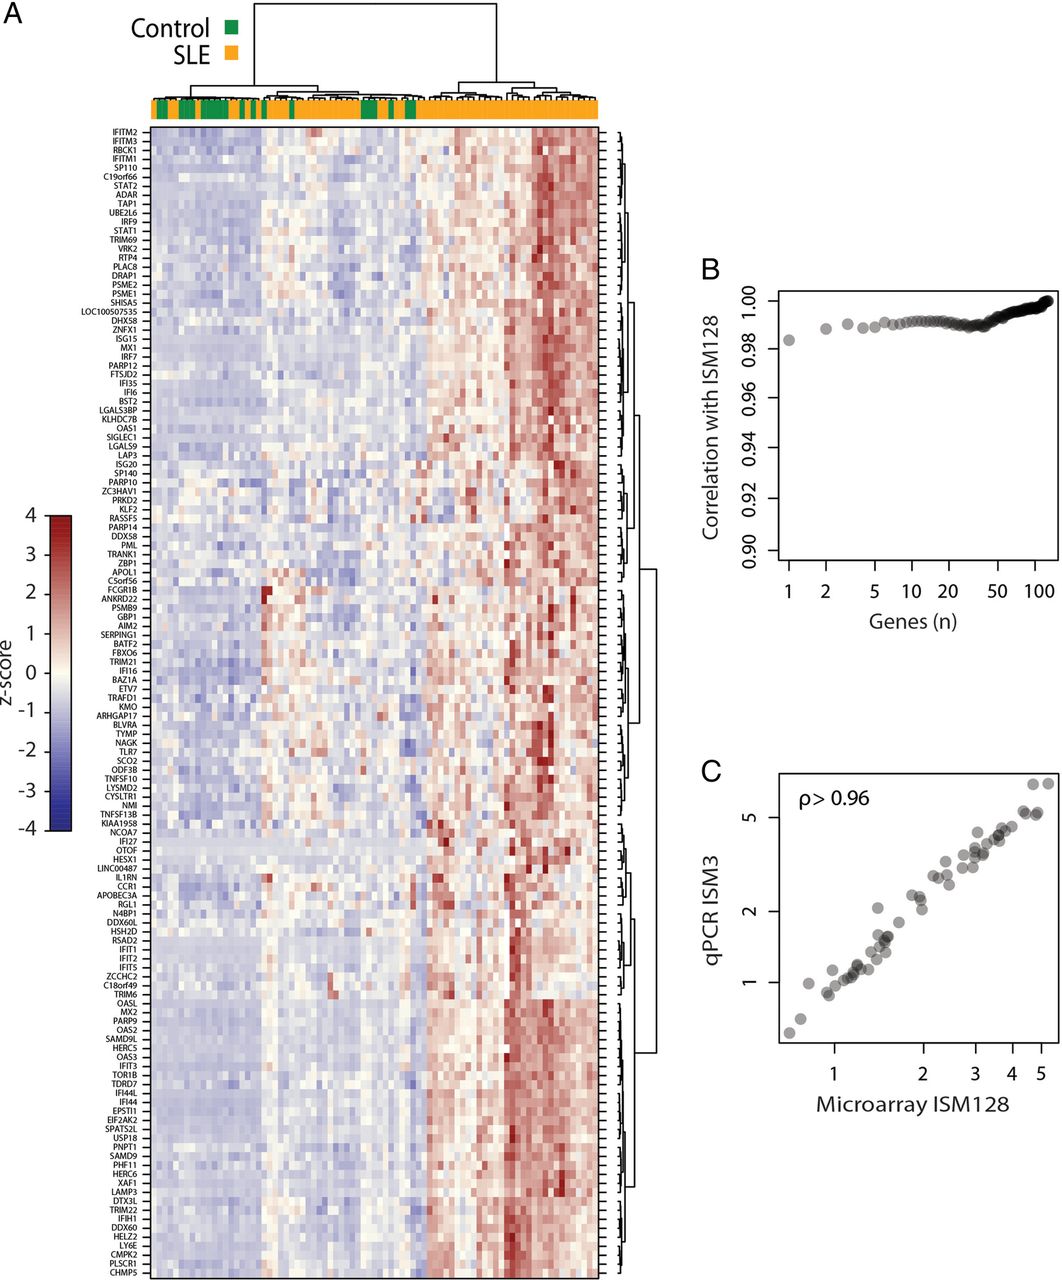
Using unsupervised hierarchical clustering of samples and probe sets derived from expression microarray analysis of PBMCs in the University of Michigan SLE cohort, we observed that patients with SLE (n=61) and control patients (n=20) had distinct gene expression at the genome-wide level (see online supplementary figure S1). A cluster of 128 genes had high representation of IRGs, relating to the previously described IS, which was elevated in ∼50% of patients with SLE (figure 1A and see online supplementary table S4). Composites of only a few genes could yield scores that were highly correlated to the score calculated from the 128-gene cluster (figure 1B). Quantitative PCR of whole blood RNA samples obtained from the same patients in this training cohort for a three-gene combination (HERC5, EPSTI1 and TYKI/CMPK2) was a robust surrogate for the original 128-gene IS observed in the matching PBMC RNA samples (figure 1C)—defined hereafter as the ISM. Therefore, the magnitude of the microarray IS that was originally identified by microarray analysis of PBMC RNA samples could be measured accurately using a three-gene qPCR assay of corresponding whole blood RNA samples.

Derivation of the blood interferon signature (IS) using a small subset of interferon-regulated genes (IRGs). (A) Visualisation of the 128 IRG cluster after unsupervised hierarchical clustering of genome-wide microarray expression data derived from peripheral blood mononuclear cell (PBMC) samples in either the University of Michigan systemic lupus erythematosus (SLE) cohort or healthy controls. SLE or control samples are indicated by the top colour bar. The heat map colour scale reflects z-score values of gene expression levels (colour bar on left). (B) Spearman's correlations between the whole 128-gene interferon signature metric (ISM) and ISMs calculated from subsets of these 128 genes of sizes ranging from 1 to 128, showing that small numbers of genes yield ISMs very similar to the 128-gene ISM. The genes that compose a subset of size n were selected by first calculating each of the 128 genes’ correlation with the 128-gene ISM, and then picking the genes defining n with the highest correlations to the whole 128-gene ISM. (C) ISM from the microarray expression data of 128 interferon signature genes correlates highly with the qPCR ISM generated from whole blood RNA samples using three selected genes. ρ is from Spearman's correlation.
ISM profile in healthy controls and different lupus populations
The ISM scores were generated from whole blood RNA samples from a cohort of 85 additional healthy control subjects and pretreatment samples from patients enrolled in the Phase I trial of rontalizumab (anti-IFN-α) in mild SLE, the EXPLORER trial of rituximab (anti-CD20) in moderate-severe ERL and from the LUNAR trial of rituximab in moderate-severe LN (see Methods). Consistent with the Michigan SLE cohort data, a subset of patients with ERL and LN had significantly elevated ISM scores while other patients had ISM scores that overlapped those of healthy control subjects (figure 2A). The lupus populations exhibited a strong bimodal ISM separation, indicating two distinct patient subsets. A threshold for the ISM score at the 95th centile of the healthy subject ISM scores was calculated to be at an ISM score of 1, separating patients with lupus into ISM-Low and ISM-High subsets. Compared with the ISM-Low subjects, whose median ISM score of −0.8 overlapped with the control population, the ISM-High subset had a median ISM score ≥2.3, corresponding to >eightfold higher expression of the ISM genes (figure 2B) in ISM-High versus ISM-Low subsets. The bimodal distribution and elevation of ISM was consistent in patients from the ROSE Phase II trial (figure 2C), with the median for ISM-High patients indicating >sevenfold higher IS expression than in ISM-Low patients (figure 2D).
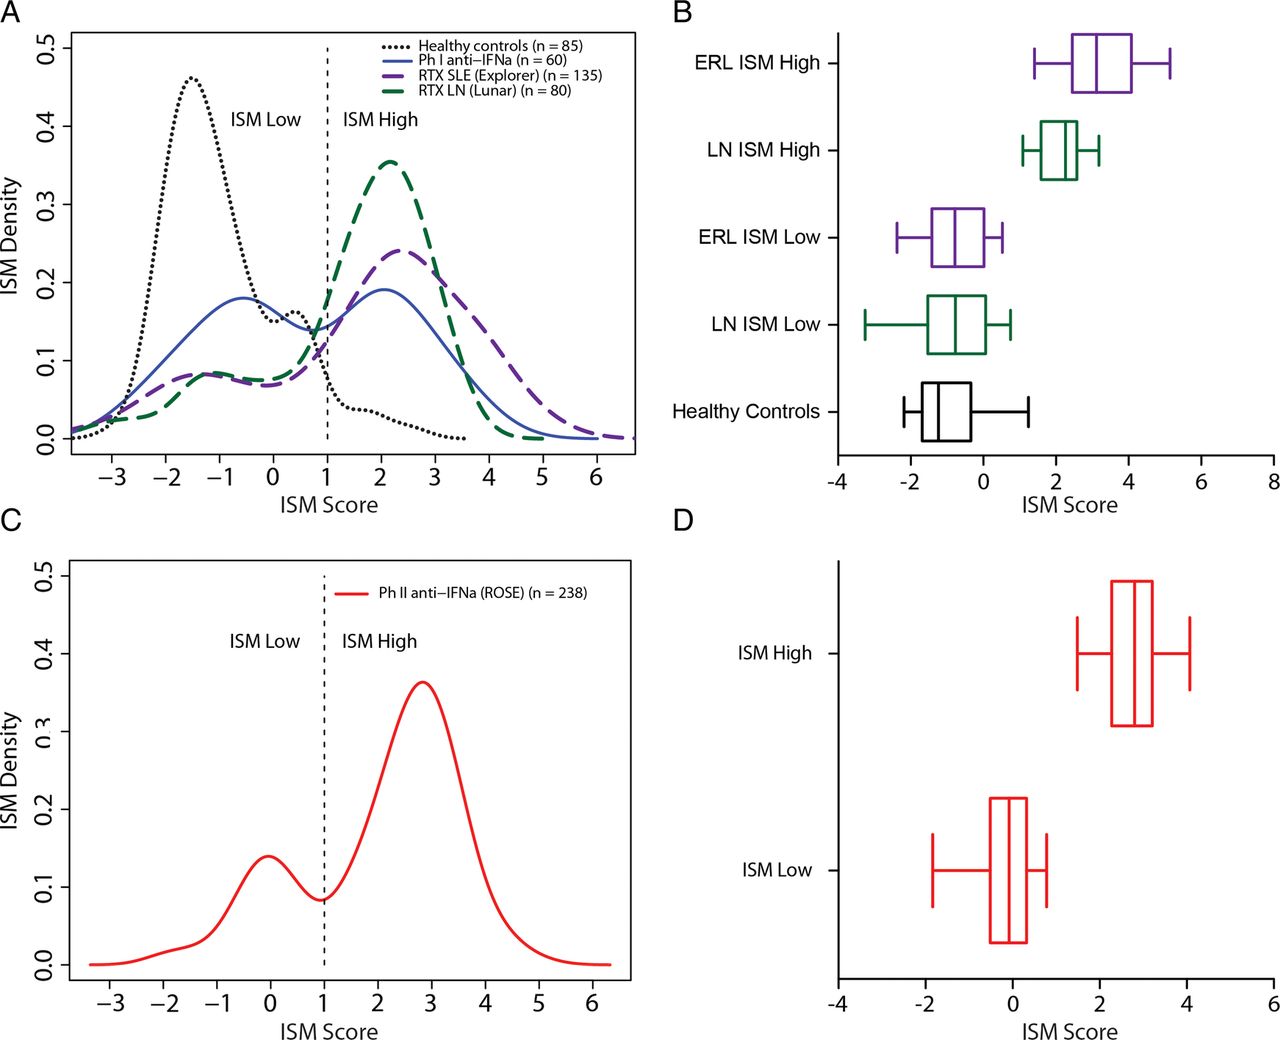
Comparison of the interferon (IFN) signature metric (ISM) magnitude and distribution in healthy controls versus patients with systemic lupus erythematosus (SLE). (A) Distribution of pretreatment ISM values in the previously described healthy control cohort versus bimodal ISM distributions in a cohort of patients with mild-SLE (rontalizumab Phase I trial), the rituximab EXPLORER SLE trial and the rituximab LUNAR lupus nephritis (LN) trial. The dashed line indicates cut-off used for ISM-Low versus ISM-High patients and incidences of ISM values across the patient cohorts are plotted as densities. (B) Median, IQRs, and 5th and 95th centile values for the pretreatment ISM in a healthy control cohort (n=85), and in ISM-Low versus ISM-High patient subsets in a moderate-to-severe extrarenal lupus (ERL) cohort (rituximab EXPLORER trial, n=131) and a moderate-to-severe LN cohort (rituximab LUNAR trial, n=80). (C) Bimodal ISM distribution observed in the moderate-to-severe SLE cohort (ROSE rontalizumab Phase II trial, n=238) with cut-off value indicated with dashed line. (D) Median, IQRs, and 5th and 95th centile values for the pretreatment ISM in the ROSE trial (n=238).
Baseline demographics by ISM across four SLE populations
In a mild ERL population enrolled in a Phase I study,16 the ratio of ISM-Low to ISM-High patients was approximately 1:1. In contrast, in a moderate-to-severe ERL population (EXPLORER) and an LN population (LUNAR), 70–75% of patients were ISM-High (table 1) at baseline. Furthermore, 76% of patients in the ROSE moderate-to-severe SLE trial were designated ISM-High. Gender did not differ between ISM-Low and ISM-High patients in any of the cohorts. However, in the Phase I EXPLORER and LUNAR trials, the ISM-Low patients tended to be older than the ISM-High patients—a trend that was also seen in the ROSE trial—with a 5-year mean difference between the groups. While there was a trend for increased representation of the African-American ethnicity in ISM-Low versus ISM-High subsets of the ERL cohorts, the prevalence of such patients in the studies was low and the trend was not observed in the LUNAR trial.
Demographics and clinical baseline characteristics by ISM status of patients in four lupus studies
Clinical disease activity by ISM across four lupus cohorts
Within each SLE trial, global disease activity did not differ between ISM-Low and ISM-High patient subsets as defined by the British Isles Lupus Assessment Group (BILAG) activity index, Safety of Estrogen in Lupus Erythematosus-National Assessment (SELENA)—Systemic Lupus Erythematosus Disease Activity Index (SLEDAI) score, or Physician Global Assessment (table 1). Within the context of enrolment criteria based on SELENA-SLEDAI or BILAG measures and/or renal impairment, disease activity at baseline did not differ between ISM-Low and ISM-High patients with SLE. Furthermore, mucocutaneous involvement did not differ between the two ISM subsets across the four studies. There was a consistent trend for increased musculoskeletal involvement in the ISM-Low versus ISM-High patients, but this was not statistically significant.
In addition, data was collected in the ROSE trial for Cutaneous Lupus Erythematosus Disease Area and Severity Index (CLASI) as well as for the Functional Assessment of Chronic Illness Therapy (FACIT) measurement system of fatigue. Of note, we observed a significant association between ISM-High status and the CLASI damage score; ISM-High (n=180) mean 2.1, SD 5.7, versus ISM-Low (n=58) mean 0.3, SD 1.0, Wilcoxon p=0.0209. However, we did not see a significant association between ISM status and the CLASI activity score; ISM-High mean 5.8 (SD 6.5) versus ISM-Low mean 7.0 (SD 8.0), p=0.32. Further, there was a trend observed for elevated FACIT fatigue scores in ISM-High patients; ISM-High mean 27.5 (SD 1.43) versus ISM-Low mean 24.3 (SD 13.7), p=0.074.
Increased serological manifestations in ISM-High patients with lupus
In the ERL trials, the ISM-High subset had decreased levels of C3 and C4 complement components relative to the ISM-Low subset, and these differences were consistent in the ROSE trial (table 2). In contrast, C3 and C4 levels did not differ in the ISM subpopulations in the LUNAR LN trial. ISM-High status was associated with elevation of anti-dsDNA titres (figure 3A) and increased incidence of positive extractable nuclear antigen antibody status (figure 3B) as compared with ISM-Low patients with ERL. Levels of these autoantibodies did not significantly differ between ISM-High and ISM-Low patients with LN. Serum BAFF levels were elevated in the ISM-High versus ISM-Low subsets in patients with ERL and LN (figure 3C, table 2). In patients with ERL, type I IFN serum bioactivity was also elevated in the ISM-High patients relative to ISM-Low patients (figure 3D); this was not assessed in patients with LN. We further assessed C reactive protein (CRP) levels between ISM-High and ISM-Low patients, and noted that while CRP levels were elevated in ISM-High patients in the ROSE trial; ISM-High mean 0.81 mg/dL (SD 1.43) versus ISM-Low 0.42 mg/dL (SD 0.6), p=0.019, there were no significant elevations in CRP levels between ISM-High patients versus ISM-Low patients across the other trials (table 1). It was further noteworthy that across the four trials, total leucocyte counts and lymphocyte, neutrophil, monocyte and eosinophil counts were consistently lower in ISM-High patients (see online supplementary table S2).
Baseline serological characteristics versus ISM status for patients from the Rontalizumab Phase I, rituximab EXPLORER, rituximab LUNAR and rontalizumab Phase II ROSE studies
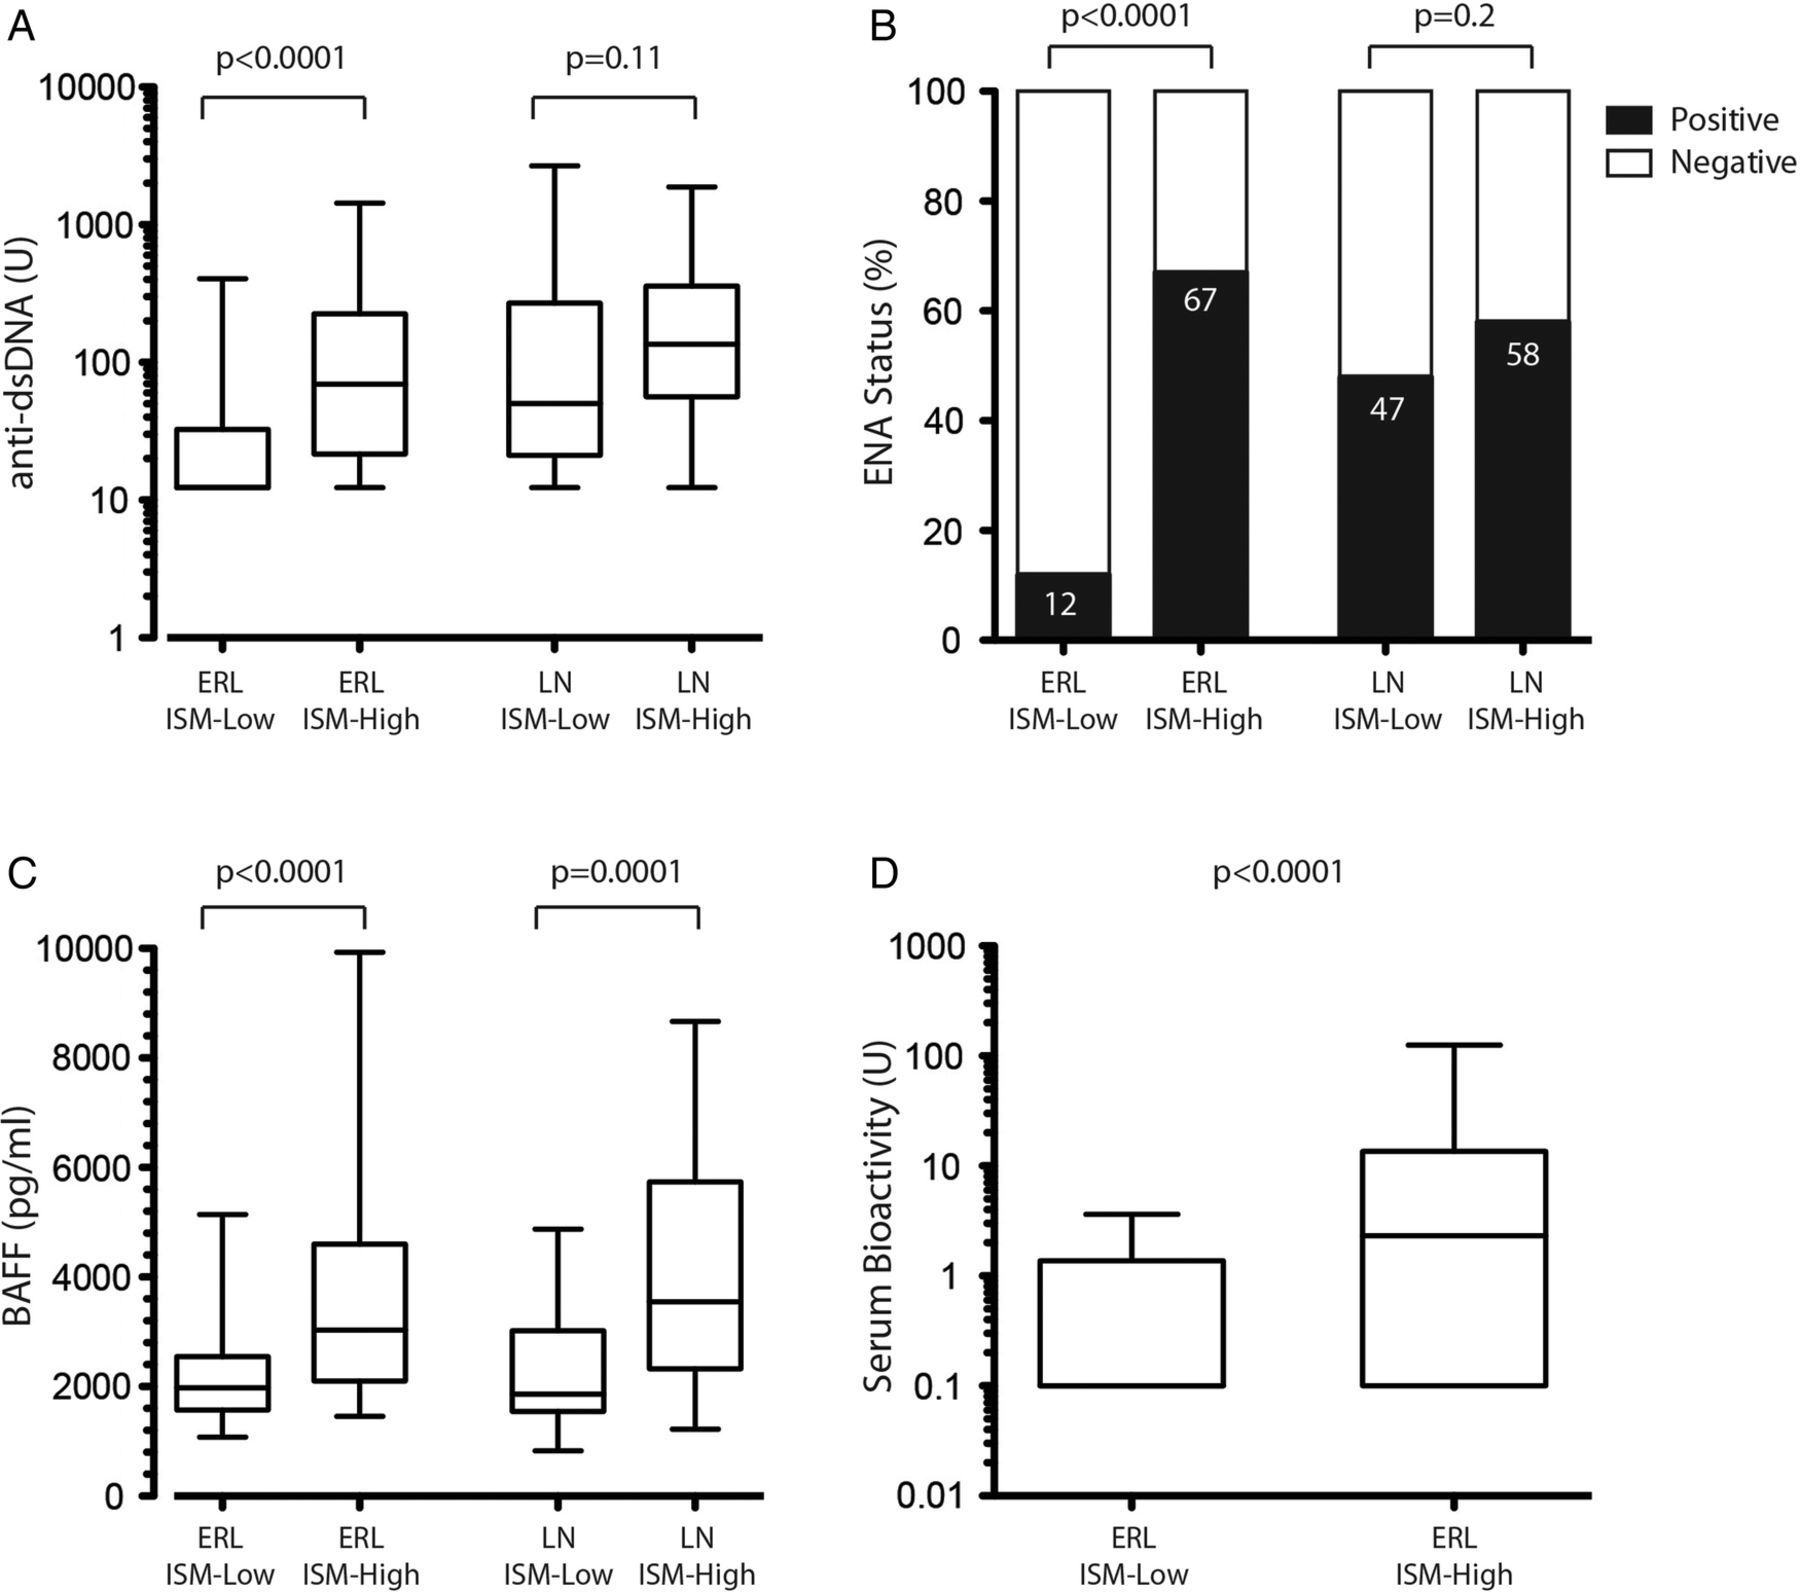
Association of pretreatment interferon (IFN) signature metric (ISM) status with serum autoantibodies, BAFF levels and type I IFN bioactivity. Patients with extrarenal lupus (ERL) from the rontalizumab Phase I and Phase IIa ROSE trials and from the rituximab EXPLORER trial were pooled and stratified by ISM-Low (n=118) or High (n=307) status. Patients with renal lupus from the rituximab LUNAR trial were also examined (ISM-Low n=21; ISM-High n=59). (A) Levels of anti-dsDNA antibodies plotted as median, IQRs, and 5th and 95th centiles. Statistical significance was determined using the Wilcoxon test. (B) Presence or absence of extractable nuclear antigen (ENA) antibodies plotted as percentages of the patient subgroups. Statistical significance was determined using Fisher's exact test. (C) Levels of serum BAFF plotted as median, IQRs, and 5th and 95th centiles. Statistical significance was determined using the Wilcoxon test. (D) Levels of serum myxovirus influenza resistance 1 (MX1)-induced bioactivity in ROSE patients with ERL are plotted as median, IQRs, and 5th and 95th centiles. Statistical significance was determined using the Wilcoxon test.
Multivariate analysis of the ISM score
Absolute counts of CD4, anti extractable nuclear antigen status, levels of BAFF and anti-dsDNA, and SLE disease duration were independently associated with the ISM score (see online supplementary table S3). Longer disease duration was the only non-serological component of the model associated with lower ISM scores. A statistically non-significant trend for an association between the ISM score and age at baseline was noted.
Determination of longitudinal stability of the ISM
Patients receiving placebo (n=61) had a 94% probability of being consistently categorised in the same ISM subset throughout the 36-week period (see online supplementary table S4). Patients with an ISM score closer to the cut-off of 1 (>−0.5 to ≤2, n=17) had a lower likelihood (81% to 85%) of maintaining their ISM status, while patients with ISM scores further from the cut-off (≤−0.5 or >2, n=44) had a higher (97% to 100%) likelihood of maintaining their status over the same period of time.
Decrease in ISM score after dosing of patients with SLE with rontalizumab (anti-IFN-α)
Treatment with rontalizumab decreased the ISM score relative to placebo during the 24-week treatment period based upon a longitudinal model incorporating all of the time points that demonstrated an intercept that was statistically significantly lower for the rontalizumab groups versus the placebo groups (p<0.01), reflecting a pharmacodynamic response for IFN-α blockade. Application of a mixed-effect model also supported an interaction between baseline ISM score and treatment group (p<0.01), where differences between active treatment and placebo were greater for patients with lower versus higher baseline ISM scores. Despite this pharmacodynamic response, treatment of ISM-High patients with rontalizumab did not decrease the ISM-High scores down to the levels observed in ISM-Low patients (figure 4).

Decreased interferon (IFN) signature metric (ISM) magnitude after dosing patients with systemic lupus erythematosus (SLE) with rontalizumab (anti-IFN-α). Patients with SLE enrolled in the ROSE trial were dosed over 24 weeks with rontalizumab or placebo (see Methods) and ISM values were determined from pretreatment and post-treatment blood RNA samples collected at monthly frequencies. Blood ISM scores were calculated for pretreatment and post-treatment time points and plotted versus time as mean±SEM for the ISM-High (n=55 for placebo and 120 for rontalizumab) and ISM-Low (n=24 for placebo and 33 for rontalizumab) patient groups as determined at baseline. The ISM scale (y axis) is split between 0 and 2 for clarity, and data from the intravenous (750 mg every 4 weeks) and subcutaneous (300 mg every 2 weeks) dose arms for rontalizumab versus the corresponding placebo arms were pooled for this analysis. Assessment of statistical differences between placebo and rontalizumab groups was based upon a longitudinal model assessing all time points.
Discussion
In this study, we confirmed the presence of an IFN-inducible gene expression signature (IS) in the peripheral blood of patients with SLE and developed a novel and simplified qPCR-based biomarker (ISM) test to quantitate the IS. Importantly, we showed that the magnitude of the ISM biomarker was highly similar between PBMCs and whole blood RNA samples obtained from the same subjects. At baseline, patients with SLE from four different clinical trials consistently fall into one of two subsets—ISM-High and ISM-Low and the bimodal distribution of patients with SLE by the ISM agrees with previous reports.1 ,10
The bimodal distribution expression of the IRG in ISM-Low and ISM-High patients with SLE is a distinct feature of this biomarker. High-ISM patients with SLE had markedly elevated IRG expression, while patients in the ISM-Low subset had a distribution of gene expression that overlapped with the predominantly unimodal ISM measured in healthy subjects, despite the presence of active disease. The relative distribution of patients who are ISM-High or ISM-Low varied, in part, with disease activity based on BILAG or SELENA-SLEDAI measures, but this appears to be a consequence of the trial inclusion criteria. Thus, ISM status across SLE trial populations varied from an incidence of ∼50% ISM-High scores in a mild disease population in a Phase I study16 to ∼75% in moderate-to-severe SLE disease populations in Phase II/III studies that represent patients with ERL and LN.
Despite an apparently increased incidence of ISM-High patients in Phase II/III trials in populations with moderate-to-severe disease activity compared with Phase I studies in populations with mild disease activity, the ISM status within each trial's cohorts did not correlate with differences in disease activity. Our observations are based on the consistent use of a platform—the qPCR-based ISM—across different trial populations, in contrast to reports of IS associations with increased SLE disease activity based on differing methods applied across different cohorts to measure the IS.1 ,10 ,14 For example, in the Phase II ROSE study with patients with moderate-to-severe SLE, ISM status did not correlate with differences in mean measures of disease activity assessed by BILAG or SELENA-SLEDAI.19 Further, the skewed incidence of ISM-High patients in moderate-to-severe disease was fairly similar in the ERL and LN populations, indicating that the ISM distribution is not broadly specific with end-organ activity in most patients with SLE. In the EXPLORER17 and ROSE19 studies, we did not observe consistent correlations between mucocutaneous disease manifestations and ISM status, and we observed only a modest trend in elevated musculoskeletal disease manifestations in ISM-Low compared with ISM-High patients across the four trials. Of note, we did observe increased CLASI damage scores, but not CLASI activity scores, in the ROSE trial where this instrument was used that suggests the possibility of an association of the ISM biomarker with aspects of cutaneous disease. We also observed a trend for elevated FACIT fatigue scores in ISM-High patients in the ROSE trial. The possibility still remains, however, that there are distinct clinical SLE pathotypes within the ISM subsets that have not yet been identified. We did observe that the ISM-High subset was slightly younger overall across the trials and, in at least the ERL populations, had a lower frequency of white patients, consistent with previous observations.10
ISM status does correlate with serological differences between the two subpopulations across multiple trial cohorts with extrarenal SLE. The presence of characteristic SLE autoantibodies, hypocomplementaemia, cytokine production and serum IFN bioactivity varied between ISM-High and ISM-Low patients with lupus. These findings are consistent with previous reports1 ,10 ,16 and underscore the role of type I IFNs in systemic immune activation, including extrafollicular differentiation of autoreactive B cells to antibody-secreting plasmablasts via regulation of toll-like receptors (TLRs) and increased survival via BAFF-induced signalling.6 Thus, the ISM could be a biomarker of systemic immune activation that comanifests with serological abnormalities. Indeed, our multivariate analysis confirmed independent association of ISM magnitude with T cell counts, autoantibodies, cytokine levels and disease duration parameters.
We found no significant differences between the ISM-Low and ISM-High subpopulations in autoantibody presence or titre in patients with LN, and observed comparable levels of hypocomplementaemia in these subpopulations. So, although immune-serology differences exist between ISM-High and ISM-Low patients with ERL, additional drivers of the IS likely exist in patients with LN, giving rise to a bimodal ISM distribution. This suggests that the regulation of the IRGs could be due in part to an amplification loop where, upon reaching a threshold, genes could be upregulated by additional upstream signals. These signals may include, but are not limited to, nucleic acid-containing IC activation of endosomal TLR7 and TLR9 nucleic acid sensors22 ,23 or activation of cytosolic nucleic acid sensors such as the retinoic acid-inducible gene I-like receptors, nucleotide oligomerisation domain-like receptors, and cyclic GMP-AMP synthase, which lead to type I IFN expression.6 ,24 ,25
Although our analysis was not designed to address the stability of the ISM on a particular background of immunosuppressants, it appears that the most frequently used immunosuppressants (ie, hydroxychloroquine and oral corticosteroids) in lupus management do not significantly impact the ISM status of patients with SLE. In contrast, others have shown that high-dose, pulse intravenous corticosteroids markedly and transiently attenuate the IS in patients with SLE.13 ,26 Further, blockade of IFN-α with rontalizumab in patients with ERL19 only leads to a partial reduction in ISM score by 2–4 weeks of treatment. This is consistent with observations in patients with SLE treated with a different anti-IFN-α antibody, sifalimumab.27
One potential contributing factor to this partial ISM decrease could include suboptimal dosing of patients with anti-IFN-α antibodies, and treatment of patients with higher amounts of this therapy could result in a greater magnitude of decrease of the ISM score. It is also important to consider the complexity of the genome-wide gene expression profile, and the potential limitations of our approach to derive a simplified biomarker that integrates the magnitude of a large number of genes. Indeed, a recent study using modular transcriptional analysis has demonstrated that different a priori-defined IFN-inducible modules have differential associations with disease activity such as SELENA-SLEDAI scores, serology and presence of flare.28 Further, the different IFN-inducible modules had varying degrees of longitudinal stability, and likely reflected differential contributions of IFN-β and IFN-γ in addition to IFN-α. Clearly, therefore, the IS in patients with SLE is driven by factors beyond IFN-α signalling and may include overlapping Jak-Stat signalling mechanisms used by other cytokines29 and/or sustained IC derived from pre-existing plasma cells. In this regard, it has recently been reported that blockade of the Lymphotoxin/LIGHT pathway using baminercept, a lymphotoxin-β receptor-immunoglobulin fusion protein, reduced the IFN signature in the blood of patients with rheumatoid arthritis with elevated baseline signatures30 suggesting a role of the Lymphotoxin/LIGHT pathway as an upstream modulator of IFNs in RA and potentially SLE. Furthermore in this study, patients with RA and SLE had lymphopenia associated with elevation of blood IFN signature, and treatment of patients with RA with baminercept subsequently increased lymphocyte counts. Consistent with this observation, it was noteworthy that the ISM-High patients within the trials examined in this study also had reduced circulating leucocyte counts including lymphocytes, monocytes, neutrophils and eosinophils as compared with ISM-Low patients. These data are consistent with a role for IFN signalling in retaining immune cells in tissues during inflammatory disease and therefore contributing to lymphopenia. Additional mechanistic studies are warranted to investigate upstream signals that can specifically induce genes also induced by type I IFNs.
In conclusion, we have characterised the ISM as a surrogate of the peripheral blood global IS, first identified in patients with SLE.10–12 The method identifies distinct ISM-Low and ISM-High SLE populations, and has the potential to provide a useful approach to identify and stratify the heterogeneous SLE population in the context of randomised control clinical trials and clinical practice. The correlation of baseline ISM status and clinical response has recently been evaluated in the ROSE Phase II randomised, controlled trial of the safety and efficacy of rontalizumab in extrarenal lupus.19
Acknowledgments
The authors thank Rachel Brock and Sushma Yarlagadda for assistance in processing patient samples from the Michigan SLE cohort, Lauren Nguyen and Zachary Martinez for immunoassay analysis of patient serum samples, and Dr Jane Grogan for scientific discussion of the data. Writing assistance was provided by Genentech.
References
Supplementary materials
Supplementary Data
This web only file has been produced by the BMJ Publishing Group from an electronic file supplied by the author(s) and has not been edited for content.
Files in this Data Supplement:
- Data supplement 1 - Online supplement
Footnotes
Contributors All authors made substantial contributions to the conception or design of the work; or the acquisition, analysis or interpretation of data for the work; and drafting the work or revising it critically for important intellectual content; and final approval of the version to be published; and agree to be accountable for all aspects of the work in ensuring that questions related to the accuracy or integrity of any part of the work are appropriately investigated and resolved.
Funding This study was financially supported by Genentech, a member of the Roche Group.
Competing interests WPK, RM, KW, WT, ARA, CC, AM, JMM, PB, JCD., TWB, and MJT: Employees and shareholders of Roche. BCR: Research support from Genentech. All of the authors with the exception of BCR are current or former employees of Genentech, a member of the Roche group.
Ethics approval The study was approved by the relevant Institutional Review Boards/Independent Ethics Committees and conducted in accordance with the ethical principles of the Declaration of Helsinki.
Patient consent Obtained.
Provenance and peer review Not commissioned; externally peer reviewed.
Data sharing statement Microarray data have been submitted to the GEO repository and has the accession number GSE50772.