Article Text

Abstract
Objective To evaluate response duration and identify predictors of transitioning into and out of the response state in patients with SLE receiving standard of care (SoC) in 52-week clinical trials.
Methods A multistate model (MSM) allowing for bidirectional transitions between response and non-response states was fit to data on 759 patients with SLE with active disease randomised to SoC. The probability of being in response at 52 weeks, average duration of response (sojourn time) and mean total time in response for SLE Responder Index (SRI-4, SRI-5, SRI-6) and BILAG-based Composite Lupus Assessment (BICLA) were estimated. Predictors of attainment and loss of SRI-5 response were also assessed.
Results The MSM estimated probability of being in response at 52 weeks ranged from 42% (SRI-6) to 61% (SRI-4). Mean duration of response ranged from 20.4 weeks (BICLA) to 31.5 weeks (SRI-4). Mean total time in response was 16.4–24.8 weeks. Baseline characteristics predictive of shorter SRI-5 response duration were African descent (p=0.005), longer history of disease (p=0.03), higher anti-dsDNA antibody titres (p=0.039), lower lymphocyte count (p=0.008) and lower haemoglobin (p=0.006). Younger age (p<0.001) and higher protein/creatinine ratio (p<0.001) were associated with higher likelihood of achieving SRI-5 but also shorter response duration.
Conclusion Factors associated with disease severity were more predictive of shorter response duration than of 52-week response status. Analysing landmark response rates and response duration using MSM may be a more powerful way to distinguish effective investigational treatments from background SoC, although this remains to be evaluated in future trials.
- systemic lupus erythematosus
- disease activity
- treatment
This is an open access article distributed in accordance with the Creative Commons Attribution Non Commercial (CC BY-NC 4.0) license, which permits others to distribute, remix, adapt, build upon this work non-commercially, and license their derivative works on different terms, provided the original work is properly cited, appropriate credit is given, any changes made indicated, and the use is non-commercial. See: http://creativecommons.org/licenses/by-nc/4.0/
Statistics from Altmetric.com
Introduction
The primary endpoint in SLE trials is usually response to therapy at a landmark visit, for example, 52 weeks. A limitation with this outcome is that lupus symptoms and a patient’s response status can fluctuate over time so that analysing data from a single visit to evaluate the effect of a treatment or other clinical factor may lead to misleading conclusions. For example, two groups may show similar response rates at a particular point in time, but the duration of response may be longer in one group than the other and this difference would not be detected in a simple cross-sectional analysis. Assessing the duration of response once response is achieved (ie, sojourn time) as well as the total time spent in the response state during follow-up would yield more information about the effects of the treatments under investigation than would a conventional cross-sectional approach, yet these aspects of the disease profile have not been investigated in prior SLE trials.
A difficulty with response duration as an endpoint is that the optimal analytic approach for evaluating it is not clear. If we consider a 52-week trial, one might analyse response duration only among those who were observed to be responders at 52 weeks and assess how long the response was continuously maintained up until that time point. This method, however, will result in selection bias since patients who responded at earlier visits but subsequently relapsed are ignored. Estimating response duration is further complicated by missed visits, early dropouts and follow-up schedules that result in intermittent rather than continuous evaluation of patients. Thus, the exact times of achieving and losing response are generally not observed. Furthermore, the common approach of assuming that missing outcomes are non-responses (ie, non-responder imputation) is a strong assumption and can result in underestimating the response duration.
In this paper, we apply a multistate Markov model (MSM) to analyse response duration with complex longitudinal data and examine patient characteristics that predict transitions into and out of the response state. Knowing the latter information for patients who receive standard of care (SoC) and placebo in trials may not provide new insights into patient prognosis, but could be useful for the development of entry criteria that would reduce high placebo response rates in future trials.
MSM models are appropriate for investigating a disease process in which individuals can move between different clinical states. In the SLE clinical trial setting, the two main clinical states of interest are response and non-response. With MSM models, one can estimate the proportion of individuals who will be in various states at some point in the future, and the expected time that a subject spends in each state. Most importantly, the method makes efficient use of incomplete follow-up data when only brief segments of an individual’s disease history are available, and it can handle different types of censoring due to losses to follow-up, periodic monitoring of patients and missed visits.
The MSM approach has been applied to study the different clinical stages of HIV/AIDS, cancer and other illnesses, and was recently used to identify predictors of damage accrual in patients with SLE,1 2 and change in lupus nephritis outcomes.3 The objective in this paper is to fit an MSM to characterise response duration using different measures of SLE response, and explore which baseline variables predict transitions into and out of the response state during follow-up in a large group of patients with moderate to severe SLE who received SoC in 52-week randomised clinical trials.
Methods
Data on 759 patients with SLE with active disease (SLE Disease Activity Index (SLEDAI) ≥6 at entry) who were randomised to placebo plus SoC in 52-week trials were obtained from the Collective Data Analysis Initiative (CDAI) database of the Lupus Foundation of America (LFA). The LFA established the CDAI so that data from the placebo/SoC arms of previous SLE clinical trials can be used to improve the design and conduct of future studies.4 5 Permissible SoC included non-steroidal anti-inflammatory drugs, corticosteroids, antimalarials and immunosuppressants (eg, azathioprine, methotrexate, mycophenolate mofetil). Increases to the steroid dose were allowed only during the first 24 weeks of the trial. Patients were assessed for clinical outcomes approximately every 4 weeks during follow-up. Ethics committee approvals were obtained according to local regulations and informed consent procedures were completed in accordance with the Helsinki Declaration version in effect at the time of each trial.
The following SLE response endpoints (without medication stipulations) were analysed: SLE Responder Index (SRI-4, SRI-5, SRI-6) and the British Isles Lupus Assessment Group (BILAG)-based Composite Lupus Assessment (BICLA). For BICLA, the available sample size was smaller (n=437) because only patients with at least one BILAG A or two or more BILAG B at enrolment were included.
A two-state (response, non-response) reversible model was fit to estimate the probability of being in response at 52 weeks, average duration of response (sojourn time) and mean total time in response for the different response measures. All patients are assumed to be in the non-response state at enrolment and can transition back and forth between the response and non-response states multiple times during the 52-week follow-up period.
To identify predictors of attainment and loss of response, we focused on SRI-5 which has been used as the primary endpoint in recent SLE trials.6 7 The effects of the variables on the two transition intensities (also known as transition rates or hazards) for moving into and out of SRI-5 response were modelled using the following proportional hazards regression approach:

where λ ij(t|x) is the transition intensity at time t between states i and j (i, j=1 or 2 for non-response and response states, respectively) given x = (x1,…,xp)T , a (p x 1) vector of covariates which is assumed to be constant over time and across states; λijo (t) is the baseline transition intensity, and β ij= (βij1,…,βijp )T is the corresponding vector of regression coefficients which quantifies the effect of x on transitions between states i and j. The effect of a specific predictor variable, xk , on the i to j transition intensity can be estimated by exp (βijk ), which is equal to the ratio of the transition intensities corresponding to a unit increase in xk , assuming the other covariates are held constant.
The variables in table 1 were considered for inclusion in the regression model and parameters were estimated using the maximum likelihood approach. Bivariate analyses were initially performed, and variables which were significant at the p<0.10 level, as well as those considered clinically important a priori, were considered for inclusion in the final model which was determined using a stepwise variable selection approach. Only the covariates with p<0.05 were retained in the final model. Since the missing data rates were less than 10% for the covariates in the final model, a listwise deletion approach based on the available data was used to handle the missing values.
Baseline demographic and clinical characteristics (n=759)
We initially assumed a time homogeneous model where the baseline transition intensities are assumed to be constant over time, that is, λ ijo (t) = λ ijo , where λ12o denotes the baseline transition rate between non-response and response (ie, improvement) and λ21o denotes the transition rate between response and non-response (ie, worsening). Given that steroid doses could be increased in the first 24 weeks, we also fit in sensitivity analysis a non-homogeneous MSM model where the baseline transition intensities between states were assumed to be piecewise constant with change points at 12 and 24 weeks.
All analyses were performed using the R statistical software package, msm (V.1.6.4), which was developed specifically for the analysis of multistate disease processes where the exact transition times between states are not known.8 9
Results
Seven hundred and fifty-nine patients were included in the analysis (table 1): 94% were female, 60% were White and the mean age was 39.8 years (SD 12.0). The mean SLEDAI score at baseline was 10.3 (SD 3.6) and patients had disease on average for 7 years (SD 7.0). Eighteen per cent of patients were on azathioprine, 8% on mycophenolate mofetil and 11% on methotrexate as background medications. Over 60% of patients had a BILAG A or B score in the mucocutaneous and musculoskeletal organ systems; 12% in the renal organ. Twenty-four per cent of the subjects discontinued the trial early.
Figure 1 shows examples of different patterns of longitudinal data that can complicate the estimation of response duration. For example, the first subject (ID 1001) achieved a response at months 3–5 and then dropped out of the trial. The third subject (ID 1003) achieved and sustained a response for the first 3 months, missed visit 4, was a non-responder at months 5–8 and then responded continuously again at months 9–12.
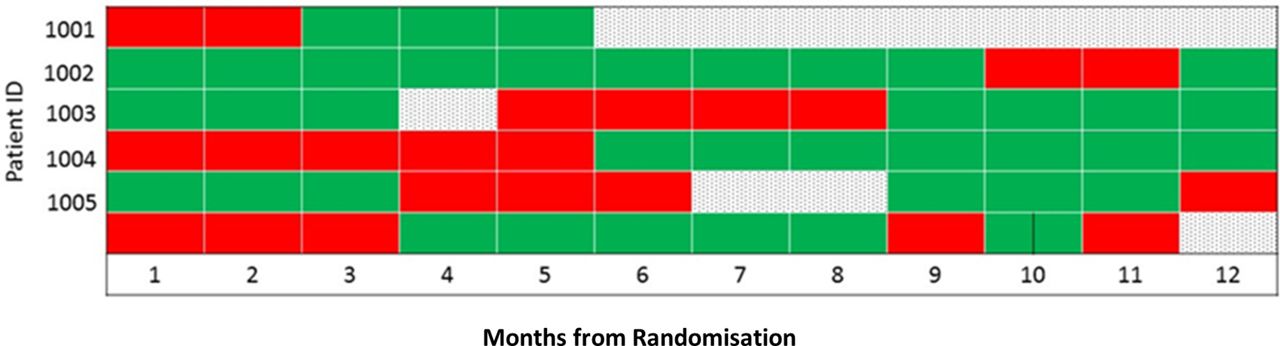
Longitudinal patterns of response status: Green=response, Red=no response, Dotted=missing status.
Table 2 is a frequency table of pairs of consecutive visits from all subjects cross-classified by response status at the initial and subsequent visits for the different response outcomes. For SRI-4, there were 4530 pairs of consecutive visits in which non-response was the initial state and of these, 795 (17.5%) were a response at the subsequent visit. Among the 3648 visit pairs where response was the initial state, 395 (10.8%) were a non-response at the next visit. For SRI-5, SRI-6 and BICLA, 11.0%, 10.7% and 16.6% of visit pairs, respectively, which had non-response at the first visit were followed by response at the subsequent visit; 13.6%, 14.3% and 16.2%, respectively, of visits in which response was the initial state had non-response in the subsequent visit, all greater than the corresponding percentages for SRI-4.
Number of transition between response states among consecutive visits
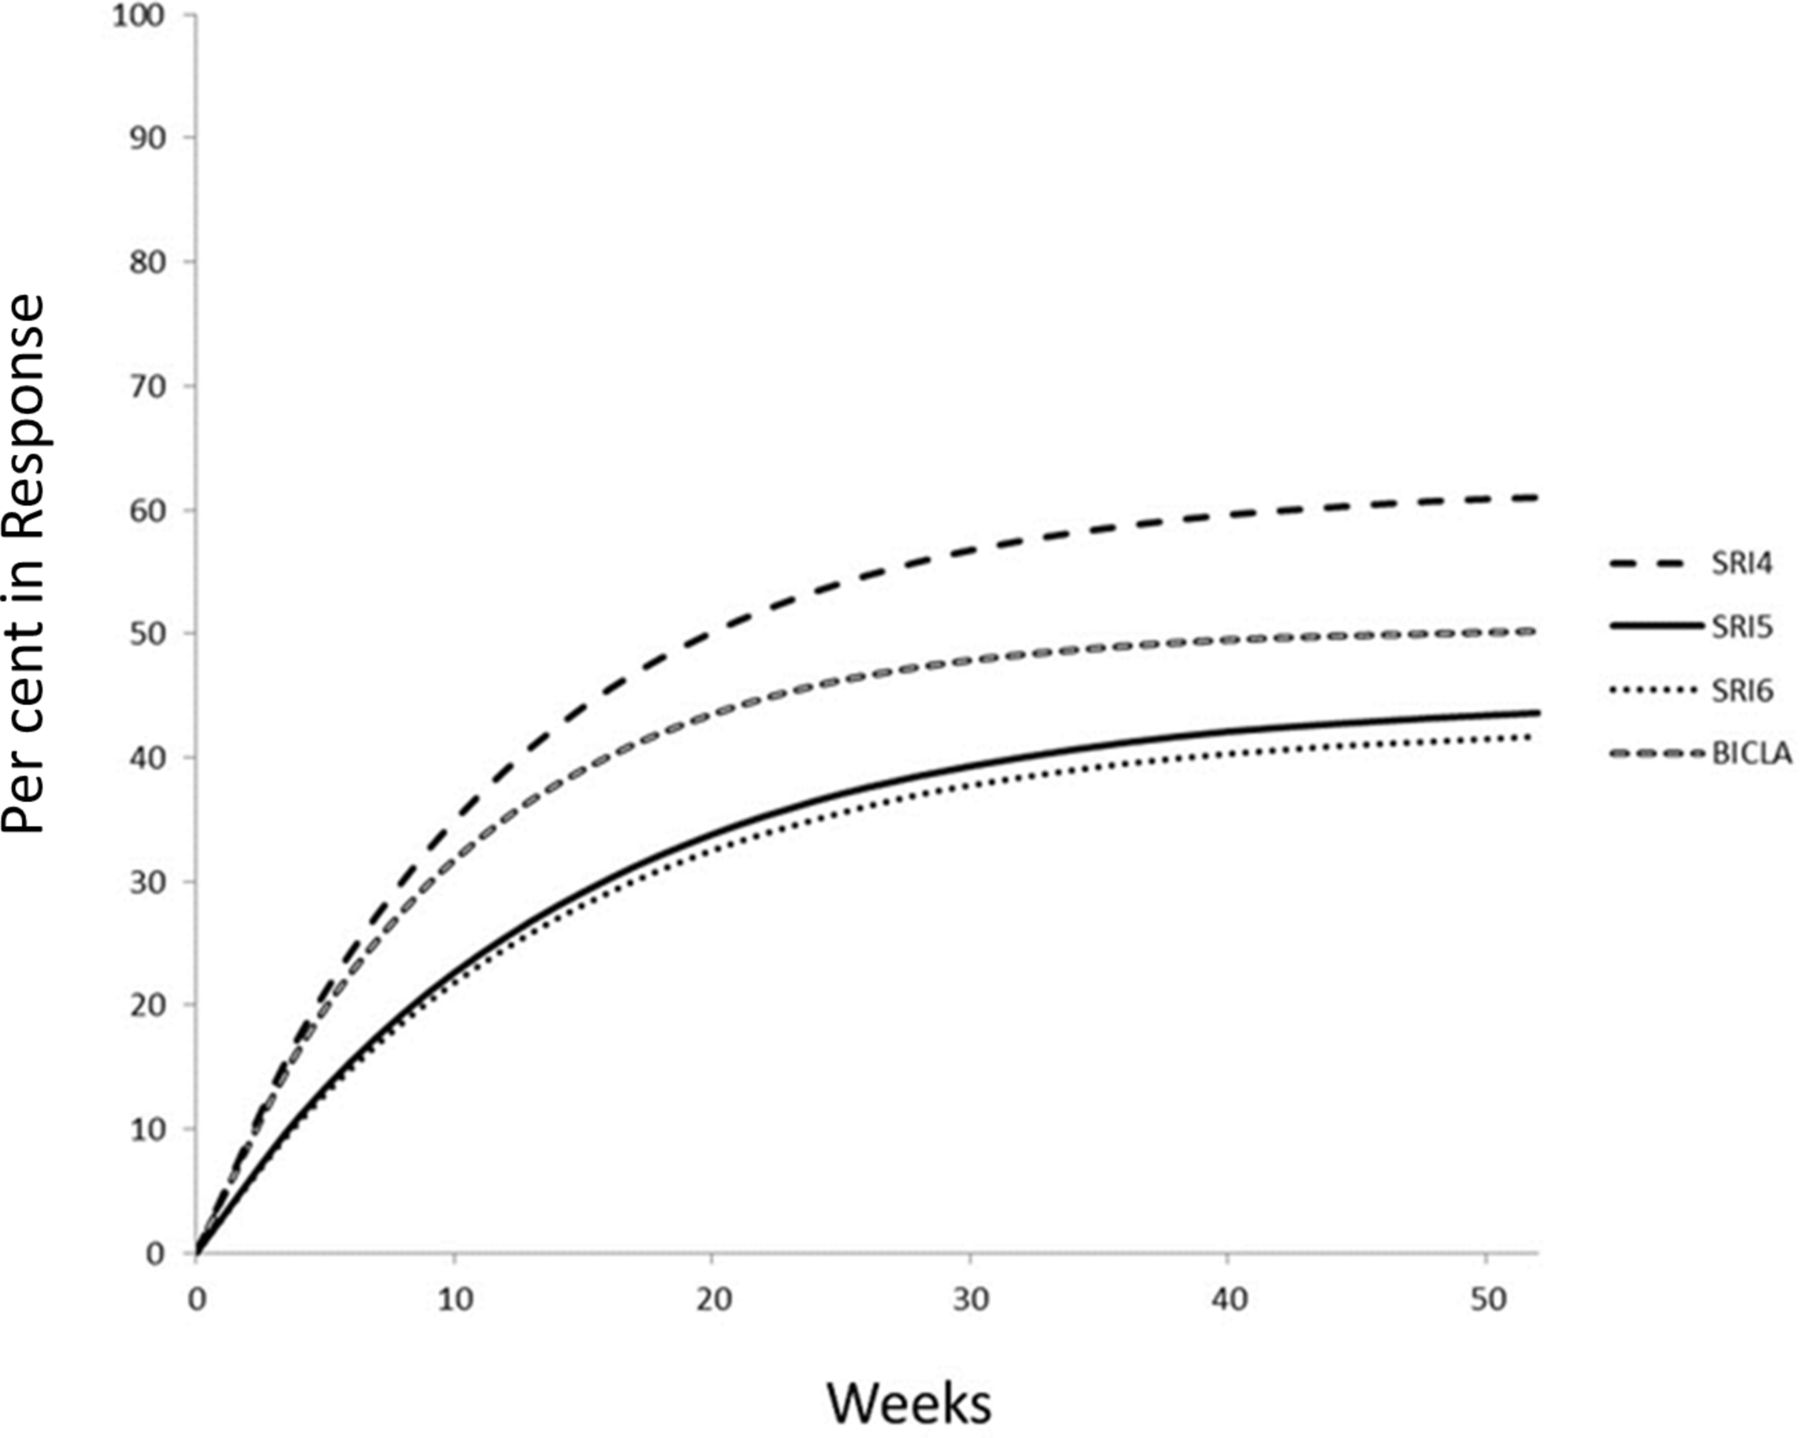
Using the conventional landmark analytic approach with non-responder imputation for missing outcomes, the 52-week response rates ranged from 38.0% for BICLA (95% CI 33.4% to 42.7%) to 45.9% (95% CI 42.3% to 49.5%) for SRI-4 (table 3). These estimates are biased downwards because all missing outcomes are considered non-responses. The corresponding estimates of the probability of being in response at 52 weeks based on an initial two-state MSM model without covariates are higher as expected: 50.2% (95% CI 47.1% to 53.5%) for BICLA and 61% (95% CI 58.3% to 63.5%) for SRI-4. Figure 2 shows MSM estimated probabilities of being in the response state at all time points during follow-up for the different response measures. The trajectories for SRI-5 and SRI-6 are very similar and both lower than the trends for SRI-4 and BICLA.
Estimated response rates and duration of response for different responder indices

Prevalence of responders by week. BICLA, BILAG-based Composite Lupus Assessment; SRI, SLE Responder Index.
The MSM model can also be used to estimate the mean sojourn time for response (the average length of time spent in the response state each time response is achieved) as well as the mean total time in response over 52 weeks of follow-up (table 3). The mean sojourn times ranged from 20.4 weeks (BICLA) to 31.5 weeks (SRI-4). In contrast, the mean total time in the response state based on all patients including persistent non-responders was 16.4–24.8 weeks.
Table 4 shows for different predictor variables the estimated rate ratios for transitioning from non-response to response (RR12), and for transitioning from response back to non-response (RR21) for SRI-5. RR12 values greater than 1 imply higher likelihood of achieving SRI-5 on SoC for patients with that characteristic compared with the reference group; RR21 values greater than 1 imply higher likelihood of leaving the SRI-5 response state and shorter response duration. Among all racial groups, Asians were the least likely to achieve SRI-5 response on SoC at any time (RR12=0.75 compared with Whites; 95% CI 0.59 to 0.95). Patients with higher SLEDAI scores were more likely to achieve response (RR12=1.09 per 1 point increase in score; 95% CI 1.06 to 1.11) as well as remain in the response state (RR21=0.88; 95% CI 0.84 to 0.92), consistent with prior findings of increased response rates in those with higher disease activity at entry.10 In contrast, patients who were of African descent (RR21=1.76 compared with Whites; 95% CI 1.23 to 2.52), had a longer history of disease (RR21=1.27 per 10 years increase; 95% CI 1.07 to 1.51) and had anti-dsDNA titres of at least 30 IU/mL (RR21=1.40; 95% CI 1.07 to 1.81) were more likely to revert back to non-response after response was achieved.
Predictors of transitions between SRI-5 response states
Patients with higher lymphocyte counts (RR21=0.72 per unit increase; 95% CI 0.60 to 0.86) and higher haemoglobin (RR21=0.90 per unit increase; 95% CI 0.83 to 0.98) were more likely to remain in response, that is, have longer response durations. Higher anti-SSARo antibody titres were weakly associated with higher probability of response (RR12=1.02 per 10 units increase; 95% CI 1.00 to 1.03). Younger age and higher protein/creatinine ratio (PCr) were associated with higher likelihood of achieving SRI-5 response (RR12=0.85 for age per 10 years increase; 95% CI 0.78 to 0.92; RR12=2.20 for PCr>500 mg/g; 95% CI 1.66 to 2.92), and of transitioning back to non-response (RR21=0.88 for age per 10 years increase; 95% CI 0.79 to 0.98; RR21=2.16 for PCr>500 mg/g; 95% CI 1.51 to 3.10). The association with age could reflect more aggressive treatment of younger patients, and only transient amelioration by steroids as they were withdrawn. Of note, patients who received mycophenolate mofetil were younger than those who did not (mean age: 36.5 vs 40.1 years, respectively; p=0.01).
To examine differences in findings between the MSM and the usual cross-sectional analysis of data from a single visit with missing outcomes analysed as non-responses, we also fit a logistic regression model that included the same predictor variables as before, but with 52-week response status as the outcome. Baseline characteristics associated with significantly increased likelihood of being a responder at 52 weeks (table 4) include higher SLEDAI (OR=1.11 per 1 point increase; 95% CI 1.06 to 1.17), higher lymphocyte count (OR=1.28; 95% CI 1.01 to 1.62) and higher haemoglobin (OR=1.14; 95% CI 1.01 to 1.28). None of the other laboratory measures (anti-dsDNA, PCr, anti-SSARo) that were significant in the MSM analysis were found to be predictive of 52-week response status in the logistic regression analysis.
We had assumed that the baseline transition intensities are constant over time by fitting a time-homogeneous Markov model. Since adjustments to steroid doses were allowed during the first 24 weeks, we relaxed the time-homogeneous assumption in sensitivity analyses and fit a two-state Markov model which allowed the transition intensities to be piecewise constant between 0–12 weeks, 12–24 weeks and >24 weeks. The results were nearly identical to those of the time homogeneous two-state model (online supplementary table 1).
Supplemental material
Discussion
The within-subject variability in response to therapy over time has not been adequately explored in prior SLE trials, which have tended to focus primarily on cross-sectional response status at specific visits. We recently evaluated longitudinal patterns of the response to SoC in a smaller group of subjects and demonstrated the lack of stability in response status over time and the weak correlation between outcomes measured at earlier and later visits.5 In this paper, we used an MSM approach to make better use of complex longitudinal clinical trial data and obtain a more comprehensive view of the response profile. The MSM method yielded for different response measures estimates of both average duration of response in SoC and total time in response over 52 weeks, which have not been assessed in prior trials. We also showed that characteristics associated with greater disease severity were consistently predictive of shorter response duration on SoC despite exhibiting variable effects on the probability of achieving response at a given time, underscoring that a simple cross-sectional analysis may provide an incomplete and potentially misleading picture of the influence of different factors on disease outcomes.
Some of the significant predictors of achieving and losing response that were identified in our MSM analysis are consistent with well-established prognostic factors for SLE. But knowing the features that permit or prolong response to SoC in the clinical trial setting is helpful for the design of future trials that aim to enrich populations for those less likely to respond to SoC and who would benefit most from experimental therapies. Our results indicate that patients from minority groups and those with higher anti-dsDNA antibody titres are less likely to achieve and maintain response on SoC. In addition, the association of higher SLEDAI scores with higher likelihood of responding and staying in response seems clinically counterintuitive, but the patients with higher scores may be receiving more aggressive SoC, and they can meet the thresholds required for achieving response (eg, reduction in SLEDAI by at least 4 points for SRI-4) in more ways given the way SLEDAI is scored.
We also found that older patients were less likely to respond but were more likely to maintain response once it is achieved. A possible explanation is that a subset of older patients who were enrolled in the trial were misclassified as having SLE and therefore would not respond to SoC, but the ones who did respond have more stable disease and more durable responses than younger patients. Patients with higher lymphocytes and higher haemoglobin tend to be healthier and were observed in our analyses to more likely maintain response. Many of these associations revealed in the MSM analysis were not detected by the logistic regression analysis of the 52-week response status.
A major challenge in the identification of effective new therapies for SLE is the inherent heterogeneity and fluctuation in symptoms that lupus patients can experience over time. Standard cross-sectional approaches for analysing SLE trials can estimate only the proportion of individuals in response at a given visit, whereas the MSM model provides additional clinically important information about the average duration of response and the total time that patients spend in response over a given period. By maximising the use of all the longitudinal disease activity data obtained during follow-up, the MSM method may also be a more powerful way to distinguish effective investigational treatments from background SoC. This will be confirmed in future research with data from both the experimental and control arms of SLE trials.
Footnotes
Collaborators Bevra Hahn, MD; Jan Hillson, MD; Jane Salmon, MD; Nathalie Franchimont, MD, PhD; Neil Solomons, MD; Paul Brunetta, MD; Richard Furie, MD; Robert Hoffman, DO; Sabine Bongardt; Stephen Wax, MD; Tim Behrens, MD.
Contributors MK, JTM, KK and PI contributed to the study design, statistical analysis and interpretation of results. LH contributed to the acquisition of data. All authors reviewed and approved the final manuscript.
Funding This work was supported by a grant from the Lupus Foundation of America.
Competing interests KK received consulting fees from Eli Lilly; MK received consulting fees from Celgene.
Patient consent Not required.
Ethics approval In accordance with the policy of our institution, ethical approval from our Research Ethics Board for this type of study was not required.
Provenance and peer review Not commissioned; externally peer reviewed.
Data sharing statement Please contact the Lupus Foundation of America for access to the Collective Data Analysis Initiative database.