Article Text

Abstract
Objectives The study aimed to determine if serum albumin at 12 months predicts long-term renal outcome at 48 months. Data from the NYU SAMPLE (Specimen and Matched Phenotype Linked Evaluation) Lupus Registry were used to compare the performance of albumin, anti-double-stranded DNA, C3/C4, proteinuria and haematuria.
Methods 82 patients with SLE with data at time of renal biopsy, at 12 months and at a second visit, and up to 48 months were included. The significance of each biomarker as a predictor of an adverse renal outcome (ARO), defined as doubling of serum creatinine, as creatinine >4 mg/dL if initial >2.5 mg/dL or ESRD, was evaluated in univariate and exploratory multivariable Cox proportional hazards models. Hazard ratios (HRs) for ARO with 95% CIs were generated. The receiver operating characteristic (ROC) curves at 48 months were used to identify the optimal cut-off point for albumin and proteinuria to predict ARO. Sensitivity, specificity, positive predictive value (PPV) and negative predictive value (NPV) were calculated for albumin and proteinuria.
Results Serum albumin and proteinuria had statistically significant HRs for ARO (0.140 and 1.459, respectively). The model with both albumin and proteinuria indicated no additional independent contribution of proteinuria to albumin alone. The ROC curves identified cut-offs of 3.7 g/dL for albumin and 0.964 urine protein to creatinine ratio for proteinuria. Albumin had a sensitivity of 94%, specificity of 87%, PPV of 64% and NPV of 98%.
Conclusions This study demonstrates serum albumin >3.7 g/dL is a predictor of a favourable long-term renal outcome. These results support the inclusion of albumin as an outcome in lupus nephritis trials and treat-to-target guidelines.
- Lupus nephritis
- Albumin
- Proteinuria
- Outcomes
- Prediction
This is an Open Access article distributed in accordance with the Creative Commons Attribution Non Commercial (CC BY-NC 4.0) license, which permits others to distribute, remix, adapt, build upon this work non-commercially, and license their derivative works on different terms, provided the original work is properly cited and the use is non-commercial. See: http://creativecommons.org/licenses/by-nc/4.0
Statistics from Altmetric.com
Lupus nephritis is a major cause of morbidity and mortality in SLE, with a prevalence that ranges between 40% and 60%.1 2 Management requires timely diagnosis as well as characterising disease severity by clinical features, International society of nephrology/renal pathology society (ISN/RPS) class, and National Institutes of Health (NIH) activity and chronicity indexes, with preserving renal function as the goal of treatment.3 Despite standard of care, end stage renal disease (ESRD) develops in 26% of patients.4 5 Therefore predicting which patients have ongoing immune-mediated injury and are at the highest risk for progressive renal injury is a priority. The history of lupus nephritis studies includes the use of several outcome measures including ESRD, doubling of serum creatinine, and definitions of complete and partial response over time intervals of 7 years, 4 years, and 24 or 52 weeks, respectively.6–10 A biomarker with excellent sensitivity and specificity for renal outcome can assist in determining the intensity and duration of immunosuppression, as well as serve as a useful primary endpoint in clinical trials. Most recently proteinuria at 12 months was demonstrated to have sensitivity and specificity for predicting renal outcomes at 7 years in three studies.11–13
Analysis of the MAINTAIN Nephritis Trial identified that a proteinuria cut-off of less than 0.7 g/day at 12 months was the best predictor of good long-term renal outcome, with a sensitivity of 71%, a specificity of 75%, a positive predictive value (PPV) of 94% and a negative predictive value (NPV) of 26%.11 In the European Lupus Nephritis Trial (ELNT) cohort, a 0.8 g/day proteinuria cut-off at 12 months had a sensitivity of 81% and a specificity of 78%.12 In both studies adding urinary red blood cells (RBCs) did not improve the predictive value.11 12 Ugolini-Lopes et al 13 using a cohort of 94 patients in a tertiary hospital in São Paulo, Brazil, not enrolled in a randomised controlled renal trial, but rather in a ‘real-life situation’, report that a proteinuria cut-off of less than 0.8 g/24 hours was the best single predictor of long-term renal outcome, with a sensitivity of 90%, a specificity of 78%, a PPV of 67% and an NPV of 94%.
This study was initiated to address the hypothesis that serum albumin predicts long-term renal outcome. The rationale for this premise is the clinical observation that despite proteinuria, preserved albumin associates with maintained renal function. Additionally, albumin is a negative acute phase reactant and reflects the status of glomeruli and proteinuria selectivity.14 The NYU SAMPLE (Specimen and Matched Phenotype Linked Evaluation) Lupus Registry was used to evaluate the predictors of renal outcome at 48 months from biopsy among albumin, urine protein to creatinine ratio (uPCR), haematuria, anti-double-stranded DNA (dsDNA), RBC, C3 and C4.
Patients and methods
NYU SAMPLE Registry and Biorepository
Patients were enrolled in the NYU SAMPLE Bioregistry after signing consent. Inclusion in the SLE cohort required that a patient meets four or more American College of Rheumatology (ACR)15 or systemic lupus international cooperating clinics (SLICC)16 criteria and be 15 years of age or older.
Patient selection
Within the SLE cohort of 763 patients, 325 (43.3%) have history of kidney disease, as defined by the ACR criteria.15 For this study we identified 129 patients with documented renal biopsy. Laboratory values and pathology information were collected at the time of biopsy, and all patients were followed longitudinally from the time of biopsy up to 4 years. Ninety-one patients met the inclusion criteria of having their first annual follow-up visit within a window of ±1 month of 12 months from biopsy, hereafter referred to as 12 months. The objective of the study is to identify the best predictors at 12 months of an adverse renal outcome (ARO) by 48 months from biopsy. ARO is defined as doubling of serum creatinine, as creatinine >4 mg/dL if initial >2.5 mg/dL, or need for renal replacement therapy with either dialysis or transplant. Four patients who were not ARO-free at 12 months were excluded. Patients were required to have at least one additional follow-up visit after their first annual follow-up visit generating 83 patients. The dsDNA samples were measured in different laboratories; values were calculated relative to the upper limit of each laboratory. Since only one patient had an upper limit of 60 at 12 months, the dsDNA could not be standardised within their laboratory and the patient was omitted. Eighty-two patients remained for the final analyses.
Statistical analysis
Distributions of age at biopsy and the continuous markers measured at 12 months (ie, albumin, uPCR, haematuria, dsDNA, C3 and C4) were summarised using medians, ranges and boxplots. The categorical demographic covariates were described using frequency distributions. Scatter plots and Spearman correlation coefficients were used to evaluate the pairwise associations between the continuous markers measured at 12 months. dsDNA at 12 months was standardised for this and subsequent analyses.
Kaplan-Meier (KM) curves were used to estimate ARO-free survival over time in 82 patients. Time to ARO was calculated from 12 months until an ARO occurred or the patient was censored (eg, last data time point at least second follow-up visit, but prior to 48 months). Time to ARO was represented in month units and was rounded to the nearest whole month. A 95% CI for the KM curve was calculated. In addition, the 36-month (from the first annual follow-up) cumulative ARO rate was estimated from the KM curve.
The significance of each of the markers (albumin, uPCR, RBC, C3, C4 and standardised dsDNA at 12 months), as a predictor of ARO, was evaluated both in univariate and exploratory multivariable Cox proportional hazards models. Additionally, albumin and uPCR at 12 months were evaluated in a bivariable model with and without interaction. Hazard ratios (HRs) with corresponding 95% CIs were calculated.
From the Cox models we generated ordered cut-off points for the linear predictor and generated receiver operating characteristic (ROC) curves at 48 months that correspond to the time of interest post biopsy.17 The area under the curve was estimated and the Youden Index was calculated and maximised in order to find the optimal cut-off point of the linear predictor of ARO at 48 months. For a marker with a negative association with ARO, values above the cut-off point predicted a non-ARO at 48 months, whereas marker values below or equal to the cut-off point predicted an ARO at 48 months. For a marker with a positive association, the prediction is in the reverse. This covariate cut-off point corresponded to a particular sensitivity and specificity. PPV and NPV were calculated under an assumed prevalence of ARO at 48 months of 20%.
All analyses were performed using SAS 9.4 and R version 3.0.2 software.
Results
Eighty-two patients were used in the final analyses. The characteristics are summarised in table 1: 78% were female, the median age at biopsy was 37.0 (range 15–65), 43% were Caucasian, 40% African–American, 15% Asian, and 40% Hispanic. ISN/RPS classification included 7% (n=6) class I or II, 40% (n=33) class III or IV, 31% (n=25) class (III or IV)+V, and 22% (n=18) class V. The median albumin and uPCR at baseline were 3.35 mg/dL (range 1.6–4.7 mg/dL) and 2.414 (range 0.330–16.356), respectively. At 12 months the median albumin was 3.9 mg/dL and the median uPCR was 0.882.
Patient characteristics (N=82)
Pairwise scatter plots and Spearman correlations coefficients between markers at 12 months were generated. As expected, albumin at 12 months is negatively correlated with uPCR (−0.43) and with RBC (−0.22) at 12 months. C3 and C4 at 12 months are highly correlated (0.67). Standardised dsDNA is negatively correlated with C3 and C4 at 12 months (−0.33 and −0.45, respectively). The finding that the markers are highly associated with each other indicates the regression model will choose the one that has the strongest influence on the outcome.
The KM curve with a 95% CI is presented in figure 1. From the KM curve, the cumulative ARO rate over time, from 1 year after biopsy, is shown. The cumulative rate is 22% with 14 ARO events observed up to 48 months. Table 2 describes the number of at-risk, ARO, and censored patients in 12-month intervals after the first year from biopsy.
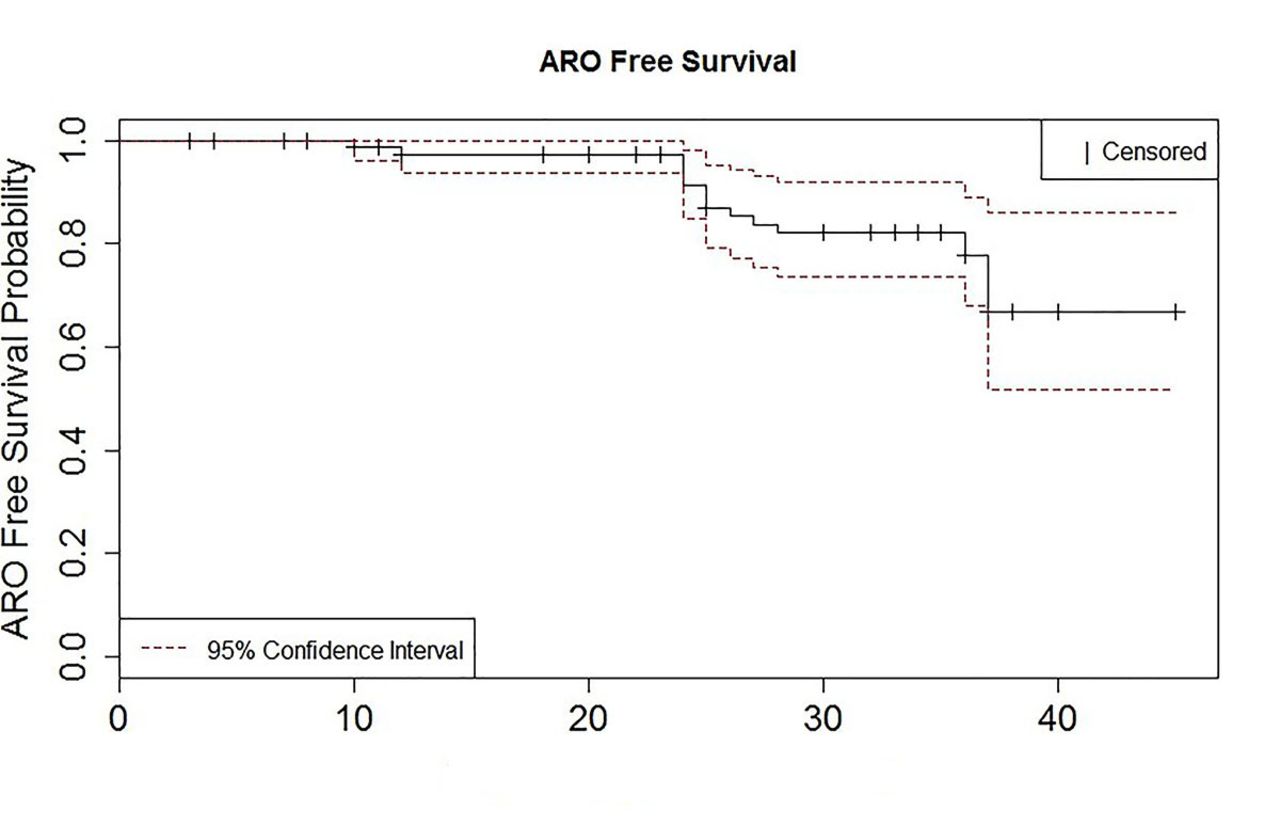
Kaplan-Meir curve for ARO-free survival. ARO, adverse renal outcome.
Distributionof AROs and censored in 12 months intervals in 82 patients
From a Cox model with albumin at 12 months alone, we identified a statistically significantly decreased risk of ARO for larger values of albumin at 12 months (table 3). With an HR of 0.140, there is 0.140 times the risk of ARO with one-unit change in albumin at 12 months. Similarly, from a Cox model with uPCR at 12 months alone, we observed a statistically significantly increased risk of ARO (table 3). This meant an increased risk of ARO for larger values of uPCR at 12 months. With an HR of 1.459, there was 1.459 times the risk of ARO with one-unit change in uPCR at 12 months. The remaining markers—RBC, C3, C4 and standardised dsDNA all at 12 months—were not associated with statistically significant changes in the risk of ARO individually (table 3). Exploratory multivariable Cox models that included all the variables (eg, albumin, uPCR, RBC, C3, C4 and dsDNA) resulted with only the identification of albumin and uPCR at 12 months as predictors of ARO. The model with both albumin and uPCR at 12 months indicated that the albumin HR is negligibly changed by the addition of uPCR to the model, with minimal effect on the albumin HR (ie, 0.140–0.135) with the addition of uPCR at 12 months. Ethnicity is not a significant predictor of ARO in a univariate Cox model (p=0.59) or is it significant when added to the albumin in a multivariable Cox model (p=0.15). Additionally, age and gender are not predictors of ARO (table 3).
Univariate Cox analysis of predictive factors for ARO survival in 82 patients
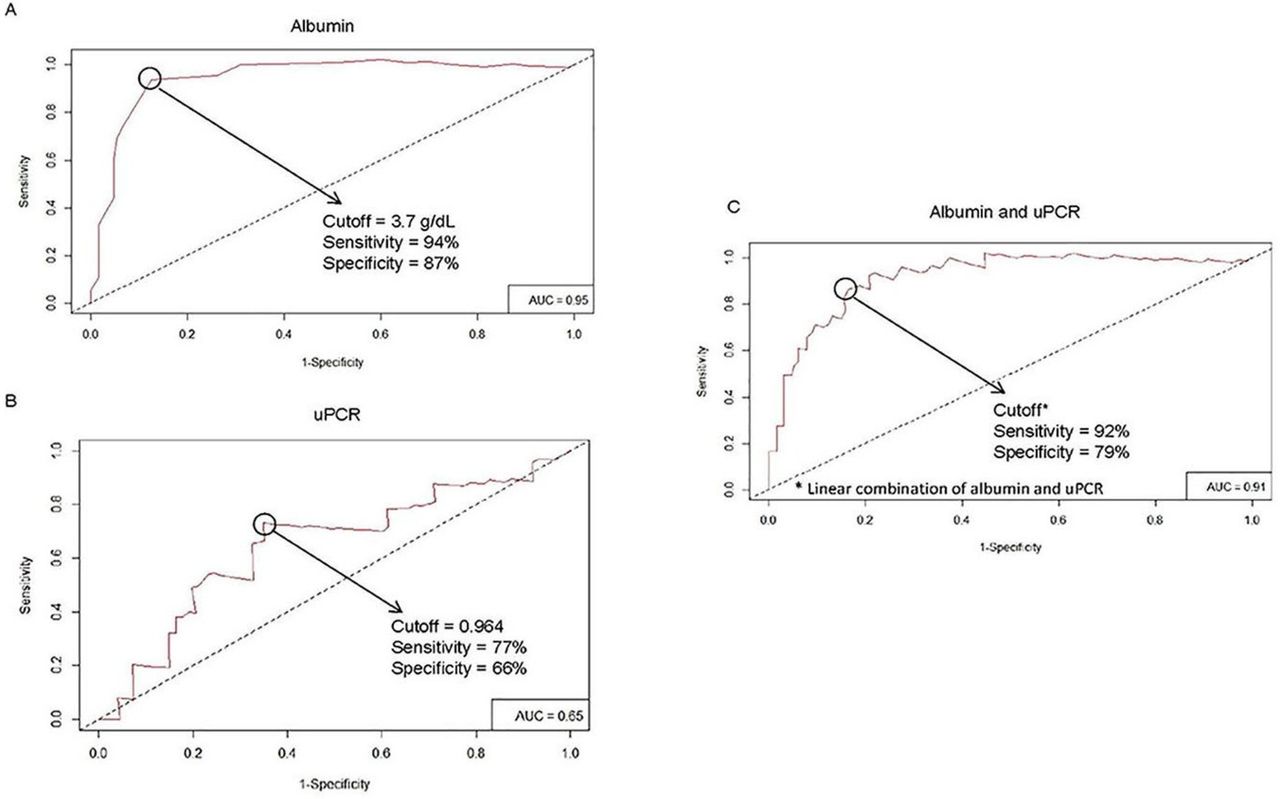
Since from the univariate Cox models only albumin and uPCR at 12 months were found to be statistically significant predictors of ARO, we generated from these models ROC curves at 48 months that corresponded to the time of interest post biopsy. The ROC curves for albumin and uPCR at 12 months are shown in figure 2. We also generated a joint ROC curve for albumin and uPCR at 12 months as predictors of ARO at 48 months in order to evaluate if two markers together have better properties than albumin alone (figure 2). From the univariate Cox model for albumin at 12 months, we derived the following classifier rule: albumin at 12 months with values above 3.7 g/dL predicts non-ARO at 48 months (figure 2). Albumin at 12 months with values below or equal 3.7 g/dL predicts ARO at 48 months. From the univariate Cox model for uPCR at 12 months, we derived the following classifier rule: uPCR at 12 months with values above or equal to 0.964 predicts ARO at 48 months (figure 2). uPCR at 12 months with values below 0.964 predicts non-ARO at 48 months.
Receiver operating characteristic curves of albumin (A), uPCR (B), and combined albumin and uPCR (C) at 12 months of follow-up. AUC, cut-off, sensitivity and specificity values are shown in the graph. AUC, area under the curve; uPCR, urine protein to creatinine ratio.
Albumin at 12 months had a sensitivity of 94% and a specificity of 87%, while uPCR at 12 months had lower sensitivity (75%) and specificity (66%) (table 4). The joint model does not perform any better than albumin alone (table 4). PPV and NPV were calculated for albumin and uPCR at 12 months. The PPV and NPV for albumin are 64% and 98%, respectively, whereas the PPV and NPV for uPCR are 36% and 91%, respectively.
Evaluation of various Cox models as predictors of ARO at 48 months (n=82)
There were 14 AROs up to 36 months from the first annual follow-up visit, 48 months from biopsy. Their distributions by cut-off points are as follows: 13 AROs occurred in patients with albumin at first annual follow-up visit of ≤3.7 g/dL and one ARO in patients with albumin >3.7 g/dL. Eleven AROs occurred in patients with uPCR at first annual follow-up visit of ≥0.964 and three AROs in patients with uPCR <0.964 (table 5). Among the 48 patients with albumin >3.7 g/dL at the first annual visit, only one patient progressed to an ARO, whereas 13 of the 34 with albumin ≤3.7 g/dL at the first annual follow-up visit developed an ARO. Of 48 patients with albumin >3.7 mg/dL at the first annual visit 26 avoided ARO, 1 experienced an ARO, and 21 did not complete 48-month follow-up (ie, censored) as compared to of the 34 patients with albumin <= 3.7 g/dL at the first annual visit 9 avoided ARO, 13 experienced ARO, and 12 did not complete 48-month follow-up (ie, censored)).
Relationship between uPCR or albumin at 12 months and ARO up to 48 months
Discussion
Our study demonstrates that serum albumin >3.7 g/dL at 12 months of follow-up after biopsy is a predictor of a good long-term renal outcome in an ethnically diverse population. A Cox model with albumin at 12 months alone indicated a significant negative association and the risk of ARO (HR=0.140). A Cox model with uPCR alone indicated a significant positive association and a more modest risk of ARO (HR=1.459). On the other hand, uRBC, normalised dsDNA, C3 and C4 did not have a statistically significant HR.
Recently, several studies identified proteinuria at 12 months of follow-up as the best predictor of good long-term outcome. Two studies, the Euro Lupus Nephritis and MAINTAIN, were comprised predominately of Caucasian patients in settings of high likelihood of adherence to treatment. In 2017, Ugolini-Lopes et al 13 validated the cut-off for proteinuria <0.8 at 12 months of follow-up in a ‘real life’, ethnically diverse SLE cohort with more severe lupus nephritis in Brazil. Our design differs from these studies as the definition used for ARO (ie, doubling serum creatinine, creatinine >4 mg/dL if initial >2.5 mg/dL or ESRD) was more stringent (ie, creatinine >1 mg/dL for the European study and >1.5 mg/dL for the Brazilian study). Our definition may be more clinically relevant as it identifies patients more likely to have significant renal damage and a lifetime risk for renal replacement.18 Although an increase in baseline creatinine from less than to greater than 1 mg/dL may indicate significant accrued renal damage, the vast majority of these patients will never require dialysis or transplantation.19 Elevated uPCR did predict ARO, but the observation that combining uPCR and serum albumin at 12 months post follow-up weakens the power of prediction of serum albumin by itself is somewhat surprising given the strong prior evidence for uPCR. However, the discrepancy could be accounted for by proteinuria in a setting absent ongoing renal inflammation. The absence of a predictive value for urinary RBCs or serological markers is in accord with multiple other studies.11 12 20
There are several plausible explanations for preserved albumin despite proteinuria. One speculation is the compensatory hepatic synthesis of albumin outstripping renal excretion. In this scenario, a state of less intense systemic inflammation accounts for a lower negative acute phase response that might otherwise have decreased albumin production. However, the explanation may be due to non-albumin proteinuria. The nature and state of glomerular injury could be selective for non-albumin proteins.21 22 Less intense or resolved immune-mediated injury could generate a circumstance where the number and size of glomerular membrane fenestrations as well as slit diaphragm charge are permissive for non-albumin proteins (ie, allowing for excretion only of proteins smaller than albumin and for intact polyanionic proteins to repel albumin).23
Limitations of our study include its retrospective design, although to date there have been no published studies describing the predictive value of tests at 12 months in a prospective trial. Although this study is from a single centre with a diverse racial and ethnic patient population (table 1), enrolling a more heterogeneous population than the previous three studies where more homogeneous European Caucasian or Hispanic populations were studied, we were able to demonstrate that ethnicity is not a significant predictor of ARO outcome. This study also did not separate patients by ISN/RPS class or NIH activity and chronicity indices, and is unable to determine if the predictive variables would behave differently in patients with proliferative, mixed proliferative plus membranous or pure membranous nephritis. Ugolini-Lopes et al 13 however did report that the predictive value of proteinuria in their cohort was equivalent in patients with proliferative and pure membranous nephritis. Patients’ nutritional status was not formally assessed, but protein calorie malnutrition is uncommon in lupus, and significant reductions in serum albumin regardless of aetiology (eg, dietary, occult liver disease or nephrosis) would also reduce the magnitude of proteinuria for any degree of glomerular injury. All patients were prescribed an ACE inhibitor or ARB, but non-standardised immunosuppressive medication use and inability to define patient adherence are also an issue. Finally, we used uPCR as opposed to 24-hour urine protein or 24-hour uPCR as the data were available for all the study patients. Although there can be discrepancies between uPCR and 24-hour proteinuria,24 spot uPCR has been validated as a useful indicator of lupus nephritis in biomarker and nephritis treatment studies.25 26
In conclusion, this study demonstrates that at 12 months of follow-up, a predictor of renal outcome at 4 years from biopsy is serum albumin, a readily available and inexpensive, clinical laboratory test. These results await validation in independent cohorts, but raise the consideration of adding albumin to proteinuria as an outcome variable in lupus nephritis trials and in treat-to-target guidelines for management.
Acknowledgments
NIHCTSI ULITR001445 provided partial support for biostatistics.
References
Footnotes
Contributors All authors meet the criteria for contributorship.
Funding This authors have not declared a specific grant for this research from any funding agency in the public, commercial or not-for-profit sectors.
Competing interests None declared.
Patient consent Not required.
Ethics approval NYU Langone School of Medicine IRB, approval study number S14-00487.
Provenance and peer review Not commissioned; externally peer reviewed.
Data statement Data sharing available.