Article Text

Abstract
Objective This post hoc analysis compared anifrolumab 300 mg every 4 weeks with placebo on rash and arthritis measures with different stringency in patients with moderate to severe SLE (phase IIb; MUSE; NCT01438489). Subgroups were analysed by type I interferon gene signature (IFNGS test–high or test–low).
Methods Rash was measured with the SLE Disease Activity Index 2000 (SLEDAI-2K), British Isles Lupus Assessment Group (BILAG) Index and modified Cutaneous Lupus Erythematosus Disease Area and Severity Index (mCLASI). Arthritis was evaluated using SLEDAI-2K, BILAG and swollen and tender joint counts. Outcomes were measured at week 52.
Results More anifrolumab-treated patients demonstrated resolution of rash by SLEDAI-2K versus placebo: 39/88 (44.3%) versus 13/88 (14.8%), OR (90% CI) 4.56 (2.48 to 8.39), p<0.001; improvement of BILAG: 48/82 (58.5%) versus 24/85 (28.2%), OR (90% CI) 3.59 (2.08 to 6.19), p<0.001; and ≥50% improvement by mCLASI: 57/92 (62.0%) versus 30/89 (33.7%), OR (90% CI) 3.31 (1.97 to 5.55), p<0.001. More anifrolumab-treated patients had improved arthritis by SLEDAI-2K versus placebo: 55/97 (56.7%) versus 42/99 (42.4%), OR (90% CI) 1.88 (1.16 to 3.04), p=0.032; and BILAG: 65/94 (69.1%) versus 47/95 (49.5%), OR (90% CI) 2.47 (1.48 to 4.12), p=0.003; and mean (SD) swollen and tender joint reductions: –5.5 (6.3) versus –3.4 (5.9), p=0.004. Comparable results were demonstrated in IFNGS test–high patients (n=151). In IFNGS test–low patients (n=50), substantial numerical differences in partial rash and arthritis responses were observed in anifrolumab-treated patients versus placebo, with statistical significance only for rash by BILAG in this small population.
Conclusions Anifrolumab treatment was associated with improvements versus placebo in specific SLE features of arthritis and rash using measures of different stringency. Although driven by robust data in the prevalent IFNGS test–high population, further evaluation in IFNGS test–low patients is warranted.
- Arthritis
- Interferon
- Treatment
This is an open access article distributed in accordance with the Creative Commons Attribution Non Commercial (CC BY-NC 4.0) license, which permits others to distribute, remix, adapt, build upon this work non-commercially, and license their derivative works on different terms, provided the original work is properly cited, appropriate credit is given, any changes made indicated, and the use is non-commercial. See: http://creativecommons.org/licenses/by-nc/4.0/
Statistics from Altmetric.com
Introduction
Type I interferons (IFNs) represent the largest of the three families of IFNs and are composed of five subgroups (IFN-α, IFN-β, IFN-ω, IFN-ε, IFN-κ). All subgroups bind to a common type I IFN receptor, resulting in expression of a cascade of genes, known as the type I IFN gene signature (IFNGS).1 This signalling contributes to the activation of a variety of immune cells, providing defence against viral and other infections.2 The type I IFN system is known to play a central role in the pathogenesis of SLE.3–6 Patients with SLE have increased serum concentrations of type I IFNs,7 and an active IFNGS is observed in 50%–60% of adult patients with SLE.8 9 Most children with SLE, who usually display a more severe disease phenotype compared with adult patients,10 demonstrate increased expression of the active IFNGS.11 In addition, activation of the type I IFN system has been shown to correlate with SLE disease activity in adults. Expression of the IFNGS is more common in patients with severe clinical phenotypes, such as renal disease, haematological disorders and/or involvement of the central nervous system.12 Mounting evidence for a key role of the type I IFN system in the pathogenesis of SLE has prompted the development of several therapies aimed at downregulating type I IFN signalling.13
Anifrolumab is a fully human monoclonal antibody (immunoglobulin G1 κ) that binds to the type I IFN receptor and inhibits signalling by all type I IFNs.14 In a phase IIb study, anifrolumab (300 mg and 1000 mg, administered every 4 weeks (Q4W)) demonstrated efficacy in a broad range of global and organ-specific measures of disease activity in patients with active, moderate to severe SLE.15 It was observed that the effects of anifrolumab treatment on global-composite disease were greatest in the subgroup classified as type I IFNGS test–high at baseline. No significant differences compared with placebo were observed in the IFNGS test–low subgroups.15
In this post hoc analysis of the phase IIb study,15 we examined multiple measurements of different stringencies to determine the consistency of anifrolumab impact on individual manifestations of lupus, in those with or without the IFNGS. In order to optimise the power of this analysis, the focus was on rash and arthritis, the most common individual disease manifestations in patients participating in non-nephritis clinical trials.16
Methods
Patients
Patients were 18–65 years of age and had to fulfil at least 4 of the 11 American College of Rheumatology classification criteria for SLE17 18 at screening. In addition, a positive ANA test ≥1:80, or increased anti-double-stranded DNA or anti-Smith antibody concentrations, were required. Eligible patients had moderate to severe SLE, defined by a SLE Disease Activity Index 2000 (SLEDAI-2K) score ≥6, British Isles Lupus Assessment Group (BILAG) 2004 organ score of ≥‘2B’ (moderate) or ≥‘1A’ (severe),19 20 and a physician’s global assessment of ≥1 on a visual analogue scale ranging from 0 (no disease activity) to 3 (most severe).16 Exclusion criteria included severely active or unstable renal or neuropsychiatric lupus. Further details about this study are found in Furie et al.15
Study design
This is a post hoc analysis based on data from the phase IIb randomised, double-blind, placebo-controlled trial of anifrolumab (NCT01438489; MUSE: Randomised Study to Evaluate the Efficacy and Safety of MEDI-546 in Subjects with SLE).15 Patients were randomised 1:1:1 to receive intravenous placebo, anifrolumab 300 mg or 1000 mg Q4W for 48 weeks, with concomitant standard of care SLE treatment. Randomisation was stratified by type I IFNGS test status (high or low, determined using an analytically validated four-gene (IFI27, IFI44, IFI44L and RSAD2) qPCR-based assay from patients’ whole blood),15 oral corticosteroid (OCS) dosage (<10 mg/day or ≥10 mg/day) at day 1 and by disease activity determined by SLEDAI-2K score (<10 or ≥10) at screening. At baseline, type I IFNGS test–high and test–low patients were identified using a predetermined ΔCt-based cut-off point in the trough of the consistent bimodal distribution seen in this population.15 The study was conducted in accordance with the principles of the Declaration of Helsinki and the International Conference on Harmonisation Guidance for Good Clinical Practice.
Post hoc analyses
Post hoc clinical outcomes for rash included the percentage of patients with improvement from baseline at week 52, defined by SLEDAI-2K (which requires full resolution to improve), BILAG (which can detect partial or complete improvement) and modified Cutaneous Lupus Erythematosus Disease Area and Severity Index (mCLASI, which detects fine increments of improvement or any degree of change). Here, mCLASI was defined as the activity portions of CLASI that describe skin erythema, scale/hypertrophy and inflammation of the scalp. Damage, oral ulcers and alopecia without scalp inflammation were excluded from the mCLASI analysis. The endpoint assessed was the percentage of patients who entered the trial with a positive mCLASI activity score and who achieved a ≥50% decrease from baseline at week 52; this was considered to likely represent a clinically meaningful improvement.
Improvement in arthritis, as measured by SLEDAI-2K, is defined as reduction in arthritis activity to less than two active joints, which translates to full resolution of arthritis. Improvement in arthritis by BILAG was determined along increments of glossary-defined mild, moderate or severe disease activity, where improvement occurred whenever severe or moderate arthritis reduced to a lesser grade. Only patients with baseline involvement for each outcome were included in analyses of rash (as measured by SLEDAI-2K, BILAG and mCLASI) and arthritis (by SLEDAI-2K and BILAG).
Changes from baseline in swollen and tender joint counts at week 52 were also examined; analysis of joint counts in the modified intention-to-treat (mITT) population was pre-specified. Outcomes for this study were evaluated in the mITT population, which included all randomised patients who received any investigational product and had baseline primary efficacy measurements, and in IFNGS test–high and test–low subgroups.
Statistical methods
Analysis of binary endpoints compared the response rates between the anifrolumab and placebo groups using a logistic regression model adjusted for randomisation stratification factors. Continuous endpoints were compared using an analysis of covariance model adjusted for randomisation stratification factors, with the baseline value as the covariate. For the responder analyses, patients who withdrew from treatment, had increased use of OCS beyond the protocol-permitted dosage, or initiated or increased immunosuppressant dosage any time after baseline were considered non-responders at week 52. For the continuous endpoint of change from baseline in swollen and tender joint counts to week 52, missing data were imputed by the baseline-observation-carried-forward method. Here, we report results using anifrolumab 300 mg Q4W, as this dosage has demonstrated a better benefit–risk profile compared with anifrolumab 1000 mg Q4W. P values were not adjusted for multiplicity, and values <0.05 were considered nominally statistically significant.
Results
Study patients
The population used for this analysis consisted of 201 patients randomised to treatment (placebo: N=102; anifrolumab 300 mg Q4W: N=99). Baseline disease characteristics were similar between treatment groups (table 1). At baseline, 151/201 (75%) patients were classified as IFNGS test–high.
Baseline characteristics for clinical outcome measures
Most common lupus manifestations in patients
Given the low number of IFNGS test–low patients (n=50), this subgroup analysis was restricted to the most common manifestations of SLE in the MUSE study, which were arthritis and rash (online supplementary table 1). At baseline, SLEDAI-2K-defined arthritis was present in 96.4% of patients and rash in 84.6%. Using BILAG definitions, 79.0% of patients entered the trial with rash, including 16.0% with a BILAG A (severe) score and 63.0% with a BILAG B (moderate) score. BILAG definitions of arthritis were met by 91.8% of patients, with 34.4% determined as BILAG A and 57.4% as BILAG B. Other common features of SLE, measured by SLEDAI-2K, are listed in online supplementary table 1.
Supplemental material
Effects of anifrolumab on rash, measured in all patients and IFNGS test–high and –low subgroups
SLEDAI-2K-defined resolution of rash at week 52
A significantly greater percentage of patients treated with anifrolumab 300 mg Q4W (44.3%) versus placebo (14.8%) demonstrated resolution of rash on SLEDAI-2K; OR (90% CI) 4.56 (2.48 to 8.39), p<0.001 (figure 1A). Comparable results were observed in the IFNGS test–high subgroup: anifrolumab, 49.3%; placebo, 10.8%; OR (90% CI) 8.08 (3.72 to 17.52), p<0.001 (figure 1A). However, in the IFNGS test–low subgroup, there was no difference in the frequency of SLEDAI-2K-defined rash resolution between patients treated with anifrolumab or placebo: anifrolumab, 28.6%; placebo, 26.1%; OR (90% CI) 1.40 (0.43 to 4.53), p=0.639 (figure 1A).
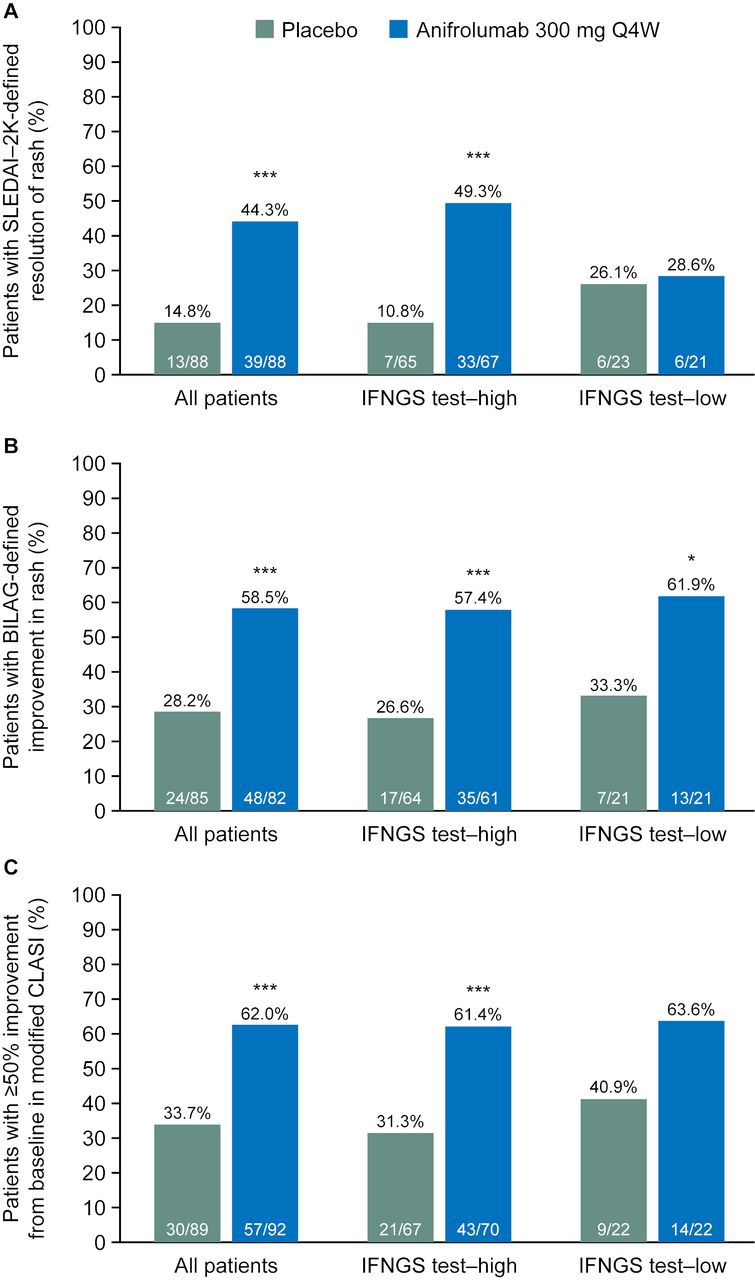
Patients with SLEDAI-2K-defined resolution of rash (A), BILAG-defined improvement in rash (B) and improvement in mCLASI activity scorea (C) in all patients, and IFNGS test–high and IFNGS test–low subgroups at week 52. aPatients with mCLASI activity score >0 at baseline who achieved ≥50% improvement from baseline. *p<0.05, **p<0.01, ***p<0.001 compared with placebo. Only patients with baseline involvement for each outcome were included in analyses of rash (as measured by SLEDAI-2K, BILAG and mCLASI). BILAG, British Isles Lupus Assessment Group; IFNGS, interferon gene signature; mCLASI, modified Cutaneous Lupus Erythematosus Disease Area and Severity Index; Q4W, every 4 weeks; SLEDAI-2K, Systemic Lupus Erythematosus Disease Activity Index 2000.
BILAG-defined improvement in rash at week 52
A significantly greater percentage of patients treated with anifrolumab 300 mg Q4W (58.5%) versus placebo (28.2%) demonstrated improvement from baseline in rash, as measured by BILAG, which includes partial and complete improvements; OR (90% CI) 3.59 (2.08 to 6.19), p<0.001 (figure 1B). Using this less stringent BILAG definition for response, both the IFNGS test–high and test–low subgroups demonstrated a treatment effect: anifrolumab, 57.4%; placebo, 26.6%; OR (90% CI) 3.78 (2.00 to 7.14), p<0.001 and anifrolumab, 61.9%; placebo, 33.3%; OR (90% CI) 3.93 (1.28 to 12.04), p=0.044, respectively (figure 1B).
mCLASI improvement in rash and scalp inflammation at week 52
A significantly greater percentage of patients with mCLASI activity scores >0 at baseline, treated with anifrolumab 300 mg Q4W (62.0%) versus placebo (33.7%), demonstrated ≥50% improvement from baseline in mCLASI; OR (90% CI) 3.31 (1.97 to 5.55), p<0.001 (figure 1C). Similar results were observed in the IFNGS test–high subgroup: anifrolumab, 61.4%; placebo, 31.3%; OR (90% CI) 3.67 (2.01 to 6.71), p<0.001 (figure 1C). There was a similar trend in the IFNGS test–low subgroup: anifrolumab, 63.6%; placebo, 40.9%; OR (90% CI) 2.70 (0.94 to 7.80), p=0.123 (figure 1C). The response rates in the anifrolumab-treated IFNGS test–high and test–low subgroups were comparable, but the placebo response was greater in IFNGS test–low patients. Nevertheless, in this small population, the difference in treatment effect was >20%.
When the analysis was explored in even smaller subsets of patients entering the MUSE study with mCLASI activity scores ≥6 or ≥10, similar trends were observed (online supplementary table 2); no statistically significant differences could be detected in these limited populations.
Effect of anifrolumab on arthritis, measured in all patients and IFNGS test–high and test–low subgroups
Resolution of SLEDAI-2K-defined arthritis at week 52
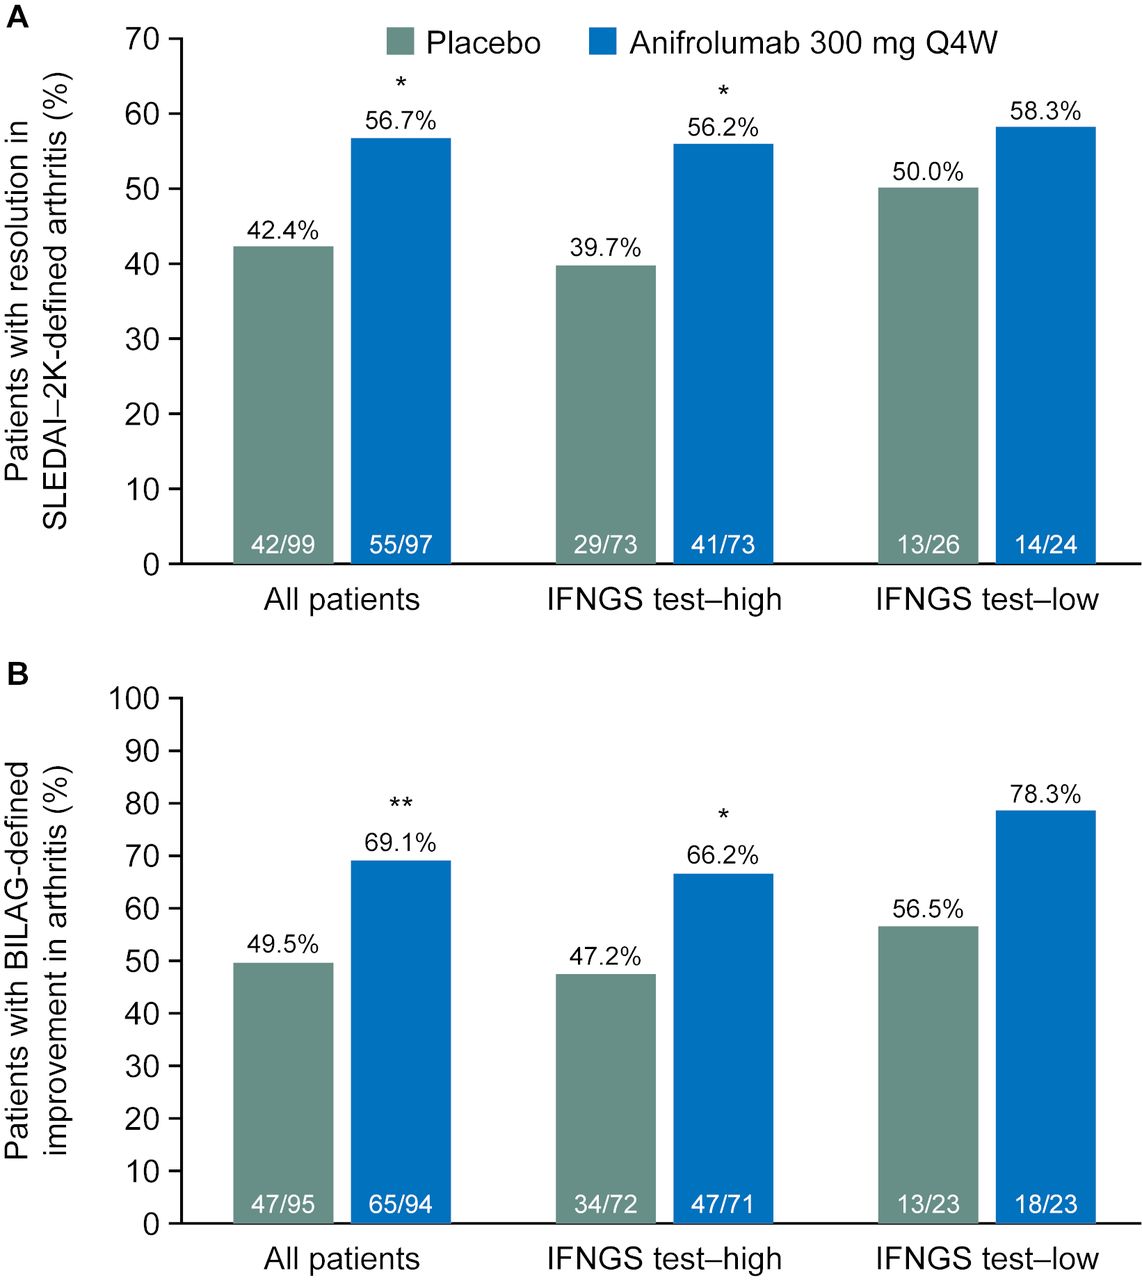
A significantly greater percentage of patients treated with anifrolumab 300 mg Q4W (56.7%) demonstrated SLEDAI-2K-defined near-resolution of arthritis compared with placebo (42.4%); OR (90% CI) 1.88 (1.16 to 3.04), p=0.032 (figure 2A). Similar results were observed in the IFNGS test–high subgroup: anifrolumab, 56.2%; placebo, 39.7%; OR (90% CI) 2.11 (1.20 to 3.71), p=0.030 (figure 2A). Patients in the IFNGS test–low subgroup had similar rates of response to anifrolumab compared with IFNGS test–high patients. However, very high response rates were observed in the placebo group of IFNGS test–low patients, and no treatment difference was observed for anifrolumab versus placebo: anifrolumab, 58.3%; placebo, 50.0%; OR (90% CI) 1.41 (0.55 to 3.64), p=0.547 (figure 2A).

Patients with resolution in SLEDAI-2K-defined arthritis (A) and BILAG-defined improvement in arthritis (B) in all patients, and IFNGS test–high and IFNGS test–low subgroups at week 52. *p<0.05, **p<0.01, ***p<0.001 compared with placebo. Only patients with baseline involvement for each outcome were included in analyses of arthritis (by SLEDAI-2K and BILAG). BILAG, British Isles Lupus Assessment Group; IFNGS, interferon gene signature; Q4W, every 4 weeks; SLEDAI-2K, Systemic Lupus Erythematosus Disease Activity Index 2000.
BILAG-defined improvement in arthritis at week 52
Using BILAG, which can detect partial improvement, as well as resolution, a significantly greater percentage of patients treated with anifrolumab 300 mg Q4W (69.1%) demonstrated improved arthritis versus placebo (49.5%); OR (90% CI) 2.47 (1.48 to 4.12), p=0.003 (figure 2B). Comparable results were observed in the IFNGS test–high subgroup (anifrolumab, 66.2%; placebo, 47.2%; OR (90% CI), 2.39 (1.34 to 4.27), p=0.013, figure 2B). In the IFNGS test–low subgroup, there was greater improvement for both the anifrolumab and placebo groups compared with the IFNGS test–high subgroup, maintaining a similar treatment effect size, which was not statistically significant in this small patient population (anifrolumab, 78.3%; placebo, 56.5%; OR (90% CI) 2.91 (0.97 to 8.72), p=0.110, figure 2B).
Swollen and tender joint counts at week 52
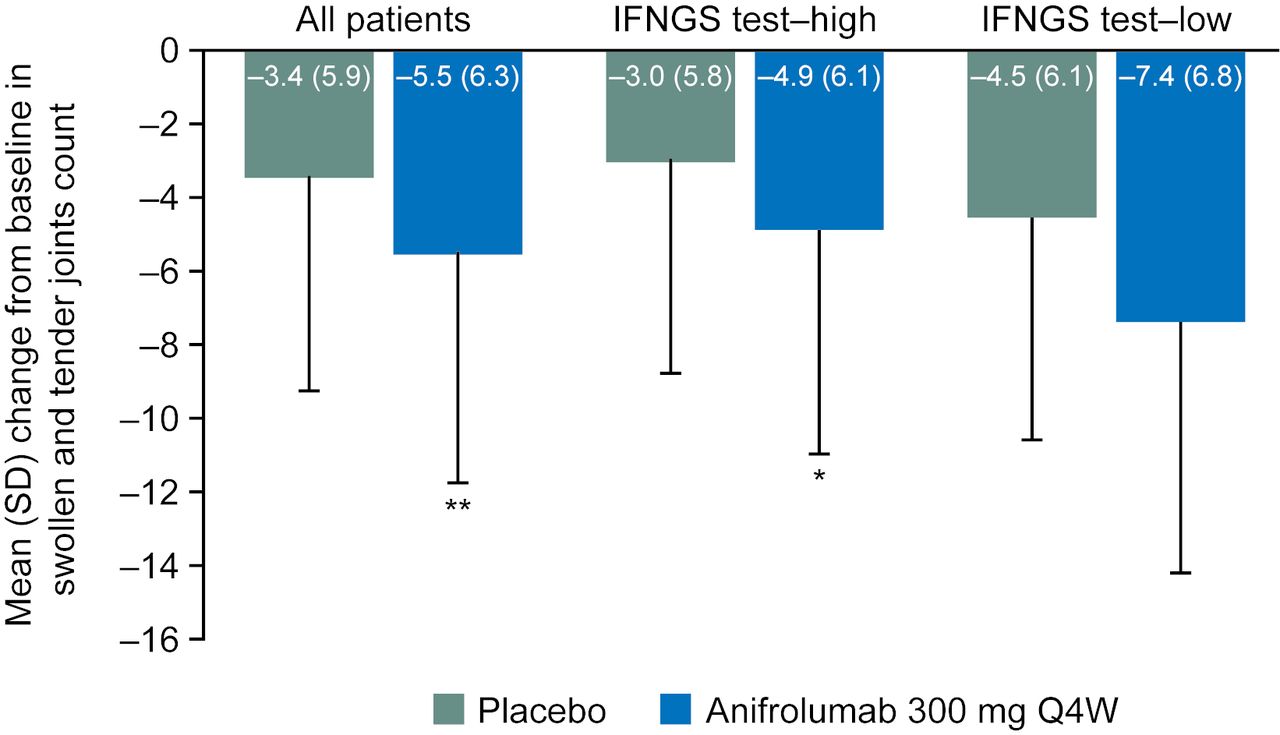
Mean reduction from baseline (SD) at week 52 in swollen and tender joint counts was significantly greater for patients treated with anifrolumab 300 mg Q4W (–5.5 (6.3)) compared with placebo (–3.4 (5.9)); mean treatment difference (SE) –1.9 (0.7), p=0.004 (figure 3). This was also observed in the IFNGS test–high subgroup (anifrolumab, –4.9 (6.1); placebo, –3.0 (5.8); mean difference (SE), –1.9 (0.8), p=0.014, figure 3). For the IFNGS test–low subgroup, the mean difference between anifrolumab and placebo was comparable with the test–high subgroup, but this was not statistically significant (mean difference (SE), –2.1 (1.4), p=0.140, figure 3).

Change from baseline to week 52 in swollen and tender joint counts in all patients, and IFNGS test–high and IFNGS test–low subgroups. *p<0.05, **p<0.01, ***p<0.001 compared with placebo. IFNGS, interferon gene signature; Q4W, every 4 weeks.
The 1000 mg Q4W anifrolumab group demonstrated similar results to the 300 mg group when compared with placebo, but with a smaller treatment effect (online supplementary table 3).
Discussion
Treatment with anifrolumab 300 mg Q4W was associated with improvements in both rash and arthritis compared with placebo. Consistent with previous findings,15 the anifrolumab 300 mg dose group demonstrated greater numerical responses to most outcomes compared with the anifrolumab 1000 mg group. Similar to previously reported results using general disease activity measures,15 these improvements were observed both in all patients and in patients with increased expression of type I IFNGS at baseline. In patients with low expression of IFNGS, anifrolumab 300 mg Q4W did not demonstrate any differences compared with placebo in the SLEDAI-2K measures of rash and arthritis, which require complete or almost complete resolution of the manifestations, respectively.21 22 However, when examining BILAG measures of rash and arthritis, mCLASI and joint count measures, all of which can detect partial improvements, improvements were detected in the IFNGS test–low subgroup following anifrolumab treatment, comparable with those generated for the IFNGS test–high subgroup, although only the BILAG analysis of rash was statistically significant in this smaller subset of patients. The presence or absence of improvements in clinical response in both subgroups may be due to differences in type I IFNGS expression in tissue and blood, where the full effects of IFN activity throughout the body may not always be reflected by the IFNGS test status measured in the blood.
These exploratory data on a small subset of patients are not robust enough to demonstrate that anifrolumab is efficacious in patients with low expression of type I IFNGS, but do raise the possibility that there could be some benefit in these patients, not previously detected using compound endpoints or endpoints based on SLEDAI that require symptom resolution. Patients with decreased type I IFNGS expression treated with placebo may have a higher response to background standard of care treatment than patients with increased expression of the type I IFNGS because of differences between subgroups in disease severity or in the pathogenic mechanisms driving the disease, which might be more potently targeted by standard of care treatment. It is therefore possible that a genuine treatment benefit may have been masked by a high placebo response rate in the IFNGS test–low subgroup. The current observations reported here in single organ assessments, use more graded definitions of response support, but do not prove this interpretation. Studies with greater numbers of patients with low expression of type I IFNGS may help to clarify the findings of this post hoc analysis.
The type I IFN pathway is considered to play a central role in the development of rash in patients with SLE. Increased expression of IFN gene-regulated transcripts and proteins has been found in lesional skin of patients with cutaneous lupus erythematosus (CLE),23 24 and evidence suggests that plasmacytoid dendritic cells might be key in the pathogenesis of rash by producing IFN-α/β in cutaneous lesions of these patients.25 In addition, the level of IFNGS expression has been found to correlate with cutaneous disease activity in patients with subacute CLE or discoid lupus.26 Findings from our analyses support the hypothesis that type I IFN is a key driver for skin disease in SLE. The IFNGS test was helpful in identifying a group of patients more likely to obtain benefit from treatment, especially when using a measurement with a higher threshold for response, such as SLEDAI-2K. With this index, rash score only decreases with resolution, and arthritis score only decreases when there is minimal arthritis, although some minor or subclinical arthritis might still be present. However, some differences between treatment and placebo were observed in the group of patients with low expression of type I IFNGS, suggesting that patients without IFNGS should not necessarily be permanently eliminated as potential candidates for IFN signalling blockade without further study.
The data presented here suggest that type I IFNs help to drive arthritis in patients with SLE. However, the distinction from placebo was generally less robust for measures of arthritis, suggesting that the relationship between type I IFN activity and joint pathology may be more complex. Rheumatoid arthritis (RA), like SLE in adults, seems to be characterised by a detectable type I IFNGS, observed in about 50% of patients.27 Although RA is generally a more pannus-driven, erosive disease than the inflammatory arthritis of SLE, they both exhibit a spectrum of clinical pathologies, including some forms of mild RA with reduced erosion,28 and some forms of severe lupus arthritis that are more RA-like and may even respond to anti-tumour necrosis factor (TNF) therapy.29 It seems likely that in both diseases, a range of inflammatory pathologies may be impacted by, but are not always dependent on, type I IFNs. In a study of 51 patients with RA receiving rituximab, patients with high expression of type I IFNGS were less likely to respond to treatment, suggesting that other pathways may be more relevant for some of the patients.30 In addition, patients with elevated type I IFNGS in the RA study had fewer swollen joints at baseline, potentially placing them further along the clinical spectrum towards lupus arthritis.30 In a different small study (N=35), it was found that patients with RA who had elevated type I IFNGS and relatively high IFN-α/β concentrations were more likely to respond to anti-TNF therapy than those with low IFNGS.31 Activation of TNF-α characterises the classic T-helper 1 pathology of RA,32 but has been ubiquitously associated with IFN-γ (type II).33 However, it is now known that TNF signalling can also be induced or enhanced by type I IFNs with or without type II IFN activity.34–37 The paradoxical cytokine relationships that underlie inflammatory arthritis have already been reviewed.38 Since almost all patients in this study enrolled with active arthritis, no case can be made that the presence or absence of type I IFNGS is necessary for this clinical feature. However, our data also suggest the possibility that interference with the IFN receptor might have some benefit, at least for some patients, whether or not a strong type I IFN signal is observed.
In conclusion, findings from this post hoc analysis of data from the phase IIb MUSE study indicate that, compared with placebo, anifrolumab treatment results in consistent improvements in individual manifestations of rash and arthritis, when measured by several different symptom-specific approaches in patients with SLE. Improvement rates for both rash and arthritis were more robust in the subset of patients with elevated type I IFNGS, but some improvements were observed in patients with low IFNGS when indices measuring partial improvement were used. These findings suggest that a test for type I IFNGS might be helpful in designating a population with a greater likelihood of achieving benefit from IFN receptor blockade. However, it is premature to completely eliminate patients from access to this class of medication based solely on type I IFNGS, especially if their manifestations have been refractory to different modalities.
Acknowledgments
The authors would like to acknowledge Niki Panagiotaki, PhD of QXV Comms, Macclesfield, an Ashfield Company, part of UDG Healthcare plc, for medical writing support that was funded by MedImmune, in accordance with Good Publication Practice (GPP3) guidelines (http://www.ismpp.org/gpp3). The authors would also like to thank the patients and their families, as well as the staff members at all trial sites.
References
Footnotes
Presented at Employee of MedImmune at the time that the original study was conducted.
Contributors JTM, RF, JD and LW contributed to conception and design of the study, collection and analysis of data, and data analysis and interpretation. VPW and MK contributed to data analysis and interpretation. GI and RT contributed to conception and design of the study, and data analysis and interpretation. All authors contributed to manuscript preparation and review, approved the final version of the manuscript and agree to be accountable for all aspects of the work.
Funding The study was funded by MedImmune, a member of the AstraZeneca Group.
Competing interests JTM has received grants and personal fees from AstraZeneca during the conduct of the study. She has also received grants from GSK, BMS, Xencor and Exagen; consulting fees from GSK, BMS, EMD Serono, Calgene, UCB, RemeGen, Exagen, Lilly, Amgen, Janssen, Sanofi, Anthera and Neovacs; and fees for participating in data safety monitoring boards from Immunopharma and Takeda, outside the submitted work. RF has been a consultant and investigator for MedImmune/AstraZeneca and has participated in an advisory board for MedImmune/AstraZeneca. VPW has been a consultant for MedImmune and has received a grant from AstraZeneca. The University of Pennsylvania owns copyright over the CLASI. MK reports no conflicts of interest. JD, LW and GI are employees of Viela Bio. RT is an employee of AstraZeneca. JD, GI, LW and RT own stock with AstraZeneca.
Patient consent Obtained.
Ethics approval Institutional Review Board or Independent Ethics Committee.
Provenance and peer review Not commissioned; externally peer reviewed.
Data sharing statement No additional data are available.