Article Text

Abstract
Single-cell RNA sequencing (scRNA-seq) has recently undergone rapid advances in the development of this technology, leading to high throughput and accelerating discovery in many biological systems and diseases. The single-cell resolution of the technique allows for the investigation of heterogeneity in cell populations, and the pinpointing of pathological populations contributing to disease. Here we review the development of scRNA-seq technology and the analysis that has evolved with the ever-increasing throughput. Finally, we highlight recent applications of scRNA-seq to understand the molecular pathogenesis of lupus and lupus nephritis.
- lupus nephritis
- systemic lupus erythematosus
- inflammation
This is an Open Access article distributed in accordance with the Creative Commons Attribution Non Commercial (CC BY-NC 4.0) license, which permits others to distribute, remix, adapt, build upon this work non-commercially, and license their derivative works on different terms, provided the original work is properly cited and the use is non-commercial. See: http://creativecommons.org/licenses/by-nc/4.0
Statistics from Altmetric.com
Introduction
Kidney involvement in patients with systemic lupus erythematosus (SLE), or lupus nephritis (LN), can affect up to 50% or more of all lupus patients and remains an important source of morbidity and mortality. Although the exact mechanism of LN progression is still a matter of ongoing research and debate, there are several distinctive features of the disease including immune complex deposition on the glomerular basement membrane, which can result in inflammation and ultimately reduced glomerular function.1 Additionally, hyperproliferation of the resident mesangial and endothelial cells, and fibrosis affecting the renal interstitial and glomerular compartments are often observed as the disease progresses.2 3 Examination of renal tissue obtained by a percutaneous biopsy reveals that glomerular involvement can be highly variable even within the same patient. Moreover, patients with a similar histological classification can have variable responses to treatment, even when similar protocols are employed. Thus, the examination of kidney biopsy tissue by light and electron microscopy alone do not provide sufficiently accurate prognostic information, and additional modes for assessing disease progression must be developed to optimise patient care. Lupus renal biopsies demonstrate notable histological differences between patients which are reflected in the classification scheme in widespread use; however, the mechanisms underlying these distinct histopathological classes are not well understood, and at the molecular level, they may even display more heterogeneity than the proliferative and membranous patterns currently recognised. Finally, studies of LN and kidney diseases, in general, have traditionally relied on visualisation-based approaches such as microscopy and flow cytometry. These approaches do not provide sufficient data regarding gene expression changes within specific cell types. Such an understanding may further elucidate the communication between cells and the pathological processes contributing to heterogeneity in ultimate tissue injury.
More recently, approaches such as transcriptome profiling with microarrays and RNA sequencing (RNA-seq) have been applied in LN to RNA isolated from whole or laser-capture micro-dissected renal tissue. For instance, Fu et al used RNA-seq to elucidate the molecular basis for the efficacy of combination therapy in LN, finding that combination therapy with tacrolimus and mycophenolate mofetil as compared with either drug given alone suppressed the IL-6/STAT3 pathway and inhibited Toll-like receptor 7 expression.4 ‘Bulk’ RNA sequencing of tissues yields information regarding the average expression of all cell types contributing to the isolated RNA. Therefore, even in cases where glomeruli alone are sequenced, expression changes may come from any of the cell types found within the glomerulus and cannot be unambiguously assigned to a specific cell type. This can potentially cause changes in interesting genes to be overlooked within the average especially if they are expressed in a rare cell type which may be only present at the level of a few percents of a tissue. Although cytometric sorting of cell populations before sequencing can greatly increase the cell type specificity of RNA-seq analysis, heterogeneity within a cell type such as proliferating versus resting cells still may remain unrecognised.
Single-cell RNA-seq (scRNA-seq) addresses these technical challenges by providing transcriptomic profiling at a single-cell resolution. This methodology allows for the characterisation of cells represented in tissue and independent from each other without prior knowledge of lineage markers.5 Furthermore, scRNA-seq facilitates the identification of cell-state-specific expression patterns and offers unique insights into cell differentiation and cell–cell ligand–receptor interactions. Advances in microfluidic technology have lowered the cost per cell and dramatically increased the throughput, propelling the technology into a new age. In this paper, we review the promise of scRNA-seq and its potential application to different diseases involving the kidney.
scRNA-seq Protocols
scRNA-seq is fundamentally similar to traditional RNA-seq in that it involves reverse transcription and preparation of a cDNA library followed by DNA sequencing. The most important difference is that scRNA-seq yields many libraries carrying cell-specific barcodes instead of one single library from the RNA pool of many cells. In bulk RNA-seq, small cell populations contribute little when averaged with larger cell populations, but in scRNA-seq, they contribute unique profiles at a rare frequency (figure 1). This is accomplished in different ways depending on the technique and can be broadly categorised into two distinct approaches: (a) plate/tube-based and (b) microfluidic-based strategies. These two categories share common workflows starting with the isolation of a single-cell suspension from tissue or sample, physical capture of single cells in distinct chambers, lysis, reverse transcription, amplification, library preparation and next-generation sequencing. scRNA-seq methods differ in the way single cells are captured and physically separated and in the chemistry used to amplify and create libraries for sequencing (figure 2). Regardless, the amplification step can introduce biases due to the kinetics of cDNA amplification leading to artefactual over-representation of certain mRNAs. This has been dealt with in many scRNA-seq protocols by the integration of unique molecular identifiers (UMIs) which tag sequence reads originating from an mRNA molecule. UMIs provide a digital expression approximating actual count of mRNAs sequenced rather than relative abundance which is typical of traditional RNA-seq, and in this way remove PCR bias. scRNA-seq originated as a tube-based or plate-based methodology and evolved as microfluidic technology advanced, each evolution increasing the throughput from single-digit numbers of profiles per experiment to thousands per preparation.
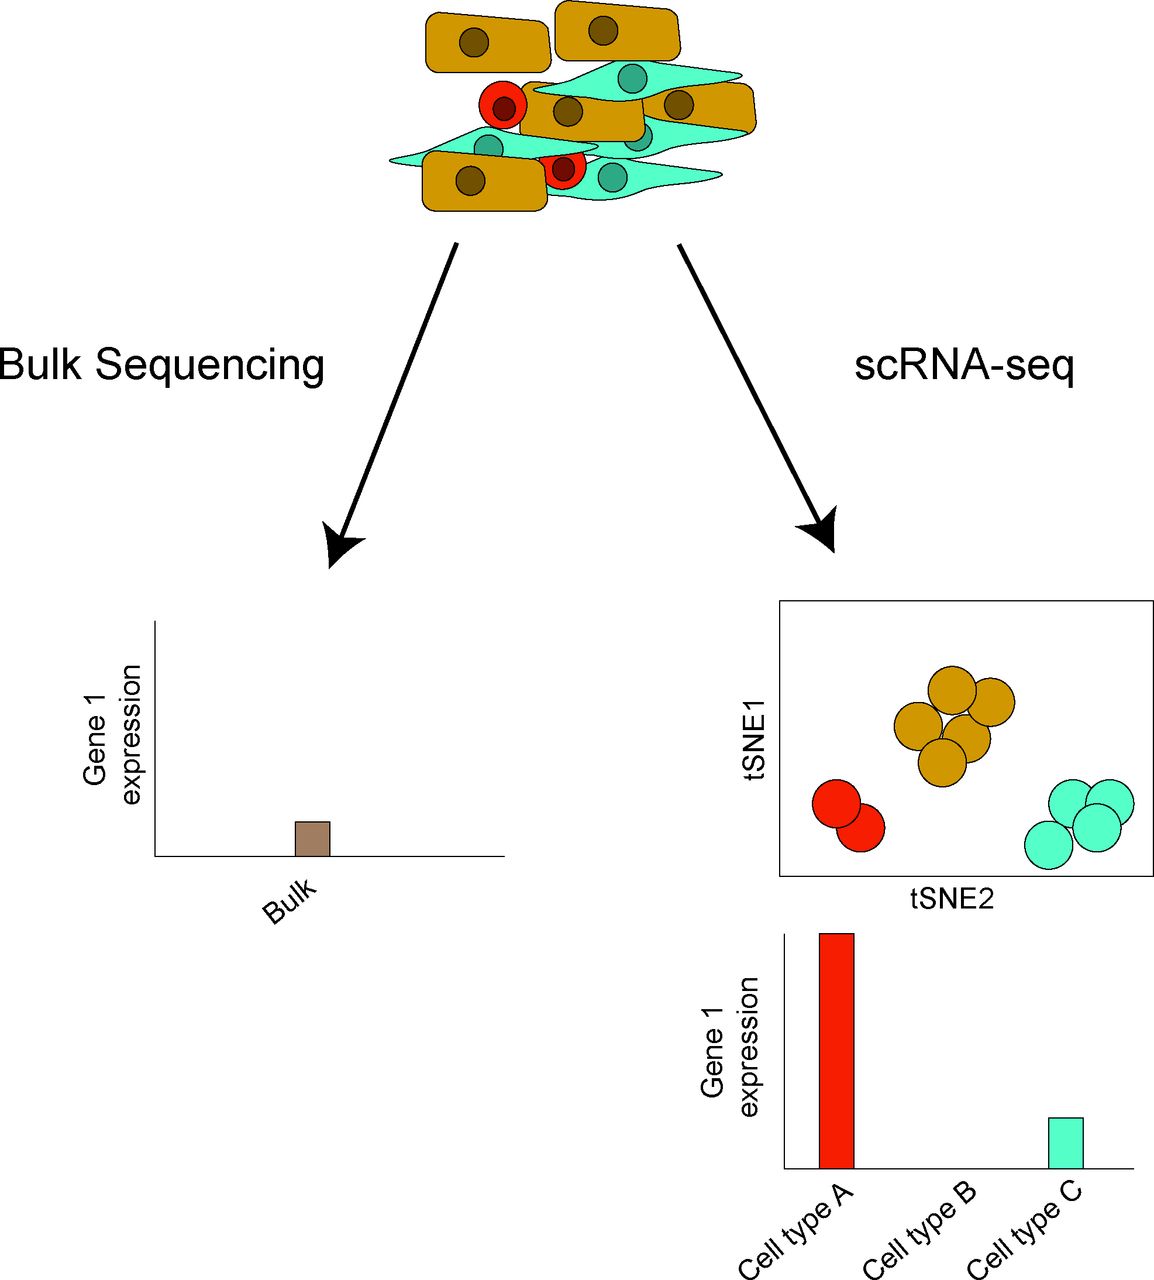
Bulk sequencing versus scRNA-seq. In bulk sequencing, a pool of extracted RNA from a population of cells is sequenced, providing expression data representing the average expression of a particular gene across all cells. In contrast, scRNA-seq retains the originating cell-specific transcript information. If many cells of the same cell type were identified, the averaging of sequence reads across all cells yields cell-type-specific expression information similar to bulk RNA-seq profiles. Hypothetical outputs for a gene in bulk sequencing and scRNA-seq are shown. scRNA, single-cell RNA sequencing; tSNE, t-Distributed Stochastic Neighbour Embedding.
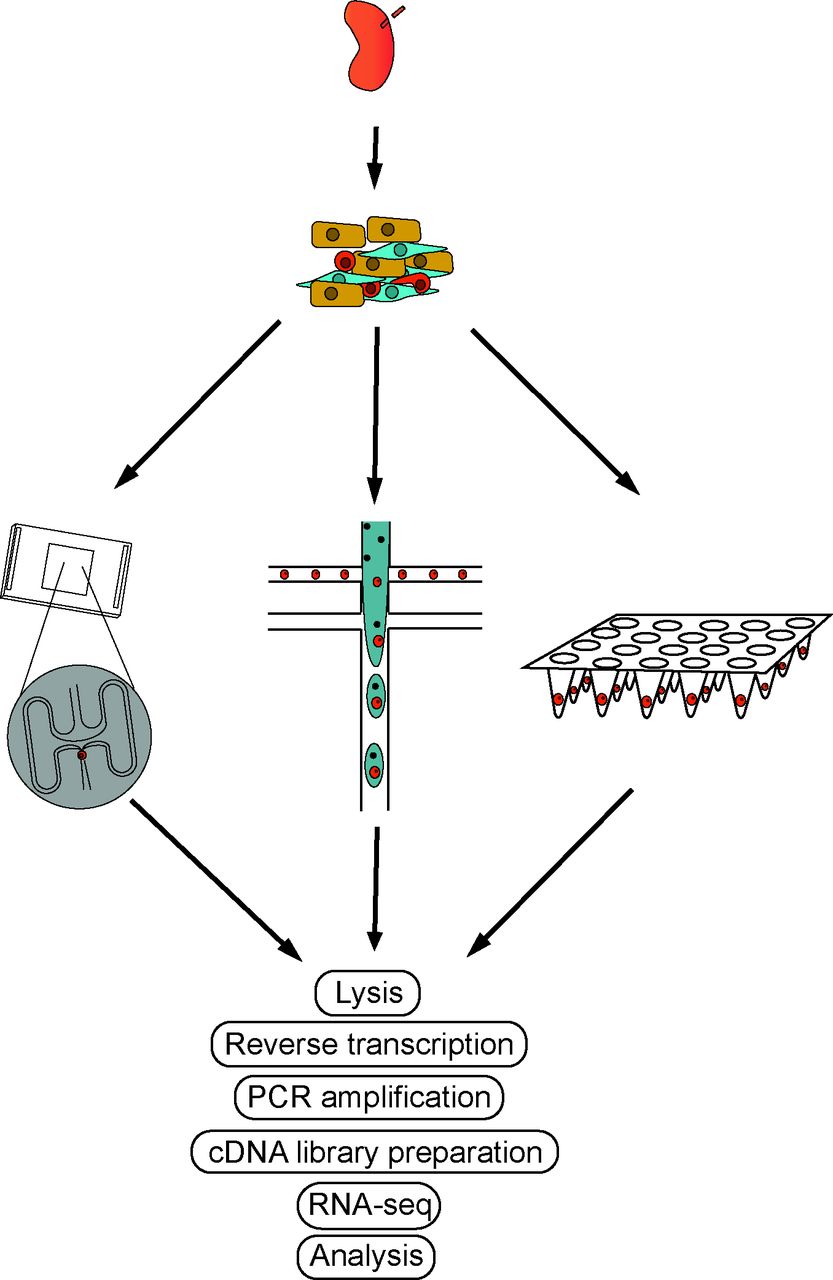
ScRNA-seq workflows. The basic workflow of scRNA-seq follows similar steps regardless of the platform. Tissue is disaggregated into single-cell suspensions and loaded onto the scRNA-seq platform of choice (ie, Dropseq or Fluidigm C1). Lysis, reverse transcription, PCR amplification and sequencing are followed by downstream analyses. scRNA, single-cell RNA sequencing.
Plate-based and tube-based scRNA-seq
Plate-based and tube-based methods include the original method of scRNA-seq by Tang et al where individual cells were manually transferred into PCR tubes for reverse transcription, amplification and library preparation.6 Single-cell tagged reverse transcription (STRT-Seq)7 and switching mechanism at 5’ end of RNA template (SMART-Seq)8 both increased the scale of scRNA-seq by transitioning to a 96-well plate format where cell barcodes were introduced during the library preparation step. This allowed for the pooling and sequencing of 96 single-cell libraries in a single sequencing run, decreasing the cost of sequencing and increasing the throughput. Cell expression by linear amplification and sequencing2 (CEL-Seq2)9 improved further on this method by introducing UMIs into the reverse transcription allowing for the reduction in noise due to non-linear PCR amplification. This process furthermore relies on 3’ end counting and thus does not generate full-length sequences of cDNA, which precludes the examination of splice variation and isoform. When paired with an automated cell capture method such as fluorescence activated cell sorting (FACS), or the Fluidigm C1 integrated fluidic chip,10 the automation resulted in an order of magnitude increase in throughput. The Fluidigm C1 system has the added benefit of reducing the reaction volumes from μL to nL volumes for reverse transcription and improves on the efficiency of some enzymatic steps during cDNA library preparation. In addition, this system allows imaging of individual cells before processing. Fluidigm also released a high throughput platform with an integrated fluidic chip capable of capturing 800 cells per experiment instead of 96 per experiment in the previous generation, further increasing the throughput capacity in scRNA-seq. The cost per cell, however, remains relatively high with this level of throughput, approximately US$3–5 per cell.
Droplet-based scRNA-seq
Droplet-based approaches utilise microfluidic technology to capture single cells in buffer-oil emulsion droplets for cDNA capture and/or reverse transcription with droplet volumes in the nL range. This technology has the largest throughput potential, limited only by sample material and cost. The best technologies conduct reverse transcription and barcoding within the droplet.
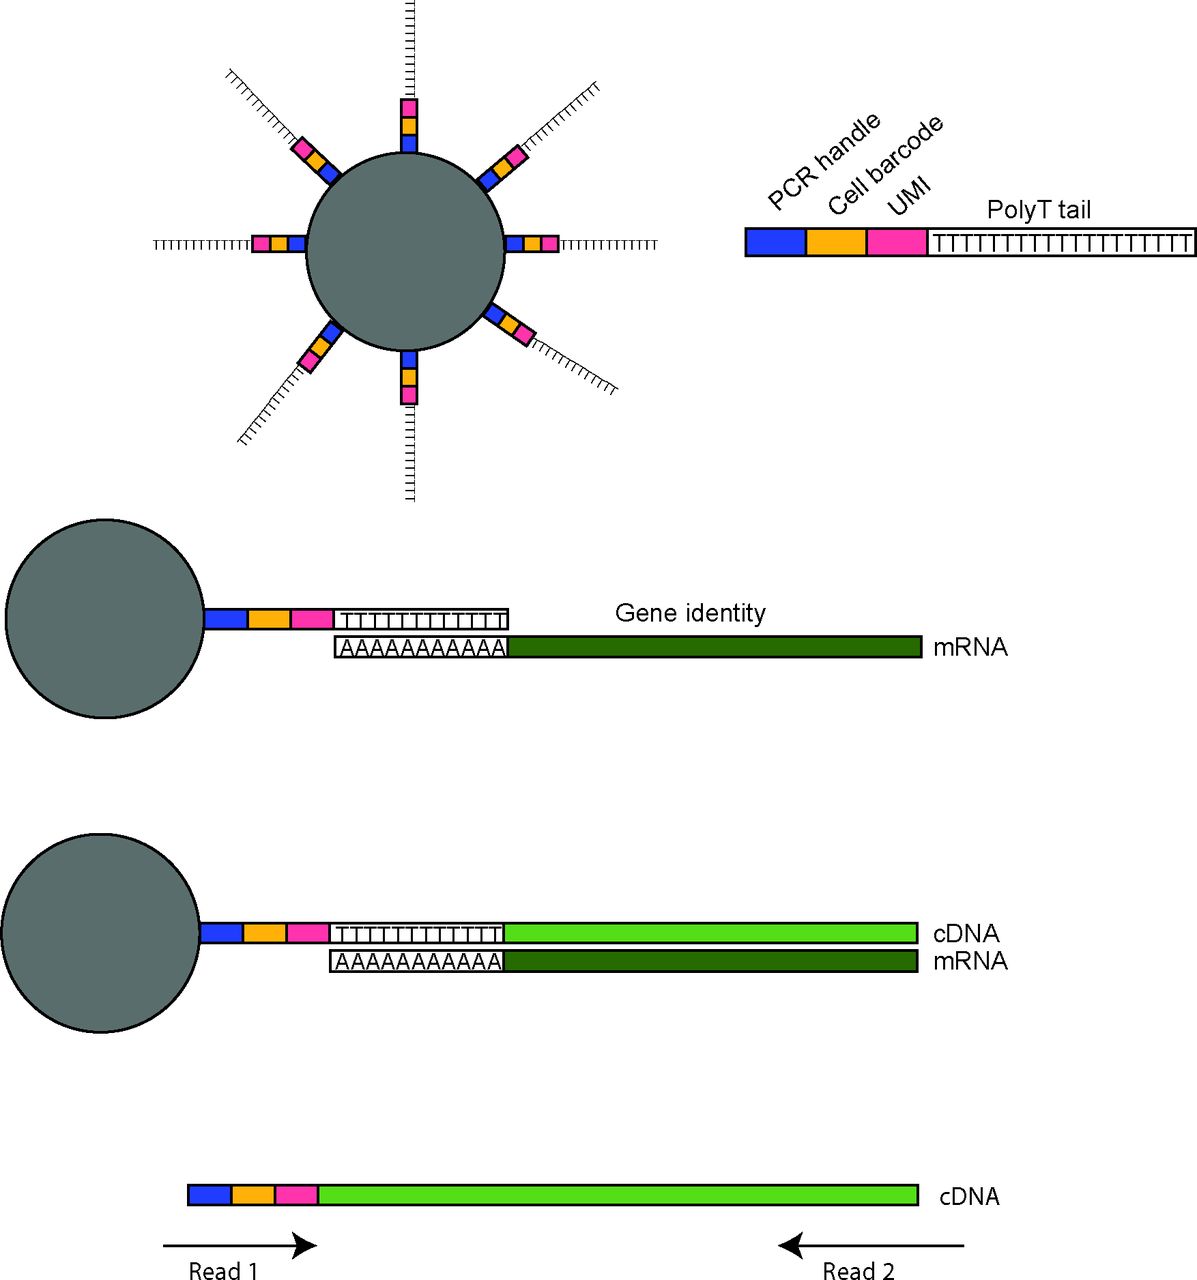
The first microfluidic-based approaches were DropSeq11 and InDrops,12 which were developed and published at the same time. Both methods rely on a microfluidic chip to control the flow of oil, cell suspension and barcoded beads suspended in lysis buffer and reaction reagents, for optimal droplet formation. Millions of droplets form at the intersection of the three inlets with the aim of simultaneously capturing one cell and one bead per droplet. One of the critical components of these methods are the barcoded beads, which in the case of DropSeq are microparticle beads covered with oligonucleotides containing a PCR handle, a unique cell barcode (UMI) and a 3′ terminal polyT segment typically 30 nucleotides in length. The polyT segment is for capturing polyA mRNA and priming of reverse transcription, and although the polyA tail length can vary, a 30-nucleotide oligo-dT is sufficient for the capture of mature mRNAs. During reverse transcription, the cell barcode, UMI and PCR handle are incorporated into each cDNA molecule. This allows for the pooling of all cDNAs during subsequent PCR steps as the cell identity and UMIs are specific for each cDNA (figure 3). Although millions of droplets can be formed in this manner, the beads and cell suspension flow rates need to be adjusted to minimise doublet cell capture, yet maximise the frequency of a droplet containing both a cell and a barcoded bead. The capture rates for DropSeq were suboptimal and near 5%–10% of total input cells. InDrops uses hydrogel beads packed with oligonucleotides. These beads are deformable and can be passed through narrower channels in comparison with DropSeq solid beads, which allows for improved fluidic control and increased cell capture rates of 60%–90%. Both methods significantly reduced the cost per cell over the plate-based scRNA-seq methods to US$0.60–0.90, though the total cost per experiment overall remains similar.

Droplet-based scRNA-seq integration of cell barcodes and UMIs. Droplet-based scRNA-seq platforms use barcoded beads to retain information both on the cell of origin and mRNA sequence. This is accomplished by use of beads conjugated to oligonucleotides-containing sequences for the PCR priming, a cell barcode unique for each bead and a UMI randomised sequence distinguishing oligonucleotides per bead. The end of the oligo is a polyT tail which binds to polyA tails of mature mRNAs. This allows reverse transcription of the mRNA into a cDNA molecule which now contains the PCR handle, cell barcode and UMI. in this way, during PCR amplification, the information regarding input cell of origin and mRNA of origin is retained. When the library is prepared and sequenced, both ends are sequenced. The first read will sequence the cell barcode and UMI, whereas the second read sequences the cDNA. Together these reads provide the gene encoding the mRNA, the cell it was expressed in, and further, by summing UMIs, the total number of mRNAs for the specific gene in that cell. scRNA, single-cell RNA sequencing; UMI, unique molecular identifiers.
Several commercial adaptations of microfluidic scRNA-seq approaches have emerged after the DropSeq and InDrops publications. The most notable two are the 10X Genomics Chromium platform and the Illumina/Bio-Rad system. Both are more expensive per cell than DropSeq or InDrops custom-built devices, but offer more standardisation and convenience, analytical software and technical support. 10X Genomics has recently introduced an approach to also capture the 5′ ends of mRNAs. This enables T-cell receptor and B-cell receptor sequencing in tandem with mRNA 3′ end sequencing, in order to evaluate the clonality of B and T cells.
Protein integration
One of the major limitations of scRNA-seq is that not all mRNAs are captured by this approach and only a small percentage are sampled so that statistical methods need to be employed for assigning cell-type identity. Furthermore, the sparse sampling of transcripts per cell is prohibitive to estimating RNA abundance per cell. However, lineage assignment and combination of reads from the same cell types ultimately leads to cell-type-specific expression profiles, as obtained from ‘bulk’ RNA sequencing from purified cell populations. Sparse sampling is a particular problem when assigning cell states of small cell types with little cytoplasm and lower mRNA content, especially leukocytes. This has prompted efforts of combining scRNA-seq with simultaneous antibody-based protein detection referred to as RNA Expression And Protein sequencing assay (REAP-seq) 13 and Cellular Indexing of Transcriptomes and Epitopes by sequencing (CITE-seq).14 Similar to flow cytometry, but instead of labelling antibodies with a fluorophore or heavy metal ion tags, they are conjugated to polyA-tail-containing oligodeoxynucleotides to be sequenced simultaneously with the single-cell transcriptome. The initial proof of concept experiment labelled with 16 distinct antibodies. Although promising, these techniques have not yet been applied to kidney tissue, and it is likely that further careful optimisation of each antibody will be necessary to ensure that the relevant epitopes are not cleaved during the tissue disaggregation. The potential for surface protein expression to be altered during preparation for scRNA-seq has also not yet been explored in kidney cells.
Data analysis
Nearly every scRNA-seq platform relies on Illumina sequencing to provide sequence read files in FASTA or FASTQ format for downstream analyses. However, due to the distinct barcode, UMI and sequencing adapter usage, each methodology also relies on custom bioinformatic pipelines, whereas commercial platforms may additionally distribute analysis software with their platforms. Common to these pipelines, FASTQ sequence read files are trimmed from adapters and need to pass filters controlling for sequencing quality. Sequence reads are then aligned against the genome in order to assign the reads to genes. Platforms using UMIs generate a digital expression matrix based on a number of transcripts captured per single cell. Platforms that do not incorporate UMIs generate a matrix composed of relative transcript abundances.
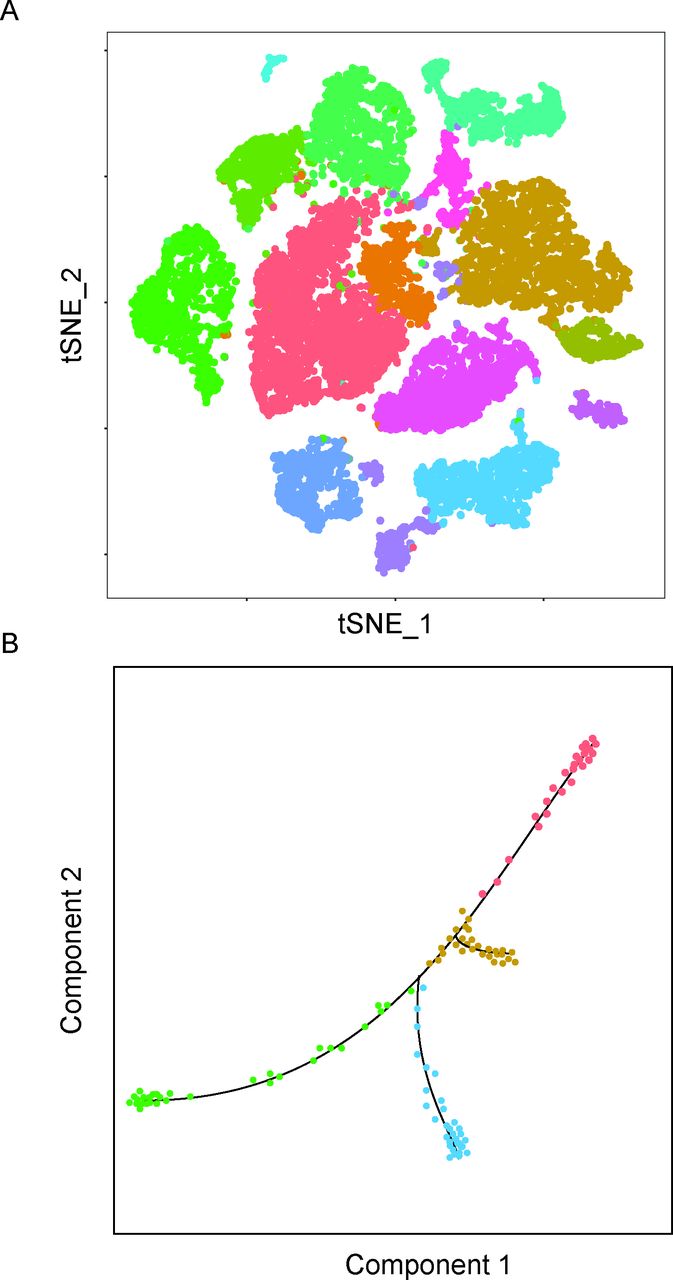
Following the computation of the expression matrix, many different kinds of analyses may be performed which is also an area of active new development. The most prevalent analysis is dimensionality reduction analysis such as principal component analysis and t-Distributed Stochastic Neighbour Embedding11 to visualise clusters of similar cells identified by unsupervised graph-based population identification algorithms (figure 4A). These tools facilitate the detection of novel cell types and subpopulations of cells representing different cell states, such as resting versus proliferating. Pathways of differentiation and cell lineage positioning can be studied by ‘pseudotime’15 analysis integrating computational machine learning approaches (figure 4B).
Representative plots of downstream scRNA-seq analysis. (A) An illustrative tSNE plot, where cells form clusters based on similarities and differences in gene expression. Different colours designate different clusters which differentiate between cell types and cell states. (B) An illustrative pseudotime plot, the line indicating a continuum of hypothetical differentiation from least differentiated (red colour) to several branches of distinct differentiated cell types. scRNA, single-cell RNA sequencing; tSNE, t-Distributed Stochastic Neighbour Embedding.
There are several recognised limitations of scRNA-seq. First, certain cell types sensitive to tissue dissociation may be lost or under-represented and the relative cell counts may not be representative of the original tissue. Second, although gene expression analysis by scRNA-seq provides a very good representation of the expression pattern found by conventional bulk sequencing approaches, application of scRNA-seq shares a limitation present also in the standard method of biopsy analysis, and that is, both methods analyse only a relatively small piece of the whole tissue which may not be sufficiently representative of the entire organ. Third, due to incomplete sampling of cellular gene expression, statistical approaches are required for cell type identification and clustering. Multiple imputation-based software packages have been established to computationally address this issue.16 17 Last, spatial information is not preserved as tissue needs to be dissociated for preparing single-cell suspension. Considering the rapid development of scRNA-seq methods and instruments, specific software platforms were developed for integrative analysis of data generated on diverse platforms.
Clinical implications
This emerging technology is already being applied to gain insight into the pathogenesis and heterogeneity of LN and other organ manifestations of SLE. Transcriptomic evaluation at the single-cell level is poised to identify rare cell populations and evaluate the communication between renal cell types and inflammatory leukocytes and fibroblasts. Although other fields such as cancer biology and neurosciences have already begun to leverage this technology, it has yet to be used extensively within the context of SLE and LN. Several groups, however, have begun characterising healthy and diseased kidney in murine models and humans with LN. These studies provide a single-cell atlases of the kidney, for instance, Brunskill et al used the C1/SMART-Seq platform to characterise renal organogenesis in developing mice and provide a roadmap of renal development.18 More recently, Park et al used the 10X Genomics platform to sequence 57 979 healthy adult mouse kidney cells.19 This undertaking provided a detailed resolution of the cell populations of the mouse kidney and identified novel transition states between cell types and potentially novel populations of collecting duct cells. Specifically evaluating targets reported in GWAS studies of various renal diseases including tubular acidosis and nephrotic syndrome, the authors identified the candidate genes expressed in specific renal cell types indicating a possible cell-type-specific contribution of each disease. Other studies of mouse kidney by scRNA-seq have focused on specific sorted cell types including mesangial cells and collecting duct cells.
In humans, Sivakamasundari et al performed a similar analysis using the 10X Genomics platform, sequencing 22 469 healthy human kidney cells.20 Similar to Park et al, novel cell populations as well as new markers for already established cell types were identified. Analysis of the specific expression of known LN-associated genes, such as NOTCH4, indicated that their expression under healthy conditions is high in endothelial cells, specifically ascending and descending vasa recta. Our group has recently characterised renal and skin biopsies from patients with LN and live organ donors using the Fluidigm C1/SMART-Seq platform.21 Single-cell transcriptomic analysis revealed an interferon response signature that correlated with clinical parameters, including histological features such as glomerular immunoglobulin G deposition and chronicity. Further, a high interferon response signature was associated with poor response to conventional treatment. This finding was validated in a separate cohort using the high throughput Fluidigm platform and we have further identified a fibrotic signature that could predict response to treatment at 6 months postbiopsy.22 The higher throughput and larger patient cohort in this latter study allowed for biopsy class-specific comparisons which revealed several pathways that may contribute to the histological differences in the disease. Another group has used a plate-based CEL-SEQ2 approach on the leukocytes sorted from the kidneys of LN patients and have reported the immune landscape of the kidney. They were able to identify several subsets of immune cells including cells that appear to be T follicular helper regulatory cells.23 This work sets the stage for new discoveries, including an increased understanding of LN pathophysiology that will lead to novel and more targeted therapies. Further, adding precision diagnostics and prognostics will help guide clinical treatment decisions. For example, preliminary data using droplet-based approaches have indicated relatively high variability in terms of the number and type of infiltrating immune cells within the interstitial and glomerular compartments between patients, even in those identified with the same histopathology class (data not shown). If this result is confirmed, such information could drive the choice of B-cell depleting approaches in patients with high numbers of kidney-infiltrating B cells. Similarly, early signs of extracellular matrix expression in tubular cells, even in the absence of other evidence for fibrosis and chronicity, may suggest antifibrotic approaches. Another important clinical application would be a move towards therapy intensification, or at least shorter follow-up intervals, in those patients whose gene expression patterns display negative prognostic indicators. scRNA-seq lays the foundation to usher in an era of precision medicine where it is anticipated that therapies based on renal transcriptomics will increase response rates and guide patient-specific treatment decisions.
Acknowledgments
We would like to thank the Accelerating Medicines Partnership (AMP) network and investigators for their intellectual contribution and work towards advancing single-cell RNAseq in lupus nephritis.
References
Footnotes
Contributors ED, HS, TT and CP prepared and wrote the manuscript.
Funding Funding was provided through grants from the National Institutes of Health (UH2-AR067676, UH2-AR067677, UH2-AR067679, UH2-AR067681, UH2-AR067685, UH2-AR067688, UH2-AR067689, UH2-AR067690, UH2-AR067691, UH2-AR067694, and UM2-AR067678).
Competing interests None declared.
Patient consent for publication Not required.
Provenance and peer review Commissioned; externally peer reviewed.