Article Text

Abstract
Objective To examine the hypothesis that perfusion and functional connectivity disturbances in brain areas implicated in emotional processing are linked to emotion-related symptoms in neuropsychiatric SLE (NPSLE).
Methods Resting-state fMRI (rs-fMRI) was performed and anxiety and/or depression symptoms were assessed in 32 patients with NPSLE and 18 healthy controls (HC). Whole-brain time-shift analysis (TSA) maps, voxel-wise global connectivity (assessed through intrinsic connectivity contrast (ICC)) and within-network connectivity were estimated and submitted to one-sample t-tests. Subgroup differences (high vs low anxiety and high vs low depression symptoms) were assessed using independent-samples t-tests. In the total group, associations between anxiety (controlling for depression) or depression symptoms (controlling for anxiety) and regional TSA or ICC metrics were also assessed.
Results Elevated anxiety symptoms in patients with NPSLE were distinctly associated with relatively faster haemodynamic response (haemodynamic lead) in the right amygdala, relatively lower intrinsic connectivity of orbital dlPFC, and relatively lower bidirectional connectivity between dlPFC and vmPFC combined with relatively higher bidirectional connectivity between ACC and amygdala. Elevated depression symptoms in patients with NPSLE were distinctly associated with haemodynamic lead in vmPFC regions in both hemispheres (lateral and medial orbitofrontal cortex) combined with relatively lower intrinsic connectivity in the right medial orbitofrontal cortex. These measures failed to account for self-rated, milder depression symptoms in the HC group.
Conclusion By using rs-fMRI, altered perfusion dynamics and functional connectivity was found in limbic and prefrontal brain regions in patients with NPSLE with severe anxiety and depression symptoms. Although these changes could not be directly attributed to NPSLE pathology, results offer new insights on the pathophysiological substrate of psychoemotional symptomatology in patients with lupus, which may assist its clinical diagnosis and treatment.
- lupus erythematosus
- systemic
- magnetic resonance imaging
- autoimmune diseases
Data availability statement
Data are available on reasonable request. The computed metrics derived from resting state fMRI recordings will be available on request.
This is an open access article distributed in accordance with the Creative Commons Attribution Non Commercial (CC BY-NC 4.0) license, which permits others to distribute, remix, adapt, build upon this work non-commercially, and license their derivative works on different terms, provided the original work is properly cited, appropriate credit is given, any changes made indicated, and the use is non-commercial. See: http://creativecommons.org/licenses/by-nc/4.0/.
Statistics from Altmetric.com
Key messages
What is already known about this subject?
Anxiety and depression are among the most frequent neuropsychiatric events in neuropsychiatric SLE (NPSLE).
Reduced perfusion in prefrontal white matter is associated with more severe anxiety symptomatology.
What does this study add?
Anxiety and depression severity in NPSLE are associated with haemodynamic and functional connectivity changes of the brain frontolimbic neural circuit.
How might this impact on clinical practice or future developments?
Understanding characteristics of brain function that parallel psychoemotional symptomatology in NPSLE may assist its clinical diagnosis and treatment.
Introduction
SLE commonly affects the central nervous system (CNS). Patients with neuropsychiatric SLE (NPSLE) may present with focal neurologic deficits, or ‘diffuse’ clinical manifestations, including mood disturbances, anxiety disorders or cognitive dysfunction.1 Anxiety and depression are among the most frequent neuropsychiatric (NP) events in NPSLE,2 3 with major impact on patients’ mental health and health-related quality of life.4–7
Histopathological findings suggest that NPSLE is associated with brain lesions, not detectable by conventional brain MRI (cMRI) in over 50% of the cases.8 9 Advanced MRI techniques have largely overcome the limitations of conventional MRI by detecting haemodynamic and functional changes which may correlate with neuropsychiatric manifestations in patients with SLE.10 To this end, patients with primary NPSLE (ie, attributed to SLE) displayed significant hypoperfusion in cerebral white matter that appears normal on cMRI.11 Functional compensatory changes involving enhanced prefrontal activity during performance of challenging working memory tasks has also been reported in these patients.12
Resting-state functional MRI (rs-fMRI) is a noninvasive imaging technique, using blood oxygenation level–dependent (BOLD) signal, that has been widely used to investigate brain function in various CNS diseases, including NPSLE, where altered functional connectivity was shown both within and between several key brain networks.13 Interestingly, rs-fMRI could provide evidence about neural activity and also about cerebral perfusion alterations, by using time-shift analysis, a promising new method that has been used to assess haemodynamics in previous studies.14–18 According to this method, the haemodynamic transfer speed (haemodynamic lag or lead times) is evaluated by using the temporal shift of low-frequency BOLD signal fluctuations of rs-fMRI, and correlates with regional brain perfusion.18
Few studies have used perfusion MRI in SLE with contradictory findings, ranging from non-significant perfusion changes in normal-appearing white matter and normal-appearing grey matter,19–21 to regional hypoperfusion11 22 23 or hyperperfusion20 23 24 in patients with NPSLE or SLE. Even more, research on haemodynamic and functional changes accompanying anxiety and depression symptoms in NPSLE has been limited. Recently, we reported reduced perfusion in prefrontal white matter (serving both dorsolateral and ventromedial prefrontal cortices) associated with more severe anxiety symptomatology in a cohort of patients with NPSLE.25 This observation poses further questions regarding the connection between the putative haemodynamic dysregulation and functional changes, including altered patterns of connectivity of frontolimbic regions in NPSLE. Another question is the extent to which anxiety and depression symptoms have common pathophysiological substrates, both psychosocial and neuronal,26 27 in view of the very strong correlations between scores on self-report scales of anxiety and depression,28 also found in patients with NPSLE.7 29
Tο address these issues, we assessed voxel-level haemodynamic and functional connectivity indices derived from a single technique (rs-fMRI) in patients with NPSLE. For this, we integrated voxel-based estimates of regional haemodynamic transfer speed (haemodynamic lag or lead times from time-shift analysis) as indices of regional brain perfusion, with measures of functional connectivity in all AAL regions where significant subgroup differences were found in independent-samples t-test and in the amygdala, in view of its central role for emotion/depression and anxiety.30–32 Limbic and frontolimbic network connectivity was assessed through voxel-based (using the intrinsic connectivity contrast metric)33 and conventional ROI-based approaches.
The following research questions were explored: (1) Do individual differences in self-reported depression and anxiety symptoms among patients with NPSLE correlate with haemodynamic transfer speed within limbic and prefrontal cortices? (2) Το what extent are associations between indices of brain function and anxiety symptoms dependent on comorbid depression symptoms and vice versa?
Materials and methods
Participants
Patients diagnosed with NPSLE (n=32), who regularly visited the outpatient clinic of the University Hospital of Heraklion, Greece, as part of routine follow-up evaluation, were invited to participate. Expert clinicians (GB, AF, PS, DB) obtained a detailed history from all participants prior to the MRI examination. All patients met the revised ACR 1997 classification criteria for SLE.34 NPSLE diagnosis and attribution was based on physician judgement, following multidisciplinary approach and considering patient age and risk factors for NPSLE (anti-phospholipid antibodies, prior neuropsychiatric manifestation, generalised disease activity (estimated by SLEDAI-2K35), findings of conventional MRI imaging and other diagnostic procedures). Organ damage was assessed by the SLICC/ACR damage index.36 Patients with prior major psychiatric disorder were not considered for the study. Additional inclusion criteria were age over 18 years, ability to speak and read Greek fluently, negative history of thromboembolic cardiovascular disease or other primary CNS diseases. Neuropsychological and emotional status assessments were performed within 3 months of the MRI study, without any alterations in treatment of the patients in the meanwhile (see table 1).
Demographic and clinical characteristics of patients with NPSLE
Comparison rs-fMRI data were available on 18 healthy volunteers (15 women, mean age=42.9, SD 15.1 years) for whom self-reported depression severity ratings were available on the same instrument that was administered to patients with NPSLE (see below). The two groups were comparable on age (p=0.3) and education level (p=0.2), although controls included a higher percentage of men (p=0.01).
MR imaging
Brain MRI examinations were performed on a clinical 1.5T whole-body superconducting imaging system (Vision/Sonata, Siemens/Erlangen), equipped with high-performance gradients (gradient strength: 40 mT/m, slew rate: 200 mT/m/ms) and a two-element circularly polarised head array coil.
Conventional MR imaging protocol consisted of a 3D T1-w MPRAGE (TR/TE: 1570/1.73 ms, 1 mm/1 NEX/160 axial sections), a T2wTSE (TR/TE: 5000/98 ms, 4 mm axial sections) and a Turbo FLAIR (TR/TE/TI: 9000/120/2320 ms, 4 mm axial sections) sequence. Images were interpreted by a senior neuroradiologist (EP), blinded to the clinical and laboratory data, who reported any incidental findings not related to SLE, or findings related to focal SLE-related abnormalities, such as acute or old infarcts, haemorrhages and focal brain atrophy. Patients with any of the aforementioned MRI findings were excluded from the study. Lesion burden of small (<1 cm) white-matter hyperintensities on T2/FLAIR sequences was classified according to their absolute number: grade 0=none, grade 1 (mild)=1–5, grade 2 (moderate)=6–10 or grade 4 (severe) >10.25
Rs-fMRI was derived from a T2*-weighted, fat-saturated 2D-FID-EPI sequence with repetition time (TR) 2300 ms, echo time (TE) 50 ms, field of view (FOV) 192×192×108 (x, y, z). Acquisition voxel size was 3×3×3 mm, and whole brain scans consisted of 36 transverse slices acquired parallel to the plane passing through the anterior and posterior commissures (AC-PC line with 3.0 mm slice thickness and no interslice gap).
fMRI data preprocessing and denoising
Each BOLD time series consisted of 150 dynamic volumes (the first five were ignored in all subsequent analyses to avoid T1 saturation effects). Preprocessing steps included slice-time correction, realignment, segmentation of structural data, normalisation into standard stereotactic Montreal Neurological Institute (MNI) space and spatial smoothing using a Gaussian kernel of 8 mm full-width at half-maximum using SPM8. As functional connectivity is affected by head motion in the scanner,37 we accounted for motion artefact detection and rejection using the artefact detection tool (ART; http://www.nitrc.org/projects/ artefact detect). In terms of signal denoising, grey matter, white matter and cerebrospinal fluid signal (CSF) mean signals were regressed out of all voxel time series in order to mitigate their effects on BOLD time courses. The first five principal components of white matter and CSF regions were regressed out of the signal, as well as their first order derivatives. These steps were completed using CompCor implemented within the CONN preprocessing module and executed in MATLAB. The fMRI time series were detrended and bandpass filtered in the 0.008–0.09 Hz range in order to eliminate low-frequency drift and high-frequency noise. These preprocessing steps were applied to the data used for voxel level intrinsic connectivity contrast (ICC), ROI ICC and functional connectivity measures described later. For time-shift analysis (TSA), only the CSF signal was regressed out of the BOLD fMRI time courses, while all the remaining steps were applied as described earlier. Global grey and white matter signals are not considered noise in the calculation of TSA and thus their influence on the voxel time series was not removed.
Time-shift analysis
Whole-brain voxel-wise TSA maps were calculated, as described in several other studies,14–17 using in house MATLAB scripts. First, a mask of the major venous sinuses was created based on the standard brain. The reference BOLD time series was calculated as the mean of all voxel time series included in the venous mask. Then, voxel-wise cross-correlations were calculated in reference to this regressor for lags of −3 TRs to 3 TRs (or −6.96 s to 6.96 s). This entails the computation of the lagged versions of each voxel time series (−3 TR to +3 TR) and of the correlation coefficient of each lagged version of the time series with the reference signal. The lag value corresponding to the highest correlation coefficient is then assigned to each voxel as its time shift/delay value. A broader range of signal delay (eg, −6 TRs to +6 TRs) was not selected mainly because of the relatively high TR value attainable in the present study. The following metrics were computed for each aal ROI: percentage of voxels displaying haemodynamic lag (as indicated by TSA value >1 TR); percentage of voxels displaying haemodynamic lead (as indicated by TSA value <−1TR); average TSA value across all voxels comprising each ROI.
Voxel-wise functional connectivity
Voxel-wise global connectivity was assessed through the ICC, an estimate of the degree of association between the time series of a given voxel with all the remaining voxels in the brain (in the present study, voxels included in all 90 regions of the AAL atlas) computed as the square root of the mean of each ROI’s squared correlation values with all other ROIs.
ROI-level connectivity
We also computed ROI-to-ROI connectivity estimates between all AAL regions where significant subgroup differences were found in independent-samples t-tests. First, each AAL ROI representative time series was calculated as the mean of all voxel time series within that ROI. ROI-to-ROI functional connectivity estimates were then calculated using the Pearson correlation coefficient for each pair of ROI time series. Negative voxel-level correlations were discarded from the analyses.
Measures of psychoemotional status
Self-reported symptoms of anxiety and depression were recorded using the Greek version of the Hospital Anxiety and Depression Scale (HADS)38 with a widely employed cut-off for clinically significant anxiety or depressive symptomatology of 7/8 points.
Patient and public involvement
Patients or the public were not involved in the design, conduct, reporting or dissemination plans of our research.
Statistical analysis
In the main analyses, we aimed to identify brain regions where individual differences in hemodynamics and functional connectivity appeared to be associated with the severity of anxiety or depression symptoms among patients with NPSLE. In preliminary analyses, we identified regions where significant voxel clusters were found in group-level, one-sample t-tests conducted on whole-brain TSA and ICC maps using SPM12 (at p<0.001 with minimum cluster size of 30 voxels). Group differences (between patients with NPSLE scoring high vs NPSLE scoring low on anxiety and between patients with NPSLE scoring high vs NPSLE scoring low on depression) were further assessed in SPM12 using independent-samples t-tests (evaluated at p<0.001 uncorrected).
Next, significant voxel clusters in independent-samples t-tests were overlaid on the aal atlas to compute region-specific TSA and ICC metrics, respectively (mean TSA, mean ICC, percentage of voxels with TR >1 and percentage of voxels with TR <−1). In addition, pairwise connectivity indices were computed between all aadl ROIs where significant anxiety subgroup differences were found in independent-samples t-tests and separately among the set of aa ROIs where significant depression subgroup differences were found in independent-samples t-tests. These metrics were used to assess the unique associations of TSA, ICC and pairwise connectivity metrics with the severity of anxiety symptoms controlling for comorbid depression symptoms. In separate analyses, we assessed the unique associations of TSA, ICC and pairwise connectivity metrics with the severity of depression symptoms controlling for anxiety symptomatology. These analyses were conducted using partial correlation coefficients in SPSS V.20.
In supplementary, post hoc analyses, we examined whether regional haemodynamic and functional connectivity measures associated with depression symptoms among patients with NPSLE (in correlational analyses and/or independent-samples t-tests comparing high-depression vs low-depression patients with NPSLE) could also account for such symptoms among healthy volunteers (n=18). Given that anxiety self-ratings were not available in the latter group, associations were assessed via zero-order correlations (ie, without controlling for anxiety symptoms) and were restricted to the regions where significant zero-order correlations with depression were found in the total NPSLE group.
Results
Severity of anxiety and depressive symptomatology in patients with NPSLE
In agreement with previous reports,2 3 5 we observed high frequency of significant depression (53.1%) and anxiety (65.6%) symptomatology among enrolled patients with NPSLE using clinically validated cut-off scores (HADS subscale scores ≥8 points). The correlation between HADS anxiety and depression scores was high (r=0.75), while both anxiety and depression symptom severity correlated modestly with disease duration (r=0.34, p=0.024 and r=0.37, p=0.015, respectively).
Haemodynamic and connectivity correlates of anxiety symptoms in NPSLE
The two NPSLE patient subgroups were comparable on age (p=0.5), disease duration (p=0.2), SLEDAI (p=0.2), and SLICC/ACR (p=0.3).
Independent-samples t-tests revealed clusters of voxels displaying greater haemodynamic lag in the subgroup of patients with NPSLE reporting significant anxiety symptoms as compared with those with milder anxiety symptoms in bilateral dLPFC (middle frontal gyrus; BA 46/9) and in the right ACC (ie, the anterior cingulate gyrus minus the subgenual portion; see table 2 and figure 1D). In addition, the former subgroup displayed greater haemodynamic lead in voxel clusters located in the subgenual portion of the ACC (figure 1C), and reduced ICC in the left amygdala and right dlPFC (lateral orbitofrontal cortex ; figure 2C).
Results of paired t-tests comparing two NPSLE patient subgroups according to anxiety symptoms on TSA and ICC values
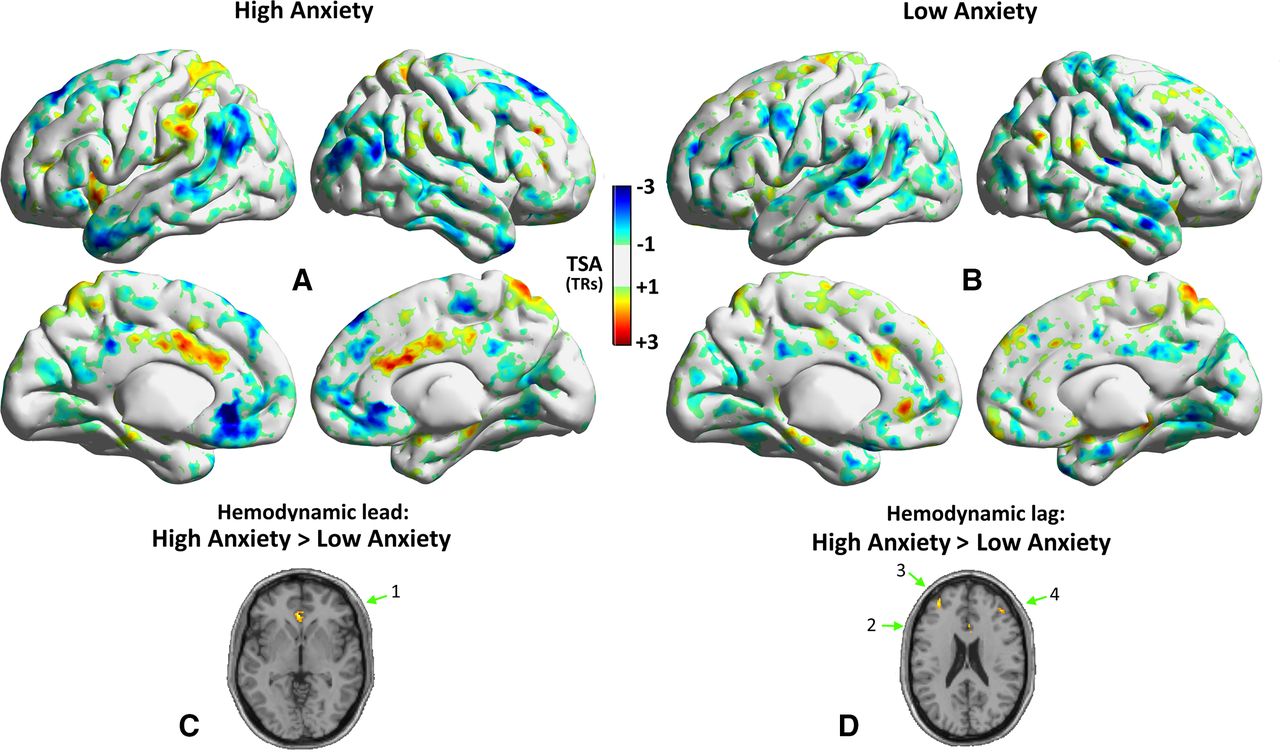
Whole-brain, time shift value maps in the subgroup of patients with NPSLE reporting significant anxiety symptoms (A; n=21) and patients reporting milder symptoms (B; n=11). Maps display voxels with haemodynamic lag (positive TSA values >1 TR) or lead (negative TSA values <−1 TR) within each group. Voxel clusters displaying significantly higher lead (C) or lag (D) in the subgroup of patients with high vs low depression symptoms are shown on appropriate axial views (independent-samples t-tests thresholded at p<0.001 uncorrected). The cluster displayed in (C) is located in the left subgenual ACC (1). Clusters shown in (D) are located in the right ACC (2), left (3) and right dlPFC (BA 46; 4).
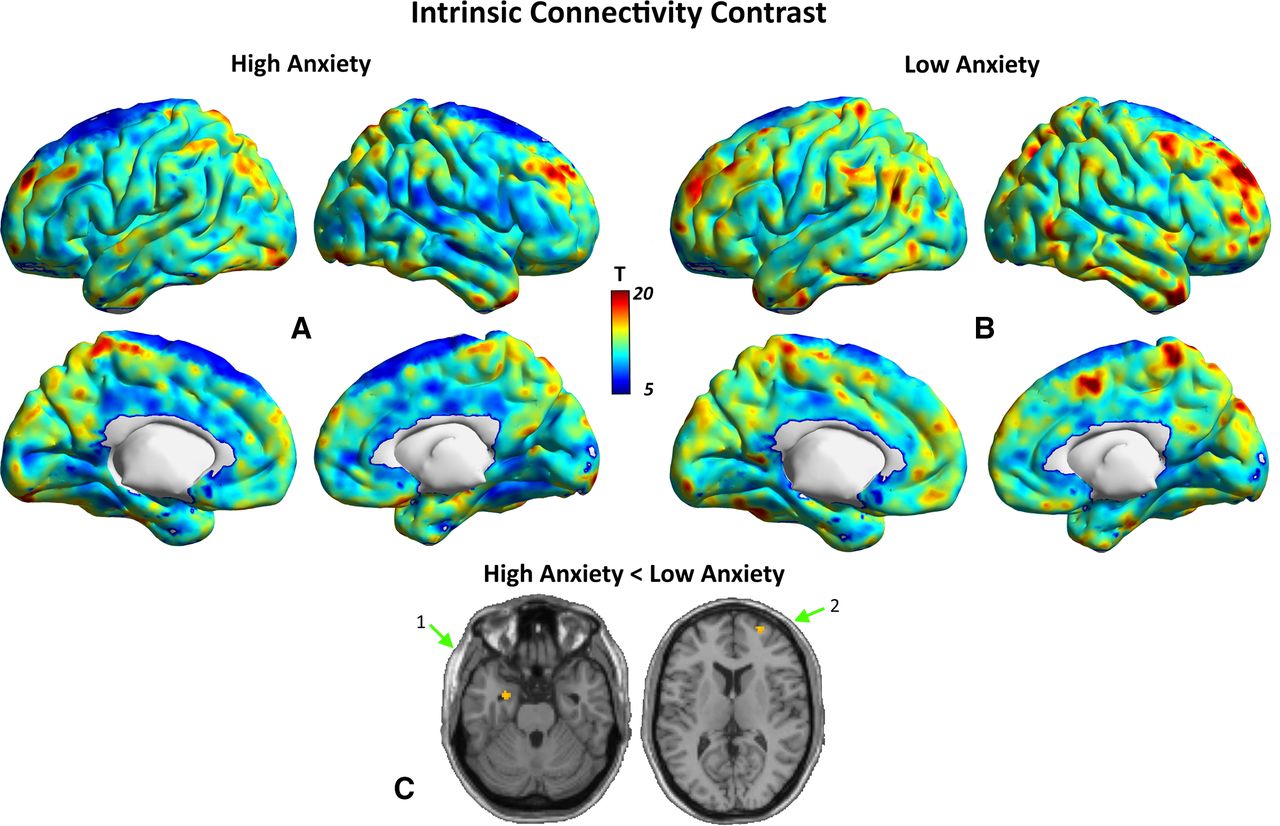
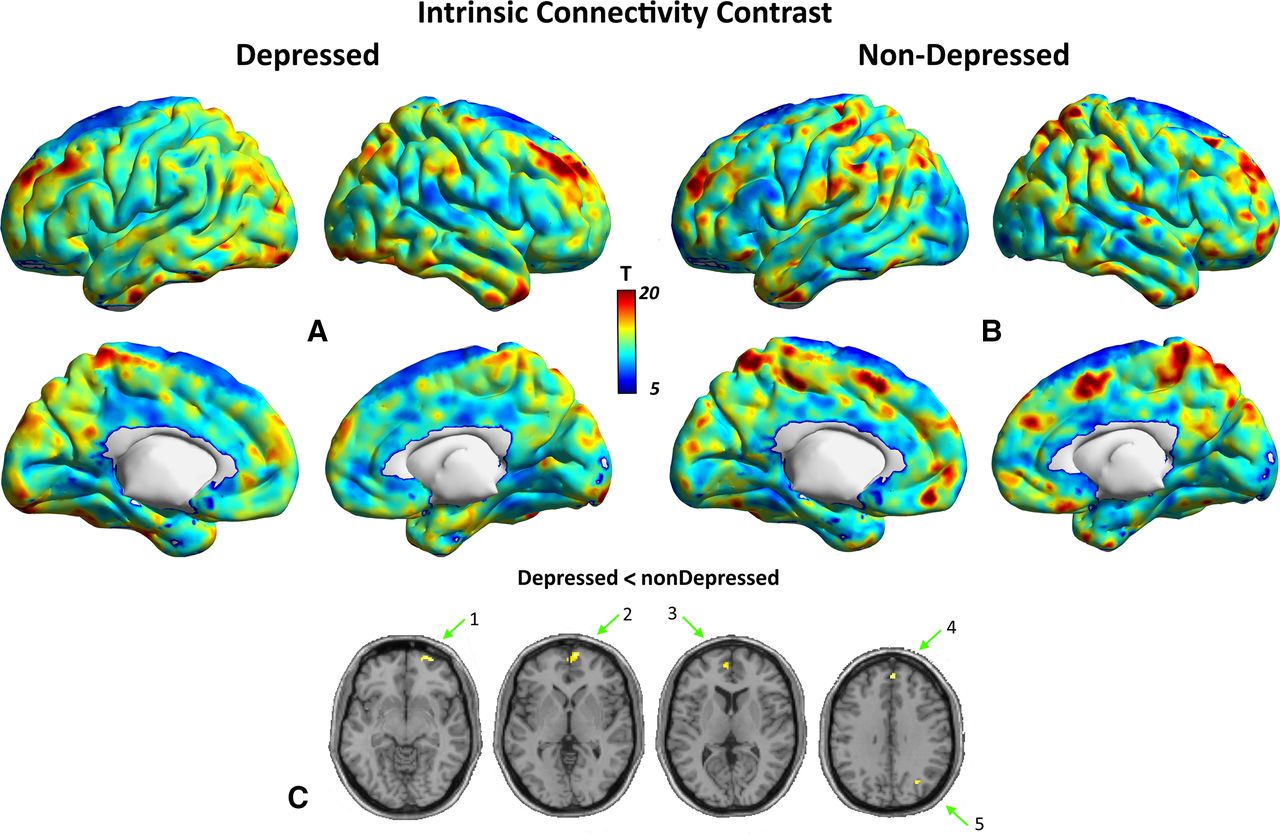
Whole-brain ICC maps in the subgroup of patients with NPSLE reporting significant anxiety symptoms (A; n=21) and patients reporting milder symptoms (B; n=11) displaying voxels with significant ICC values within each group (p<0.001 uncorrected, minimum cluster size=30 voxels). Voxel clusters displaying significantly higher ICC in the subgroup of patients with high vs low anxiety symptoms are shown on appropriate axial views (independent-samples t-tests thresholded at p<0.001 uncorrected). Voxel clusters displaying significantly higher lead in the subgroup of patients with high vs low anxiety symptoms (independent-samples t-tests thresholded at p<0.001 uncorrected; (C) were found in the left amygdala (1) and right lateral orbitofrontal cortex (2).
These findings were refined by correlational analyses assessing the unique associations of TSA and ICC metrics with the severity of anxiety symptoms (HADS Anxiety score) in the total group of patients with NPSLE. Partial correlations were computed for TSA and ICC metrics derived from the six regions listed in table 2 plus the right amygdala (based on extant literature) and evaluated at Bonferroni-adjusted p<0.05/7=0.007. Associations between anxiety and the resulting 21 pairwise ROI-to-ROI connectivity indices were evaluated at p<0.002. These analyses revealed significant unique positive associations of the severity of anxiety symptoms with (a) haemodynamic lead in the right amygdala (percentage of leading voxels; p=0.003; Figure 3A and table 3), (b) relatively lower ICC of the right dlPFC (lateral orbitofrontal cortex; p=0.001; figure 3B), (c) relatively lower connectivity between right dlPFC (middle frontal gyrus) and right vmPFC (medial frontal gyrus; p<0.001; Figure 3C), and (d) relatively higher connectivity between right ACC and right amygdala (p=0.0033; Figure 3D).
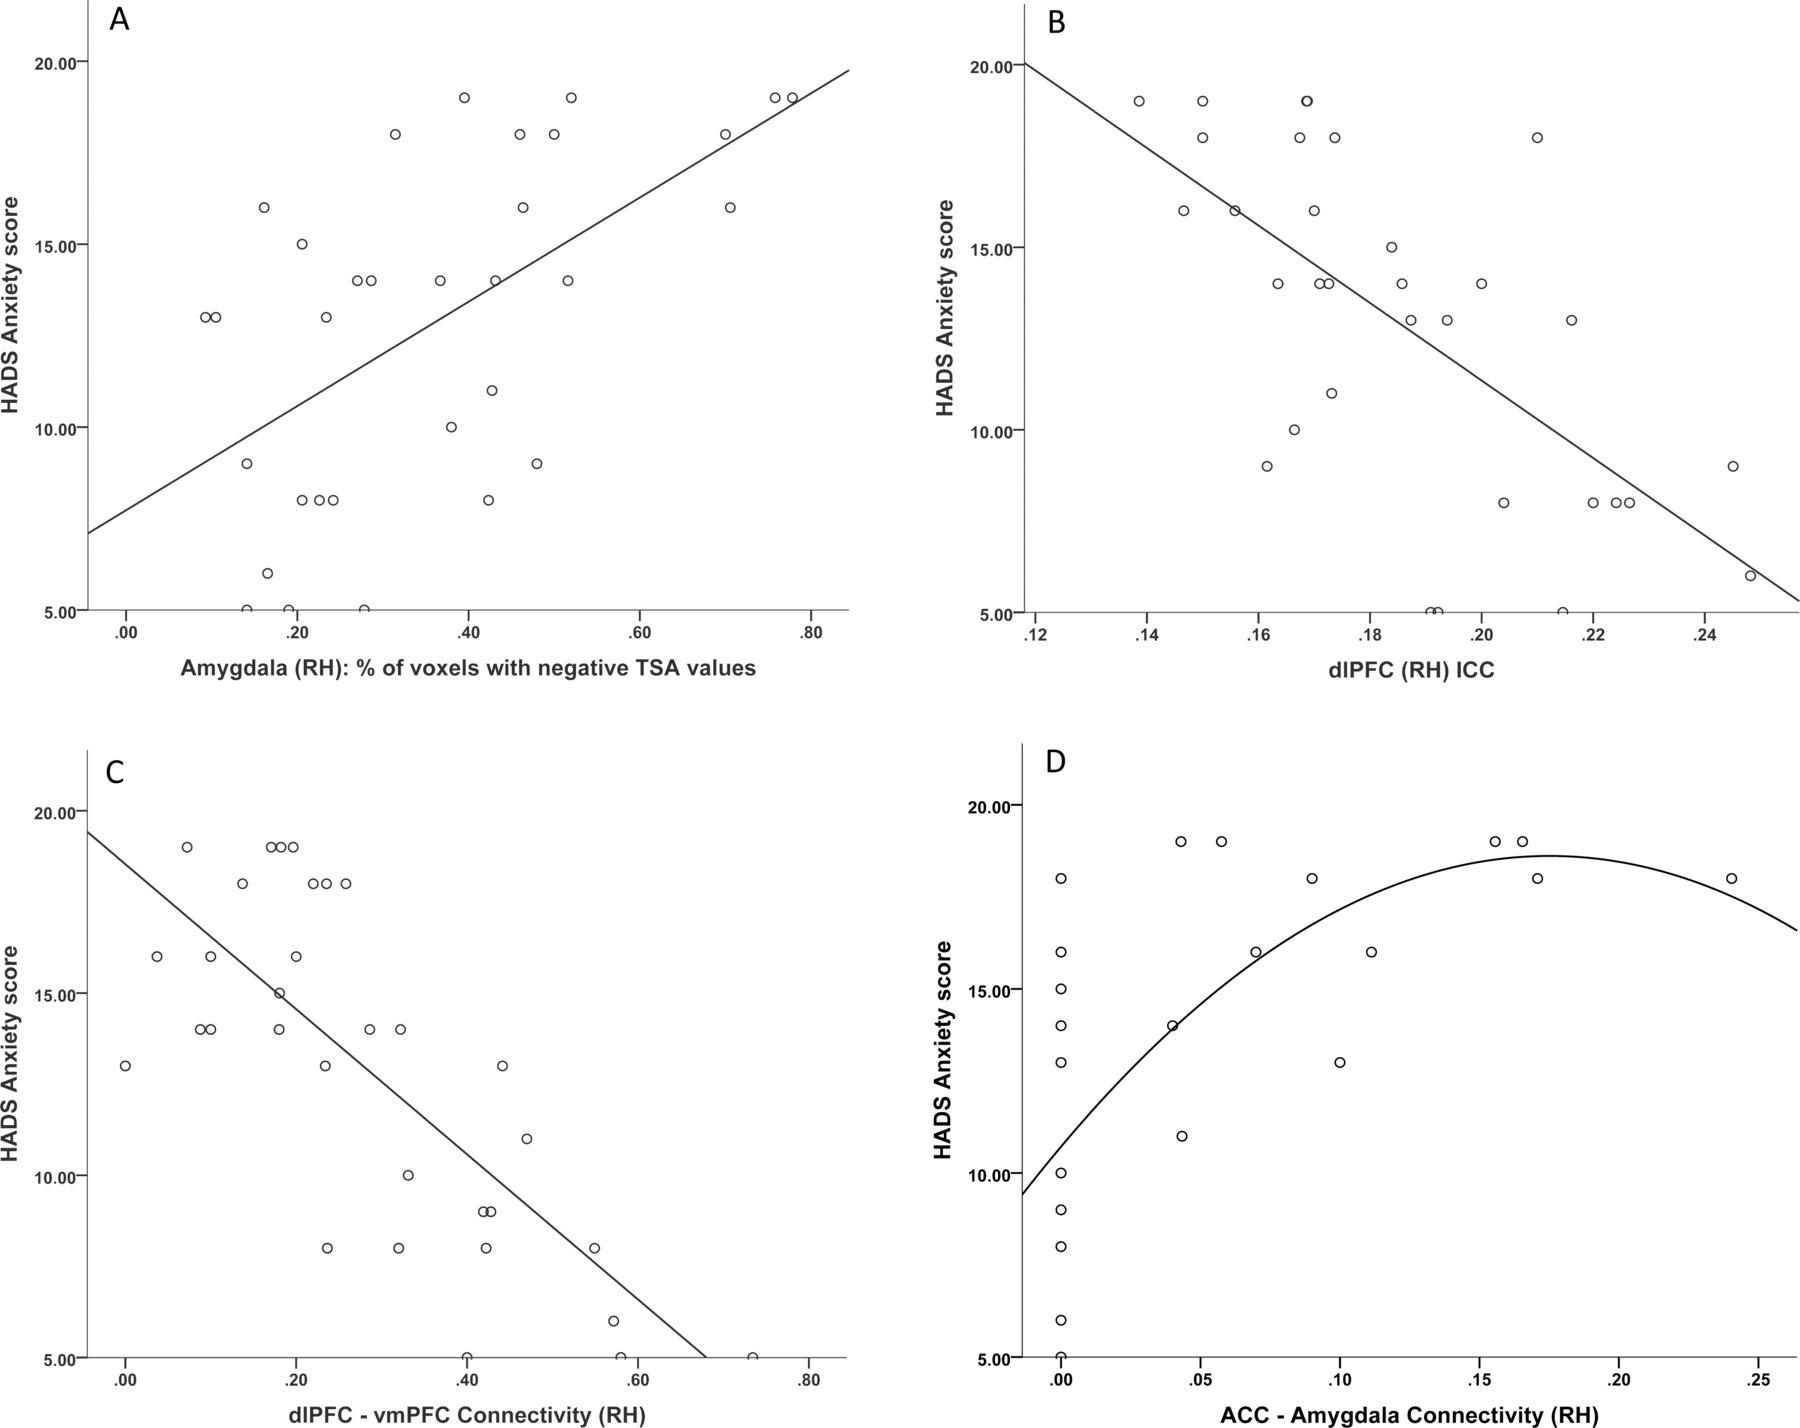
Significant associations of self-reported anxiety symptomatology in patients with NPSLE with (A) haemodynamic lead in the amygdala (linear fit: R2=0.349), (B) average ICC values dlPFC voxels among patients with NPSLE (linear fit: R2=0.428), (C) connectivity strength between dlPFC and vmPFC (linear fit: R2=0.574) and (D) connectivity strength between ACC and amygdala (curvilinear fit: R2=0.428). All regions shown are in the right hemisphere.
Zero-order and partial correlations between emotional, haemodynamic and functional connectivity measured in the total sample of patients with NPSLE
Haemodynamic and connectivity correlates of depression symptoms in NPSLE
The two NPSLE patient subgroups were comparable on disease duration (p=0.1), SLEDAI (p=0.2) and SLICC/ACR (p=0.2), although patients in the high depression subgroup were, on average, older (p=0.02).
Independent-samples t-tests revealed clusters of voxels displaying greater haemodynamic lag in the subgroup of patients with NPSLE reporting significant depression symptoms as compared with those with milder depression symptoms in the left ACC and right precuneus (see table 4 and figure 4D; adjusting for age). In addition, the former subgroup displayed greater haemodynamic lead (figure 4C) combined with reduced ICC in voxel clusters located in the vmPFC (medial frontal and orbitofrontal cortices bilaterally; BA 9, 10, 11; figure 5C).
Results of paired t-tests comparing two NPSLE patient subgroups according to depression symptoms on TSA and ICC values
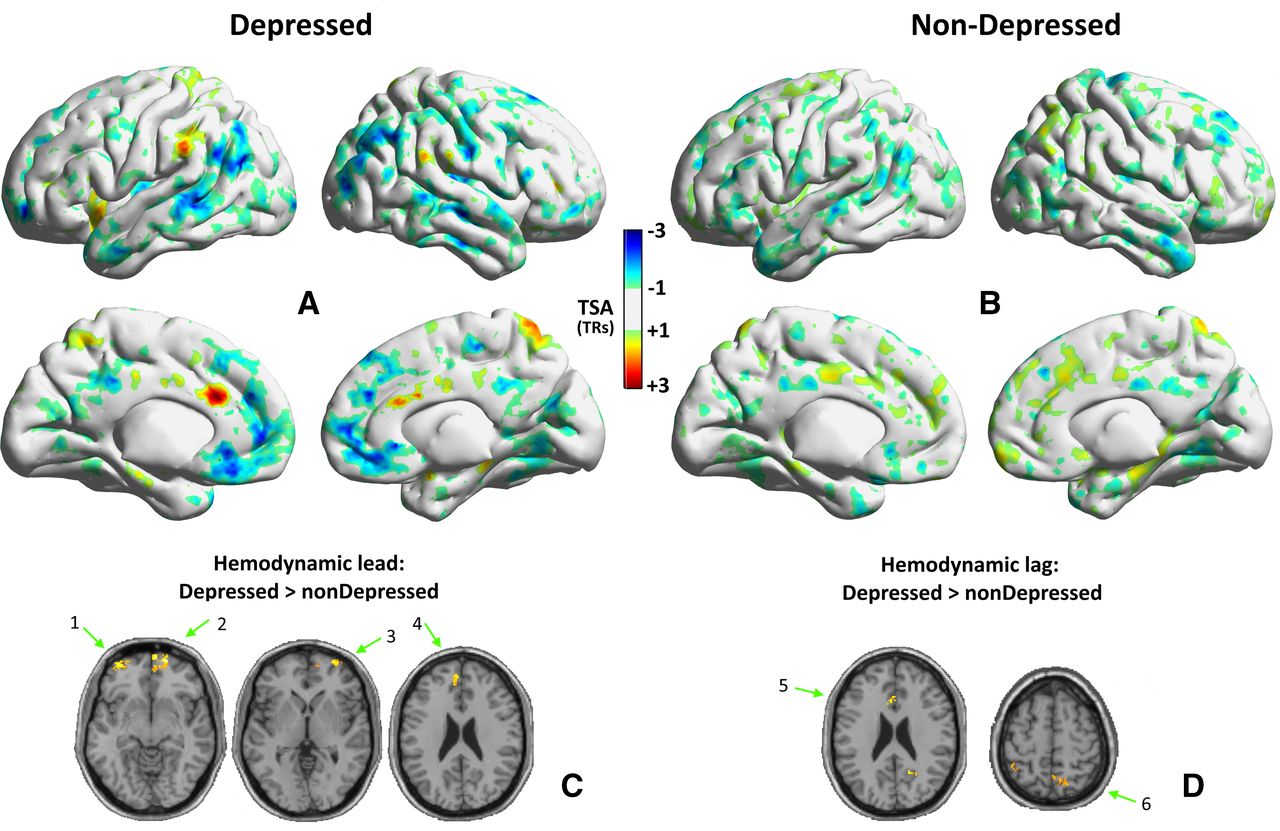
Whole-brain, time-shift value maps in the subgroup of patients with NPSLE reporting significant depression symptoms (A; n=17) and patients reporting milder symptoms (B; n=15). Maps display voxels with haemodynamic lag (positive TSA values >1 TR) or lead (negative TSA values <−1 TR) within each group. Voxel clusters displaying significantly higher lead (C) or lag (D) in the subgroup of patients with high vs low depression symptoms are shown on appropriate axial views (independent-samples t-tests thresholded at p<0.001 uncorrected). Clusters displayed in (C) are located in the left lateral orbitofrontal cortex (1), right medial frontal gyrus (2), right lateral orbitofrontal cortex (3) and left medial frontal gyrus (4). Clusters shown in (D) are located in the left ACC (5) and right precuneus (6).
Whole-brain ICC maps in the subgroup of patients with NPSLE reporting significant depression symptoms (A; n=17) and patients reporting milder symptoms (B; n=15) displaying voxels with significant ICC values within each group (p<0.001 uncorrected, minimum cluster size=30 voxels). Voxel clusters displaying significantly higher ICC in the subgroup of patients with high vs low depression symptoms (independent-samples t-tests thresholded at p<0.001 uncorrected; C) were found in the right lateral orbitofrontal cortex (1), right medial orbitofrontal cortex (2), left medial frontal gyrus (3), right medial frontal gyrus (4) and right angular gyrus (5).
In partial correlations performed on the total group of patients with NPSLE, we assessed unique associations of depression symptoms with TSA, ICC and pairwise connectivity metrics involving the eight regions listed in table 4, plus the amygdala (bilaterally). Coefficients were evaluated at Bonferroni-adjusted p<0.05/10=0.005 (for TSA and ICC metrics) and at p<0.001 (for pairwise ROI-to-ROI connectivity indices). These analyses revealed significant unique positive associations of the depression symptom severity with (a) haemodynamic lead in the two vmPFC regions (percentage of leading voxels in orbitofrontal cortex bilaterally; p=0.0035; online supplemental file 1A and table 3) and (b) relatively lower ICC of the right vmPFC (orbitofrontal cortex; p<0.003; online supplemental file 1B). It should be noted that analyses on ROI-to-ROI connectivity among limbic and prefrontal regions indicated that the positive bivariate association between depressive symptoms and connectivity between the right ACC and amygdala (see table 3) was largely attributed to comorbid anxiety symptoms.
Supplemental material
The aforementioned associations were not mediated by SLE disease activity or organ damage (quantified by the SLEDAI and SLICC/ACR damage index, respectively) on haemodynamic lag/lead and ICC values (|r|<0.2 in all cases). Moreover, presence or number of lesions on conventional MRI did not correlate with any psychoemotional variables (|r|<0.1). Finally, patients with abnormal MRI (n=17) did not vary on anxiety or depression scores from those with normal MRI (n=16; p>0.9).
It should be noted that correlational analyses on average TSA values computed across all voxels within a given aal region did not reveal significant effects.
Haemodynamic and connectivity correlates of depression symptoms in healthy volunteers
Preliminary analyses suggested that adequate variability of HADS depression scores was present in the HC group to warrant correlational analyses with haemodynamic and connectivity indices (range=1–13 points, IQR=4 points). As expected, however, the HC group scores on average lower on HADS depression (mean=5.29, SD 2.73) as compared with the total NPSLE group (mean=10.30, SD 5.61; p<0.001). The HC group comprised 12 persons who scored <8 points on the HADS Depression subscale and 6 participants who had scores indicative of significant depression symptoms (≥8 points).
Pearson correlations were computed between HADS scores and each of the 10 TSA, 10 ICC and 2 ROI-to-ROI connectivity measures listed in the lower half of table 3. Results revealed a non-significant trend involving haemodynamic lead in the right vmPFC (lateral orbitofrontal cortex), which was in the same direction as in the NPSLE group (r=0.324, p=0.04). An additional, marginally significant correlation was found for ICC in the right vmPFC (medial orbitofrontal cortex) which was in the opposite direction as compared with the NPSLE group (ie, positive; r=0.423, p=0.03).
Discussion
Our study provides novel evidence that individual differences in self-reported anxiety and depression symptoms among patients with NPSLE are associated with specific, complex patterns of haemodynamic and functional connectivity changes within limbic and prefrontal brain regions. Anxiety symptom severity was distinctly associated with faster haemodynamic transfer times (ie, haemodynamic lead) in the right amygdala, relatively lower intrinsic connectivity of orbital dlPFC, and relatively lower bidirectional connectivity between dlPFC and vmPFC combined with relatively higher bidirectional connectivity between ACC and amygdala. Conversely, depression symptom severity was specifically associated with haemodynamic lead in the vmPFC regions in both hemispheres (lateral and medial orbitofrontal cortex) combined with relatively lower intrinsic connectivity in the right medial orbitofrontal cortex.
Distinct haemodynamic and functional connectivity correlates of anxiety in NPSLE
The severity of anxiety symptoms in our cohort was specifically associated with faster haemodynamic transfer times within the right amygdala. Previous work on anxiety disorders has highlighted the crucial role of amygdala in anxiety.30 39–41 Experiments using optogenetics in rodents have shown that precisely modulating amygdala circuits can modulate anxiety-related behaviours on demand.30 Increased resting metabolic activity, blood flow and reactivity in response to negative stimuli in the amygdala of patients with anxiety has been proposed to mediate typical anxiety symptoms, such as hypervigilance and biased threat detection.39 40
In addition, anxiety level among patients with NPSLE was associated with relatively lower levels of global connectivity of the lateral orbitofrontal cortex and relatively lower connectivity between the dlPFC and the vmPFC. In accordance, functional disturbances in orbitofrontal cortex have been found to associate with anxiety disorders, and anxiety symptoms have been shown to relate to decreased orbitofrontal cortex volumes in late-life depression.39 42 43 Moreover, disturbed perfusion in the normal-appearing white matter underlying both dorsolateral and ventromedial prefrontal cortices has been shown to be strongly correlated with anxiety symptomatology in patients with NPSLE.25 Both dlPFC and vmPFC are considered as major components of the emotion appraisal and/or emotion regulation networks, in addition to their purported contribution to working memory and top-down control.44–47 The relatively faster perfusion in amygdala and decreased connectivity of dlPFC and vmPFC may reflect an imbalance between emotional reactivity and control among patients with NPSLE who experience severe anxiety.
Finally, relatively higher levels of self-reported anxiety symptoms were distinctly associated with increased functional connectivity between the right ACC and amygdala. The ACC has been often considered as the link between limbic (emotion-related) and prefrontal (cognition/top-down control) circuits, and therefore a crucial component for emotion regulation.48 Particularly, increased ACC–amygdala coupling has been associated with stress-induced attentional bias to emotional stimuli and rest, as well as with the trait anxiety in healthy and anxious participants.49–51 Moreover, developmental studies have indicated that increased ACC–amygdala connectivity is crucially involved in both anxiety and depression symptoms in early adulthood.52 53
Distinct haemodynamic and functional connectivity correlates of depression in NPSLE
The second important finding of the present study is that the association between depression symptoms and relatively faster haemodynamic transfer in the vmPFC (encompassing lateral orbitofrontal regions) bilaterally was shown to be independent of comorbid anxiety symptoms. Moreover, faster haemodynamic transfer within the right vmPFC was paralleled by reduced global connectivity as a correlate of depression symptoms among patients with NPSLE. Directly attributing these findings to the pathophysiology of NPSLE requires direct comparisons with appropriate control groups (comprising non-NPSLE patients with and without significant depression symptoms), which were not possible in the present study. Nevertheless, results from correlational analyses conducted within a group of healthy volunteers may provide some preliminary indications that the association between regional haemodynamics and depression symptoms are stronger among patients with NPSLE. Moreover, whereas depression symptoms were linked to relatively lower connectivity of the right vmPFC in patients with NPSLE, (at least) mild depression symptoms in healthy volunteers were associated with higher connectivity in this region.
Mood disorders have been commonly linked to structural and functional changes in ventromedial and lateral orbitofrontal cortices.54 55 Overall increased vmPFC engagement has been linked to higher trait rumination scores in bipolar patients, while patients with major depressive disorder exhibit decreased positive connectivity between mPFC and nucleus accumbens, increased negative connectivity between mPFC and amygdala, and increased connectivity within orbitofrontal cortex and other regions of the default mode network (ie, subgenual ACC, caudate, hippocampus, inferior parietal lobule, medial prefrontal cortex, middle temporal gyrus and precuneus). Engagement of this network is typically attributed to internally focused attention and self-orientation.56–58 These reports combined with the apparent faster perfusion of vmPFC found in the present study consolidate the notion of distorted within-network selectivity associated with depression symptoms in patients with NPSLE.
Notably, direct associations between depression symptoms and perfusion measures were not apparent in our previous study involving a partially overlapping cohort of patients with NPSLE using the DSC-MRI technique.25 Apparently, haemodynamic indices derived from TSA of rs-fMRI data and DSC-MRI provide complementary measures of cerebral perfusion that differ in many respects. Ιn fact, the image intensity of these two imaging techniques depends on different contrast agents (deoxyhaemoglobin for rs-fMRI and gadolinium for DSC). In DSC-MRI, the injected contrast agent is visible in all vessel types, while arteries and arterioles are almost invisible to BOLD fMRI. Thus, the latter estimates haemodynamic lag or lead times, as compared with the average time series recorded from major venous structures, while much faster blood flow (from arteries and arterioles) is registered by the DSC-MRI method, resulting in undifferentiated time lags.17 Even more, perfusion measurements by DSC-MRI in our previous study relied on expert-placed measurement ROIs within the normal-appearing white matter, while TSA provide voxel-based haemodynamic estimates in both grey and underlying white matter regions.
Study limitations
There are important limitations in this study. First, direct associations between emotional status and brain function were only assessed among patients with NPSLE. Hence, we cannot conclude that the reported associations are specific to the putative brain pathophysiology characteristic of NPSLE or, alternatively, that they reflect the combined direct impact of the disease on brain function and its indirect effects on emotional well-being through the physical burden incurred by lupus. Properly addressing this hypothesis requires direct comparisons of NPSLE patients with lupus patients who do not exhibit haemodynamics and connectivity indices with lupus patients who do not present with neuropsychiatric manifestations (or, at least, without psychiatric manifestations directly attributed to lupus pathology). In the present study, we conducted supplementary analyses on data from a healthy control group demonstrating sufficient variability on HADS depression scores to permit correlational analyses. However, the range of HADS scores and the percentage of healthy participants with scores in the clinically significant range (ie, ≥8 points) was considerably lower than that observed among patients with NPSLE. Therefore, failure to find similar, significant associations between brain function indices and self-reported depression symptom severity in this group does not constitute conclusive evidence of the specificity of our findings for NPSLE.
Moreover, perfusion indices were derived from the analysis of time lags (or leads) in resting-state recordings across brain voxels. These measures of time shift in the phase of low-frequency BOLD oscillations are presumed to reflect haemodynamic transfer lag or lead times and, at least, in part serve as indirect indices of regional brain perfusion.17 18 Indices of haemodynamic lag have been validated in cases of severe acute or chronic brain ischaemia due to large vessel occlusion14 14 16 59 60 or milder widespread haemodynamic deficits in patients with Alzheimer’s disease61 and have been shown to represent hypoperfused tissue. On the contrary, the significance of haemodynamic lead has not been explored systematically. Finally, we did not assess potential dependencies between time-lag indices and functional connectivity measures.
Clinical implications
The findings of this study add to the growing body of evidence regarding correlates of emotional symptoms in patients with NPSLE, which could assist diagnosis and potentially inform interventions. Currently, the diagnosis of NPSLE is complex, often relying on the acumen of experienced physicians.62 In the case of non-focal manifestations such as depression and anxiety, the diagnostic utility of conventional MRI is limited. Our fMRI study offers insights on the distinct brain substrates of anxiety and depression symptomatology in NPSLE, which thus could be monitored to assist clinical diagnostics. Moreover, as identifying brain regions and/or networks associated with psychoemotional resilience and/or psychopathology can lead to more targeted and effective treatments,63 our results might support the development of personalised treatment regimens (pharmacological and/or behavioural) in patients with NPSLE.
Conclusion
In the current study, we showed that anxiety and depression severity in NPSLE are associated with relative changes in haemodynamics and functional connectivity of the brain frontolimbic neural circuit, both estimated by using rs-fMRI. Anxiety symptoms were particularly related to faster perfusion dynamics in the right amygdala, decreased dlPFC intrinsic connectivity, decreased bidirectional connectivity between vmPFC and dlPFC, and relatively higher connectivity between ACC and amygdala. Depression symptoms were more closely linked to relatively faster perfusion dynamics in the vmPFC, bilaterally, paralleled by relatively lower intrinsic connectivity in the right vmPFC. Notably, the correlation between depressive symptoms and ACC–amygdala connectivity could be attributed to the comorbid anxiety. Pending further confirmation, these findings might assist the diagnosis and management of these complex manifestations in NPSLE.
Data availability statement
Data are available on reasonable request. The computed metrics derived from resting state fMRI recordings will be available on request.
Ethics statements
Ethics approval
The University Hospital of Heraklion Ethics Committee approved the study and the procedure was thoroughly explained to all patients and volunteers who signed the written informed consent.
References
Supplementary materials
Supplementary Data
This web only file has been produced by the BMJ Publishing Group from an electronic file supplied by the author(s) and has not been edited for content.
Footnotes
Contributors DA: designed the study, contributed to neuropsychological assessments and wrote the manuscript. NS and EK: processed and analysed the imaging data and wrote the manuscript. GB, AF and PS: recruited and assessed the participants and reviewed the manuscript. DB: reviewed the manuscript. EP: designed the study, wrote and reviewed the manuscript.
Funding The study received funding from the European Research Council (ERC) under the European Union’s Horizon 2020 Research and Innovation programme (grant agreement no 742390) to DB. Additional financial support was provided by the Hellenic Foundation for Research and Innovation (H.F.R.I.) under the “second Call for H.F.R.I. Research Projects to support Post-Doctoral Researchers” (Project Number: 1220) to EK. AF’s contribution to this work has been supported in part by a grant from the Hellenic Society of Rheumatology.
Competing interests None declared.
Provenance and peer review Not commissioned; externally peer reviewed.
Supplemental material This content has been supplied by the author(s). It has not been vetted by BMJ Publishing Group Limited (BMJ) and may not have been peer-reviewed. Any opinions or recommendations discussed are solely those of the author(s) and are not endorsed by BMJ. BMJ disclaims all liability and responsibility arising from any reliance placed on the content. Where the content includes any translated material, BMJ does not warrant the accuracy and reliability of the translations (including but not limited to local regulations, clinical guidelines, terminology, drug names and drug dosages), and is not responsible for any error and/or omissions arising from translation and adaptation or otherwise.