Article Text

Abstract
Objective Lupus nephritis (LN) is an immune complex-mediated glomerular and tubulointerstitial disease in patients with SLE. Prediction of outcomes at the onset of LN diagnosis can guide decisions regarding intensity of monitoring and therapy for treatment success. Currently, no machine learning model of outcomes exists. Several outcomes modelling works have used univariate or linear modelling but were limited by the disease heterogeneity. We hypothesised that a combination of renal pathology results and routine clinical laboratory data could be used to develop and to cross-validate a clinically meaningful machine learning early decision support tool that predicts LN outcomes at approximately 1 year.
Methods To address this hypothesis, patients with LN from a prospective longitudinal registry at the Medical University of South Carolina enrolled between 2003 and 2017 were identified if they had renal biopsies with International Society of Nephrology/Renal Pathology Society pathological classification. Clinical laboratory values at the time of diagnosis and outcome variables at approximately 1 year were recorded. Machine learning models were developed and cross-validated to predict suboptimal response.
Results Five machine learning models predicted suboptimal response status in 10 times cross-validation with receiver operating characteristics area under the curve values >0.78. The most predictive variables were interstitial inflammation, interstitial fibrosis, activity score and chronicity score from renal pathology and urine protein-to-creatinine ratio, white blood cell count and haemoglobin from the clinical laboratories. A web-based tool was created for clinicians to enter these baseline clinical laboratory and histopathology variables to produce a probability score of suboptimal response.
Conclusion Given the heterogeneity of disease presentation in LN, it is important that risk prediction models incorporate several data elements. This report provides for the first time a clinical proof-of-concept tool that uses the five most predictive models and simplifies understanding of them through a web-based application.
- lupus nephritis
- outcome assessment
- health care
- lupus erythematosus
- systemic
Data availability statement
Data are available on reasonable request. Deidentified participant data are available upon reasonable request to the corresponding author at oatesjc@musc.edu upon completion of a data use agreement.
This is an open access article distributed in accordance with the Creative Commons Attribution Non Commercial (CC BY-NC 4.0) license, which permits others to distribute, remix, adapt, build upon this work non-commercially, and license their derivative works on different terms, provided the original work is properly cited, appropriate credit is given, any changes made indicated, and the use is non-commercial. See: http://creativecommons.org/licenses/by-nc/4.0/.
Statistics from Altmetric.com
Key messages
What is already known about this subject?
Individual elements of the International Society of Nephrology/Renal Pathology Society renal histopathological activity and chronicity indices associate with lupus nephritis outcomes; however, individually, each element has poor predictive performance.
What does this study add?
This report demonstrates proof of concept that machine learning techniques, including histopathological and laboratory elements, can account for the heterogeneity of disease in lupus nephritis and provide good prediction of approximately 1 year lupus nephritis suboptimal response in a largely African-American population.
How might this impact on clinical practice or future developments?
The web-based clinical tool accompanying this report can be used by clinicians to initiate discussions with patients and care teams about lupus nephritis care coordination and monitoring; however, it needs to be tested in a prospective fashion to determine if making therapeutic decisions based on the predictions can improve outcomes.
Introduction
Lupus nephritis (LN) is an immune complex-mediated glomerular and tubulointerstitial disease in patients with SLE. Approximately 50% of patients with SLE develop kidney-related complications, including LN, and up to 48% of those with diffuse proliferative disease can progress to end-stage renal disease within 5 years of diagnosis among African-Americans.1 The American College of Rheumatology (ACR) currently recommends changing therapy when patients with LN are deemed non-responders after for 6 months of induction therapy.2 Clinicians use a variety of serum markers, including C3, C4, antidouble stranded DNA (anti-dsDNA) and creatinine, as well as urine protein-to-creatinine ratio and sediment to monitor response to therapy, but response to therapy is not defined in the guidelines.2 While in this 6-month trial of induction therapy, patients who do not respond can develop additional irreversible renal damage. A decision support tool based on machine learning models could be useful in determining the baseline characteristics of patients who are less likely to respond to induction therapy. Currently, no clinically useful machine learning model of 1-year outcomes has been developed. Univariate or linear modelling has not predicted outcomes well in this heterogeneous disease.
We hypothesised that a combination of renal pathology results and routine clinical laboratory data could be used to develop and to cross-validate an early LN decision support tool predictive of suboptimal response at approximately 1 year in LN.
Methods
Patient population
Patient data were derived from the Medical University of South Carolina (MUSC) Core Center for Clinical Research (CCCR) prospective longitudinal cohort. The CCCR database is sponsored by the NIH under the P30 mechanism and is longitudinal registry and biorepository of predominately African-American patients with SLE. Patients selected met at the ACR or SLE International Cooperating Clinics criteria for SLE,3 4 were evaluated by a rheumatology provider at MUSC, and agreed to be enrolled in the cohort. The prospective longitudinal cohort database was created in 2003. Disease criteria and renal biopsy data were largely entered prospectively, but some were added retrospectively through chart review.
Inclusion criteria
Patients were also selected if they had revised International Society of Nephrology/Renal Pathology Society (ISN/RPS) active class I, II, III, IV or V nephritis by histopathology either at initial presentation of LN or with a worsening of LN indicating repeat biopsy between 2003 and 2017.5 Only patients with complete laboratory data available at time of renal biopsy and approximately 12 months (7–24 months) after renal biopsy were included in the study.
Laboratory analysis
Laboratory values were obtained as part of standard patient care. Tests for 24-hour urine protein, protein-to-creatinine ratio, serum creatinine, albumin, haemoglobin, white blood cell count, platelet count, anti-dsDNA, C3 and C4 were performed by Clinical Laboratory Improvement Amendments-certified central laboratories at MUSC, LabCorp or external hospital laboratories. The estimated glomerular filtration rate (eGFR) was determined by using the Chronic Kidney Disease Epidemiology Collaboration (CKD-EPI) equation.6
Pathology analysis
Renal biopsies were read by one of two renal pathologists at MUSC (SES or ETB) using the 2018 revised ISN/RPS activity (0–24) and chronicity (0–12) index elements (each scored 0–3 for 0%, <25%, 25%–50% and >50% involvement).5 Included in the activity index are endocapillary hypercellularity, karyorrhexis, fibrinoid necrosis, hyaline deposits, cellular or fibrocellular crescents and interstitial inflammation. Scores were doubled for crescents and necrosis. Included in the chronicity index were total glomerulosclerosis score, fibrous crescents, tubular atrophy and interstitial fibrosis.
Data handling
Data for the CCCR database were directly adjudicated into the REDCap database using the Data Transfer Service7 to eliminate transcription error. Some laboratory values were extracted by chart review of the electronic medical record and scanned lab reports and were entered manually into the database. Five per cent double entry of abstracted data was performed to ensure transcription error was <5%. Pathology reports were manually abstracted and entered into the registry if not already present.
Statistical analysis
The outcome variable was the failure to completely respond to therapy at approximately 1 year. This time point was chosen, as variables of response at 1 year are predictive of long-term response years in the MAINTAIN and Euro-Lupus Nephritis Trials.8 Response was defined by a modification of the ACR response criteria.9 The modifications to these criteria were described previously by Wofsy et al.10 Briefly, this modified complete response includes attaining a urine protein-to-creatinine ratio of <0.5 at approximately 1 year and achieving an eGFR of 90 or an improvement of at least 15% from baseline. The suboptimal response outcome was defined by lack of achieving complete response as defined above. Thus, the outcome includes non-responders and partial responders. Variables collected in the data included patient sex, age at time of biopsy, proliferative disease (ISN/RPS classes III or IV, Y/N), mesangial disease (ISN/RPS class I or II, Y/N), membranous disease (ISN/RPS class V, Y/N), activity score (0–3), chronicity score (0–3), interstitial fibrosis (0–3), interstitial inflammation (0–3), number of glomeruli evaluated, crescents (number), crescent-to-glomeruli ratio (0–3×2), necrosis (0–3×2), urine protein-to-creatinine ratio, eGFR by the CKD-EPI formula (eGFR, mL/min/1.73 m²),6 serum creatinine (mg/dL), dsDNA (IU), C3 (mg/dL), C4 (mg/dL), white blood cells count (k/µL), platelet count (k/µL), haemoglobin (g/dL), serum albumin (mg/dL), prednisone (Y/N), hydroxychloroquine (Y/N), mycophenolate mofetil/mycophenolic acid (Y/N), cyclophosphamide (Y/N), rituximab (Y/N), azathioprine (Y/N) and number of medications. Since the data were retrospective and not prospectively randomised, immunosuppressants used for induction are subject to bias by indication and were not considered predictive. They were excluded from consideration during model development for clinical use, as their presence might imply that choice of induction therapy based in the modelling might affect the outcomes. Descriptive statistics were calculated for all participant characteristics by treatment response category. Univariate associations between all baseline characteristics and treatment response were evaluated using a series of logistic regression models.
The goal for this study was to identify a parsimonious subset of predictors from patient demographics and baseline laboratory and biopsy data that yielded good prediction performance characteristics for a set of multivariable prediction models of suboptimal response at approximately 1 year. Multivariable classification models considered in this study included logistic regression (LR), classification and regression trees (CART), random forest (RF), support vector machines with linear, polynomial and Gaussian kernels (SVML, SVMP and SVMR, respectively), naïve Bayes (NB) and artificial neural networks (ANN). RF models were fit using the ‘randomForest’ package; LR models were fit using the ‘stats‘ packages; SVMs and NB models were fit using the ‘e1071’ package; ANNs models were fit using the ‘nnet’ available in R.11 12 Tuning parameters for the different models considered were selected before developing the models. An initial exhaustive search of all combinations of up to 20 variables was considered. However, the results from this search found the best average performance occurred when models included eight variables (online supplemental figure 2). Thus, variable selection was conducted using an exhaustive examination of all subsets of eight or fewer predictors. This threshold number was considered for all modelling approaches to make the models more useful in a busy clinical setting. Specifically, prediction performance for each model’s subset of predictors was conducted using a 10-fold cross-validation (CV) approach. Ten-fold CV divides the data into 10 subsets. Models are trained using 9/10 of the data and tested on the remaining 1/10 of the data, and this is repeated for each subset. The cross-validated area under the curve (cvAUC) is the average AUC calculated for each subset of 1/10 of the data excluded during model development and has been shown to be more robust than use of a single training-test set approach.13 The goal was to identify a small subset of predictors with good prediction performance across the models.14 Prediction performance was measured by 10-fold cvAUC and the best subset of eight variables was selected as the subset that resulted in the highest average cvAUC across all models. Sensitivity, specificity, positive predictive value and negative predictive values were determined for select thresholds for the predicted probability of non-response returned by each model. All analyses were conducted in R V.4.0.2. An R-Shiny, web-based tool was created based on the resulting models that were selected.
Supplemental material
Results
Within the registry, 149 patients had renal biopsy information available between 2003 and 2017. Of these, 83 patients with LN had baseline and approximately 1-year follow-up renal response data between 7.5 and 24 months (online supplemental figure 1). Three with follow-up <7 months and four with follow-up >2 years were excluded. Approximately half of the participants were classified as subtoptimal responders at 1 year. Participant characteristics by treatment response are reported in table 1.
Supplemental material
Baseline characteristics by response status at approximately 1 year
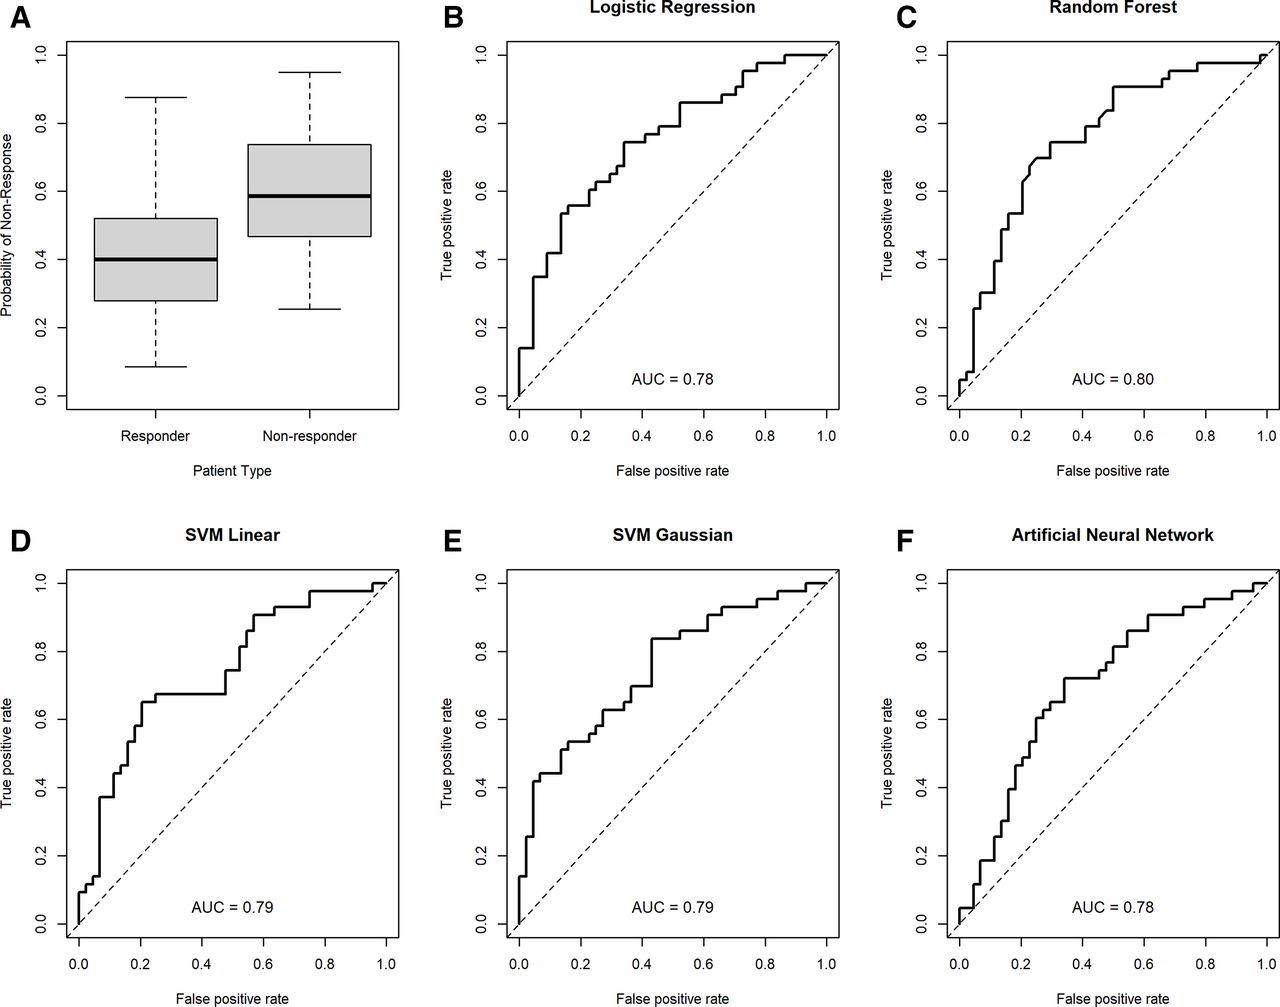
The subset of eight or fewer predictors yielding the best prediction performance across the different models included activity, chronicity, interstitial fibrosis and interstitial inflammation scores and baseline laboratory values for urine protein-to-creatinine ratio, white blood cell count and haemoglobin. The univariate cvAUCs for these seven variables are shown in table 2. The cvAUCs for the best models selected for each modelling approach range from 0.62 to 0.80 with the random forest model yielding the best cvAUC. Five of the eight models considered had a cvAUC >0.75 and included the LR, RF, SVML, SVMR and the ANN models. Table 3 shows the cvAUCs and predictors subset for the five models with high cvAUC. Table 4 shows the sensitivity and specificity of each model and based on the average prediction across all five models at three thresholds each. Interstitial inflammation was the most consistent predictor and was included in all five models. Activity score and interstitial fibrosis were also relatively consistent and were included in all but the RF model. The receiver operating characteristics (ROC) curves based on the 10-fold CV prediction from each of the five selected models is shown in Figure 1. Figure 2 depicts the performance (sensitivity and specificity) of the mean of all the models based on the prediction threshold chosen. The CART, SVMP and NB models all had cvAUCs <0.7 and were excluded from further consideration.
Univariate cvAUC for the subset of seven predictors selected for inclusion in the models
Prediction performance and variables selected for each model for the five models with a cvAUC >0.75
Sensitivity, specificity, positive predictive value (PPV), and negative predictive value (NPV) for different cut-offs for probability of non-response at 1 year based on the predicted probability of non-response for each model and the average predicted probability across the five models
Using the seven most consistent variables, a web-based application was created with R shiny to serve as a clinical tool and can be found here: (https://histologyapp.shinyapps.io/LN_histology_prediction_tool/). In the application, an example of patient’s data is displayed by default. To evaluate a new patient, users can enter histology and clinical laboratory values obtained at the time of biopsy. The resulting graph depicts, as coloured dots, the predicted probability of non-response of each model at a threshold of 0.5. The size of each dot reflects the ROC AUC in the validation set. The box plots on the overview page represent the median (line), IQR (box) and the 25th and 75th percentile±1.5 times the IQR (whiskers) of probability scores for suboptimal response in individual patients in the responder and non-responder groups in the validation sets (also depicted in figure 2A). Each coloured dot represents a single model prediction of the patient viewed in context of the performance of the model in the validation set. The black ‘X’ represents the mean predicted probability of non-response of all five models.

Cross-validation area under the curve (cvAUCs) for each of the final machine-learning models. A summary of probability scores from all models in responders and non-responders (A); cvAUCs depicted for logistic regression (B), random forest, (C) SVM linear, (D) SVM Gaussian (E) and artificial neural network (F) models.

Mean model sensitivity and specificity based on chosen prediction threshold. The mean of all model predictions was used to determine the performance of the model at select thresholds. The sensitivity (black line) and specificity (grey line) are depicted on the y-axis for each threshold (reported on the x-axis).
Discussion
Our study determined that machine learning can be used to develop cross-validated models with good prediction of suboptimal response to therapy in patients with LN, predominantly of African descent. These models were developed using readily available clinical laboratory and histopathological elements at the time of diagnosis. The utility of individual histopathological features to predict outcomes in diffuse proliferative lupus nephritis is well described. Previous work has demonstrated the predictive strength of composite activity index score in progression to renal failure, with individual histological features of activity such as cellular crescents and fibrinoid necrosis showing positive associations with renal failure.15 The composite of chronicity index as well as individual features such as interstitial fibrosis, glomerular sclerosis and fibrous crescents were also predictive, with tubular atrophic change determined to be of particularly high predictive value with respect to progression to renal failure.15 The addition of clinical data elements, particularly serum creatinine, haematocrit and race to histological features improved prediction in subsequent work, while other studies showed at use of stand-alone activity or chronicity indices was insufficient in predicting response.16–19 Recent machine learning approaches have used multilinear regression and random forest modelling to predict of pathological classification, activity and chronicity from clinical laboratory values and have shown promise.20 This study expands on this approach by using pathological variables to predict a outcome at approximately 1 year.
As demonstrated in previous studies, the addition of novel biomarkers obtained at time of diagnosis can be used to develop a robust model to predict the 1-year outcome.21 However, no measures of these novel biomarkers are in clinical use. In this study, readily available histological and clinical laboratory values were used to predict LN outcomes with an ROC AUC of >0.75 in five models. This study is unique in that individual activity and chronicity score elements were used in machine learning models. This is supported by prior literature describing their use individually.15
The results of this prediction modelling should be interpreted in the proper clinical context. The presence of high interstitial fibrosis with a low activity score is likely indicative chronic injury for which immunosuppression would be used to prevent further worsening rather than to restore renal function. However, those with high activity scores might be approached with combination immunosuppressive therapies or monitored for addition of second-line therapies sooner to improve or preserve renal function. Given that these data were retrospective, we do not know whether using the predictions to guide decisions on induction therapy will change outcomes. As is often the case in managing patients with autoimmune disease, it would not be appropriate for a clinician to make decisions about choice of therapy based on this prediction score without consideration of the clinical context. However, a prediction of non-response could be used to change the frequency of monitoring for response and care coordination to ensure medication adherence. It could also be considered in decisions to add on or change therapy for lack of response at earlier time points than the recommended 6 months according to the ACR guidelines.
This study has several limitations. The information used to model outcomes came mostly from patients of African descent. Therefore, use in clinical practice may be limited to this demographic. While the longitudinal data in this study were collected prospectively, the analysis was retrospective. While thrombotic microangiopathy has been associated with outcomes in prior studies,22 the number of biopsies with this finding (five) limited its significance in the models. The decision aid presented here has not been used prospectively to determine if altering treatment strategy based on prediction scores improves outcomes. It has not been evaluated in the prediction of long-term outcomes and should therefore not be used to predict > 1-year outcomes. However, 1-year outcomes have been associated with long-term outcomes in the MAINTAIN and Euro-Lupus Nephritis Trials.8 Selection of patients for inclusion in this study could bias outcomes. For instance, those with more rapidly progressive renal disease are more likely to receive a biopsy. Those with baseline and approximately 1-year follow-up available in the medical record may be biased to more favourable outcomes. We could not rigorously study the effect of medications on outcomes, as most patients received mycophenolate or mycophenolic acid.
Given the heterogeneity of disease presentation in LN, it is important that risk prediction models incorporate several data elements. This report provides for the first time a clinical tool that uses the five most predictive models and simplifies understanding of them through a web-based application. With the prediction models proposed here, we present a proof of concept for a tool that can inform both the frequency of monitoring and facilitate discussions with patients about choice of therapy. More closely monitoring or deploying care coordination for those who are predicted to have a suboptimal response to therapy has the potential to improve outcomes but should be tested prospectively.
Data availability statement
Data are available on reasonable request. Deidentified participant data are available upon reasonable request to the corresponding author at oatesjc@musc.edu upon completion of a data use agreement.
Ethics statements
Patient consent for publication
Ethics approval
Approved by the Medical University of South Carolina institutional review board. Reference ID: Pro00060748.
Acknowledgments
We would like the thank the lupus volunteers in our longitudinal registry, who made this work possible.
References
Supplementary materials
Supplementary Data
This web only file has been produced by the BMJ Publishing Group from an electronic file supplied by the author(s) and has not been edited for content.
Footnotes
Contributors LNH: data collection, authorship. DJD: authorship. BW: data analysis, authorship—equal co-authorship to DJD. LPP: data collection, planning, editorial review. SES and ETB: data collection, planning, editorial review. EEO: web tool creation, data analysis, editorial review. JCO: planning, data collection, authorship.
Funding JCO: R01 AR045476—role of reactive intermediates in lupus nephritis. JCO, BW: P60 AR062755—NIAMS MCRC for Rheumatic Diseases in African Americans. JCO, BW: P30 AR072582—NIAMS Improving Minority Health in Rheumatic Diseases. JCO: R01 AR071947—predictive biomarkers for disease activity and organ damage in patients with lupus nephritis. JCO, BW: UL1 RR029882—South Carolina Clinical & Translational Research (SCTR) Institute. JCO, BW: UL1 TR001450—SCTR Institute. JCO: K08 AR002193—role of nitric oxide and eicosanoids in lupus nephritis. JCO: I01 CX000218—urine biomarkers of lupus nephritis pathology and response to therapy.
Competing interests None declared.
Provenance and peer review Not commissioned; externally peer reviewed.
Supplemental material This content has been supplied by the author(s). It has not been vetted by BMJ Publishing Group Limited (BMJ) and may not have been peer-reviewed. Any opinions or recommendations discussed are solely those of the author(s) and are not endorsed by BMJ. BMJ disclaims all liability and responsibility arising from any reliance placed on the content. Where the content includes any translated material, BMJ does not warrant the accuracy and reliability of the translations (including but not limited to local regulations, clinical guidelines, terminology, drug names and drug dosages), and is not responsible for any error and/or omissions arising from translation and adaptation or otherwise.