Article Text

Abstract
Objective To evaluate frequency, severity and costs of flares in US patients with newly diagnosed SLE.
Methods Adults diagnosed with SLE between January 2005 and December 2014 were identified from US commercial claims data linked to electronic medical records. Disease and flare severity during 1 year after diagnosis were classified as mild, moderate or severe using a claims-based algorithm. Study outcomes included frequency and severity of flares stratified by disease severity during the 1-year post-diagnosis period and all-cause healthcare costs of flares by severity at 30, 60 and 90 days after flare.
Results Among 2227 patients, 26.3%, 51.0% and 22.7% had mild, moderate and severe SLE, respectively. The overall annual flare rate was 3.5 and increased with disease severity: 2.2, 3.7 and 4.2, respectively, for mild, moderate and severe SLE (p<0.0001). Patients with severe SLE had a higher annual severe flare rate (0.6) compared with moderate (0.1) or mild SLE (0; p<0.0001). Mean total all-cause costs at 30, 60 and 90 days after flare were $16 856, $22 252 and $27 468, respectively, for severe flares (mild flares: $1672, $2639 and $3312; moderate flares: $3831, $6225, $8582; (p<0.0001, all time points)). Inpatient costs were the primary driver of the increased cost of severe flares.
Conclusions Flare frequency and severity in newly diagnosed patients with SLE increase with disease severity. After a flare, healthcare costs increase over the following 90 days by disease severity. Preventing flares or reducing flare rates and duration may improve outcomes and reduce healthcare costs.
- lupus erythematosus
- systemic
- autoimmune diseases
- glucocorticoids
- cost of illness
This is an open access article distributed in accordance with the Creative Commons Attribution Non Commercial (CC BY-NC 4.0) license, which permits others to distribute, remix, adapt, build upon this work non-commercially, and license their derivative works on different terms, provided the original work is properly cited, appropriate credit is given, any changes made indicated, and the use is non-commercial. See: http://creativecommons.org/licenses/by-nc/4.0/.
Statistics from Altmetric.com
Key messages
What is already known about this subject?
Over a 1-year period, approximately 70% of patients with SLE experience ≥1 flare. Severe disease is associated with higher frequency of flares and increased medical costs.
What does this study add?
This study used administrative commercial claims data linked to electronic medical records to evaluate flare frequency, severity and costs 30, 60 and 90 days post-SLE flare in US patients with newly diagnosed SLE.
In the year after diagnosis, 95% of patients with SLE experience ≥1 flare and 67% experience ≥3 flares, with an average of 36.4 days from diagnosis to first SLE flare. Patients with moderate and severe SLE have a higher frequency of flares and experience a shorter time to the first SLE flare.
The mean healthcare costs associated with flares continue to increase after 30 days through 90 days after a flare, with the largest healthcare costs associated with severe flares and inpatient care.
How might this impact on clinical practice or future developments?
The high frequency of flares and short time to first flares experienced during the first year after diagnosis may be in part related to delays in establishing a diagnosis and initiating appropriate medical treatment. Earlier diagnosis and treatment may prevent the occurrence of flares, or reduce the rate and duration of flares, with potential to improve health outcomes and reduce SLE healthcare costs.
Introduction
SLE is a chronic autoimmune disease characterised by episodes of increased disease activity, referred to as flares.1 A total of 65%–70% of patients experience at least one flare each year.2 Patients with severe SLE experience higher frequencies of severe flares and flares of any severity, compared with patients with mild SLE.3–5 While the occurrence of any flare increases healthcare costs, severe flares incur the greatest cost.3 6–8 Compared with patients without SLE, annualised direct SLE medical costs are $914, $4305 and $18 952 higher for patients with mild, moderate and severe SLE, respectively.6 Even among patients with SLE who experienced no flares, annualised direct costs are $441 higher compared with patients without SLE.6 Because there is no curative therapy for SLE, a key treatment goal is to prevent or reduce frequency and severity of disease flares, with the aim of preventing or slowing disease progression.1
There are limited data on the real-world burden of SLE flares and healthcare costs following a flare and how they may be affected by flare severity. To understand the clinical burden of SLE flares in a US cohort of patients with newly diagnosed SLE and to obtain a comprehensive picture of the patient population, we used administrative commercial claims data linked to electronic medical records (EMRs). We evaluated flare frequency and annualised rates of mild, moderate, and severe flares by disease severity during 1 year after SLE diagnosis. We also evaluated the economic burden of SLE flares by estimating healthcare costs associated with flares at 30, 60 and 90 days after a mild, moderate or severe flare.
Patients and methods
Data sources
This retrospective cohort study used data from the IBM MarketScan commercial database linked to the General Electric Centricity EMR (GE EMR) database from January 2004 to December 2015. The IBM MarketScan commercial database includes fully integrated and de-identified patient-level healthcare claims data from large employers, health plans, and government and public organisations and includes private sector health data from approximately 350 payers, and >20 billion service records. The GE EMR database contains patient-level clinical data, including demographics, insurance information, and International Classification of Diseases, Ninth Revision (ICD-9) and ICD-10 medical diagnoses from >38 million patients across the USA.
The study dataset was constructed using a patented and proprietary encryption algorithm developed by IQVIA to link patient data from the IBM MarketScan and GE EMR.9–11 Patient data were de-identified across data suppliers using the encryption algorithm, followed by deterministic matching based on patient-level information. Each patient was then assigned a unique and persistent IQVIA patient ID with linkage across various databases.
Study design and patient selection
Eligible patients from the linked IBM MarketScan and GE EMR dataset were adults ≥18 years old with evidence of newly diagnosed SLE from 1 January 2005 to 31 December 2014 (selection window). The first observed SLE diagnosis during the selection window was characterised as the index date. A confirmed SLE diagnosis was defined as having ≥1 inpatient SLE diagnosis or ≥2 outpatient SLE diagnosis codes (including index diagnosis) that were ≥60 days apart (ICD-9-CM: 710.0x, ICD-10-CM: M32.9) in EMR records or claims in any position; and record of prescribed SLE-related medications within 6 months before and after the index date. Patients were further required to have continuous enrolment in a health plan for at least 12 months before index (baseline period) and 12 months after index (post-diagnosis or follow-up period). Patients with an SLE or lupus nephritis diagnosis during the 12 months prior to index and patients with incomplete or missing data in the linked dataset were excluded.
Figure 1 provides details of the study design, inclusion and exclusion criteria, and attrition of the study population.

(A) Study design and (B) attrition of the identified study population of US patients with newly diagnosed SLE between January 2005 and December 2014. The study population included patients ≥18 years old with evidence of SLE. Application of the inclusion and exclusion criteria and categorisation into groups based on SLE disease severity over the 1-year period after diagnosis.
Study measures
SLE disease severity
SLE disease severity was classified as mild, moderate or severe based on the highest severity experienced during the 1-year post-diagnosis period using a claims-based algorithm,3 supplemented with EMR data for diagnoses and procedures/visits. The criteria used in this algorithm included SLE-related conditions, medications and health service use (online supplemental table S1).3
Supplemental material
SLE flare severity
Flares occurring 1 year post-diagnosis were classified as mild, moderate or severe using a claims-based algorithm supplemented with EMR data (online supplemental table S2).3 This algorithm combined the Lupus Foundation of America Second International Lupus Flare Conference categorisation,12 consensus of expert clinical opinion, and additional criteria including inpatient stays and emergency department visits, supported by a qualifying SLE diagnosis or SLE-related condition. Rules for the type and timing of health services use, use of different classes of medication, and change in severity from the previous level were applied to the algorithm to identify a unique flare episode, including start and end date assignment (online supplemental table S2).
For SLE disease and flare severity classifications, the claims-based algorithms relied on data captured from claims in the linked dataset, such as medications (filled), and inpatient or outpatient visits with an associated diagnosis. EMR data (diagnosis/procedures/medications (prescribed)) were used as a complement to claims data when the relevant information was missing in the claim.
Baseline demographics and clinical characteristics
Demographic and clinical characteristics were assessed during the baseline period for all patients with newly diagnosed SLE by disease severity. Characteristics assessed include age, sex, race/ethnicity, geographical region, health plan type, payer type and medication use. Comorbidities during the baseline period were assessed by the Charlson Comorbidity Index (CCI) score; proportion of patients with 0, 1, 2 and ≥3 CCI comorbidities; and the presence of individual CCI comorbidities (diabetes mellitus, cerebrovascular accident, liver disease, any malignancy, peripheral vascular disease, congestive heart failure and myocardial infarction).
Outcome measures
Study outcomes during the 1-year post-diagnosis period were evaluated by SLE disease severity, including annualised flare rates, overall and by flare severity, and the proportion of patients with 0, 1, 2 and ≥3 flares. We estimated the time to first flare of any severity for all patients and by SLE disease severity.
The mean prescribed prednisone equivalent dose (PED, mg/day) of corticosteroids was calculated at 30, 60 and 90 days after SLE flare during the 1-year post-diagnosis period by flare severity. The cumulative PED was defined as the total dose a patient received from the first corticosteroid prescription through the last prescription during the defined follow-up period. The mean daily PED was defined as the cumulative dose divided by the total number of days supplied during the defined follow-up period, beginning with the first day corticosteroids were supplied. Online supplemental table S3 provides PED dose conversions for various corticosteroids.
Unadjusted all-cause healthcare costs per flare (2017 US$) were estimated at 30, 60 and 90 days after flare, for all flares and by flare severity. Flare costs were reported as total healthcare cost and by care setting (inpatient, emergency department, outpatient, office, laboratory and pharmacy). Outpatient services included all non-pharmacy claims not categorised as inpatient, emergency department, office or laboratory services. Costs were computed as the total payments received by providers, including payments made by payers and patients, such as co-pay or co-insurance, converted to 2017 US$ using the medical component of the Consumer Price Index.
Statistical analyses
Categorical variables were described as counts or proportions, and Pearson’s Χ2 test or F-test was used to examine unadjusted between-group differences. Continuous variables were described as mean (SD) and/or median (minimum (min), maximum (max); IQR) using analysis of variance (ANOVA) or t-test to examine unadjusted differences between groups. As all groups examined had large sample sizes (>400), it was assumed that the data met the conditions required for ANOVA testing (normality, homoscedasticity and no multicollinearity), despite the skew of outcomes. Statistical tests were two-sided with an α level of 0.05 for statistical significance. Statistical analyses were performed using SAS V.9.4 (SAS Institute).
Patient and public involvement
Patients and the public were not involved in the research process, research questions, study design or result dissemination plans.
Results
Baseline demographics and clinical characteristics
Among 15 940 patients identified with ≥1 SLE diagnosis in EMR records or claims between January 2005 and December 2014, 2227 were included in analysis. We categorised 586 patients (26.3%) as having mild SLE; 1135 (51.0%), moderate SLE; and 506 (22.7%), severe SLE (figure 1B). Table 1 summarises baseline demographics and clinical characteristics. The mean (SD) patient age was 50.2 (13.0) years, with 56.2% of patients aged 45–64 years. Most patients were female (90.6%), 54.4% were non-Hispanic white, 58.5% were in the South region of the USA and 87.7% were covered by commercial insurance. The proportion of patients with three or more CCI comorbidities increased with disease severity (6.1%, 13.8% and 26.5% for patients with mild, moderate and severe SLE, respectively). Higher proportions of individual comorbidities, including diabetes mellitus, cerebrovascular accident, liver disease, peripheral vascular disease, congestive heart failure and myocardial infarction, were also observed in patients with moderate and severe SLE (all p<0.001 for differences between all groups).
Baseline demographic and clinical characteristics* of adult patients identified with newly diagnosed SLE between January 2005 and December 2014 from US commercial claims data, for all patients and by SLE disease severity
SLE flare frequency during 1 year after diagnosis
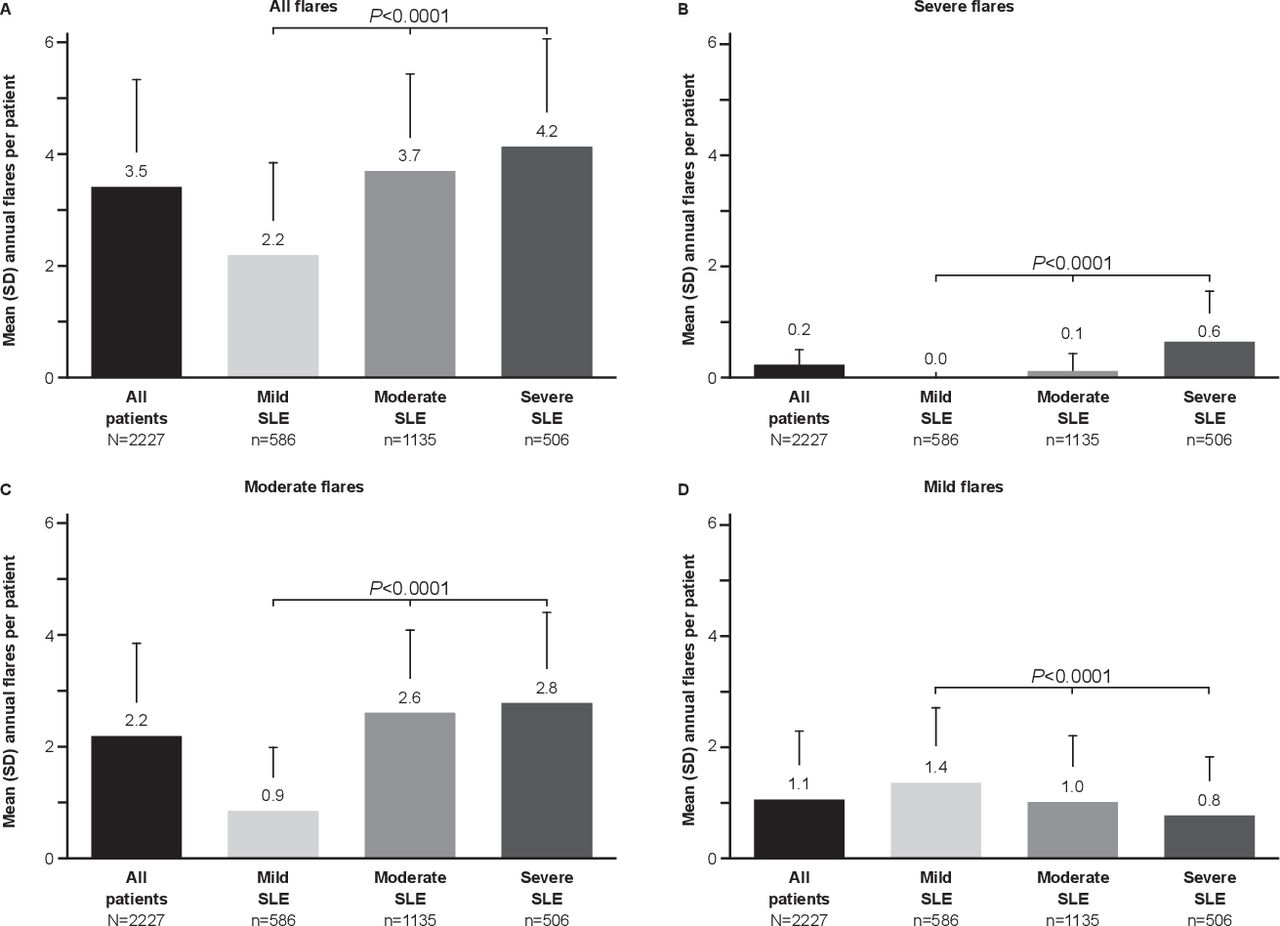
The mean (SD) annual flare rate was 3.5 (1.9) for all patients. Patients with severe and moderate SLE experienced significantly more flares post-diagnosis compared with patients who had mild SLE. Mean (SD) annual flare rates were 4.2 (1.9) for severe SLE, 3.7 (1.7) for moderate SLE and 2.2 (1.6) for mild SLE, p<0.0001 (figure 2A). Severe flares were observed more frequently among patients with severe SLE than among patients with moderate or mild SLE (figure 2B, p<0.0001). Moderate flares occurred more frequently among patients with severe and moderate SLE than among patients mild SLE (p<0.0001) (figure 2C). Mild flares occurred more frequently in patients with mild SLE than among patients who had moderate or severe SLE (p<0.0001) (figure 2D).

Mean annual number of flares per patient during the 1-year post-diagnosis period, for all patients with newly diagnosed SLE and by SLE disease severity. (A) Mean annual number of flares of any severity, (B) of severe flares, (C) of moderate flares and (D) of mild flares. P values are for differences between the three disease severity groups.
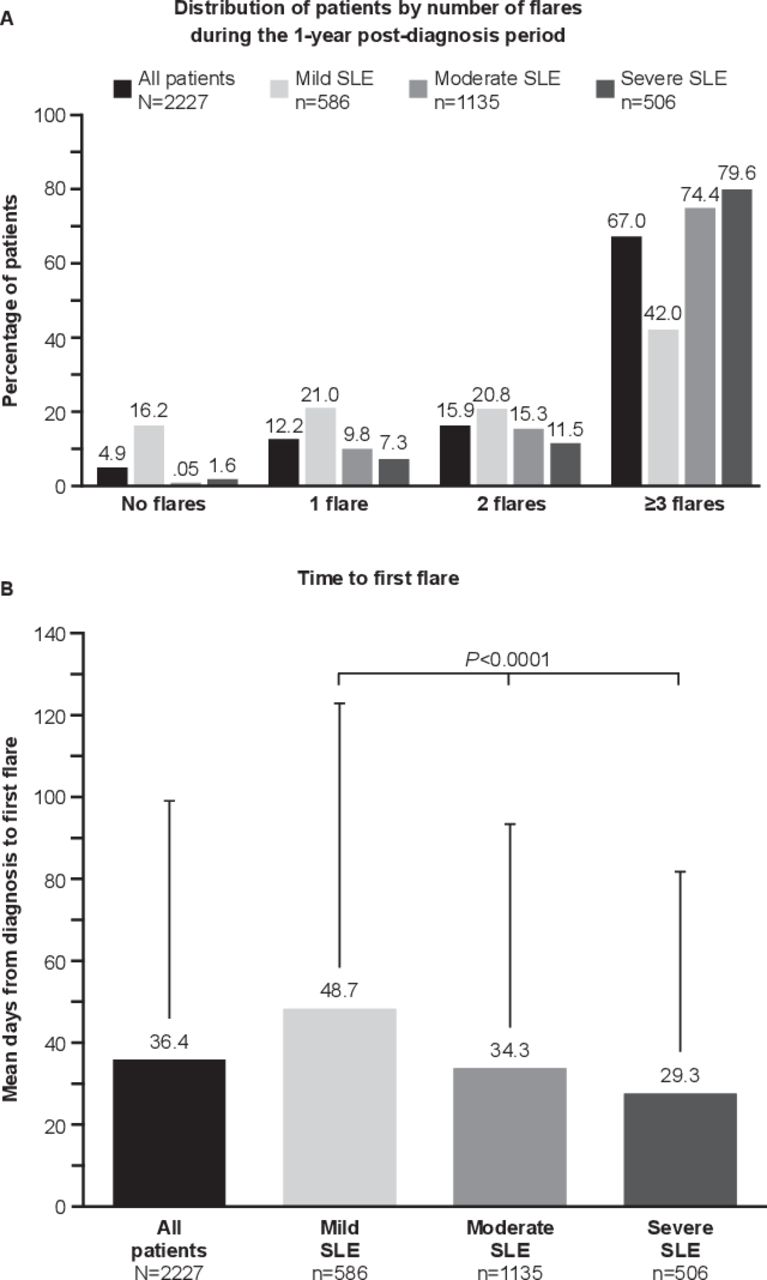
The majority (95.1%) of patients experienced ≥1 flare post-diagnosis. Nearly all patients with moderate and severe SLE had ≥1 flare (99.5% and 98.4%, respectively), compared with those who had mild SLE (83.8%, p<0.0001). A total of 79.6% of patients with severe SLE and 74.4% with moderate SLE experienced ≥3 flares compared with 42.0% with mild SLE (p<0.0001) (figure 3A). Overall, mean (SD) time to first flare was 36.4 (62.7) days, with a median (min, max) time to first flare of 11 (1, 365) days. Mean (SD) time to first flare decreased with increasing disease severity: mild, 48.7 days; moderate, 34.3 days; and severe, 29.3 days (p<0.0001; figure 3B), as did median time (min, max) to first flare: mild, 18 (1, 363) days; moderate, 9 (1, 365) days; and severe, 7.5 days (1, 344).

Distribution of patients by number of flares and time to first flare during the 1-year post-diagnosis period for all patients with newly diagnosed SLE and by SLE disease severity. (A) Distribution of patients with SLE with 0, 1, 2, or ≥3 flares, and (B) mean time from index date to first flare. P value is for difference between the three disease severity groups.
Daily PED of corticosteroids following an SLE flare during 1 year after diagnosis
The mean (SD) daily PED following a flare was 24.5 (90.4) mg/day for all flares (online supplemental figure 1). The mean daily PED increased with increasing flare severity. At 30 days following a flare, the mean (SD) daily PED per flare was 2.9 (12.0) mg/day for a mild flare, 12.1 (23.7) mg/day for a moderate flare and 76.3 (235.4) mg/day for a severe flare (p<0.0001) (online supplemental figure 1). Patients experiencing severe flares were prescribed higher corticosteroid dosages, which were sustained through days 30, 60 and 90 after a flare; mean (SD) daily PED was 76.3 (235.4) mg/day, 71.4 (224.2) mg/day and 71.6 (224.6) mg/day, respectively (online supplemental figure 1).
All-cause costs per SLE flare during 1 year after diagnosis, by flare severity
The all-cause costs at 30 days after flare were $1672, $3831 and $16 856 for mild, moderate and severe flares, respectively (figure 4). Average all-cause flare costs increased from 30 to 90 days after flare (costs 90 days after flare; mild: $3312, moderate: $8582, severe: $27 468). Severe flares incurred the highest cost at each time point compared with moderate and mild flares (p<0.0001 for all time points) (online supplemental tables S4 and S5, figure 4). Across 30, 60 and 90 days after a flare, the main cost driver for severe flares was inpatient stay (72.3%, 63.0% and 56.5% of costs, respectively), followed by outpatient visits (17.3%, 23.2% and 27.7%, respectively) (online supplemental table S4, figure 4). The main cost drivers for moderate flares were also outpatient visits (38.0%, 40.5% and 41.0% of costs), followed by inpatient stay (26.0%, 23.8% and 23.8%, at 30, 60 and 90 days, respectively), while mild flare costs were mainly driven by outpatient visits (40.8%, 43.0% and 42.7% of costs, respectively) and pharmacy costs (26.1%, 25.3% and 25.6%, respectively) (online supplemental table S4, figure 4).

Costs per flare for patients with newly diagnosed SLE who had a flare during the 1-year post-diagnosis period at 30, 60, and 90 days after flare by flare severity and setting of care. P<0.0001 for differences between groups for all settings at all time points. A detailed breakdown of costs per care setting is available in online supplemental tables S4 and S5.
Discussion
This study of newly diagnosed patients with SLE in the USA identified a mean annual flare rate of 3.5 in the year following diagnosis, and an average of 36.4 days from diagnosis to first SLE flare. Patients with moderate and severe SLE had flare rates that were 1.7-fold and 1.9-fold higher, respectively, than those with mild SLE. Patients with moderate and severe SLE had a 1.4-fold and 1.6-fold shorter time to first SLE flare, respectively, than patients with mild disease. Our findings show the increasing mean healthcare costs of flares by 30 days through 90 days after a flare, with the largest healthcare costs attributable to severe flares occurring at 90 days. These findings highlight greater clinical and medical cost burden experienced by patients with moderate and severe SLE.
The annualised flare rates by disease severity observed in our study (2.2, 3.7 and 4.2 for patients with mild, moderate and severe SLE, respectively) are similar to those reported by Garris et al,3 who also used a claims-based algorithm in a similar study population. We further evaluated annualised flare rates by flare severity and found that rates of severe flare increased with increasing disease severity. Although our findings are slightly higher, similar trends were reported in a US Medicaid study population with a longer follow-up period,13 and may be a reflection of disease control over time.
Corticosteroids are the mainstay therapy used to manage SLE flares, supplementary to maintenance treatment.14 We observed frequent use of high-dose corticosteroids for moderate and severe flares sustained through 90 days post-flare. Prolonged corticosteroid use is associated with an increased risk of adverse effects and organ damage.15 16 Additionally, increased SLE disease activity and SLE flares are associated with organ damage accrual,17 18 with attendant high healthcare cost and increased mortality risk.19–22 In line with the treat-to-target initiative in SLE,23 any corticosteroid-sparing treatment to prevent flares may also reduce disease progression and associated healthcare costs.
In our study, 95% of newly diagnosed patients with SLE experienced ≥1 flare in the year after diagnosis, with 67% experiencing ≥3 flares. This finding could be due to delays between initial disease manifestation, diagnosis and initiation of appropriate medical therapy. Flare rates identified in this study are higher than previous estimates,2 possibly owing to different flare definitions or improved capacity to detect flares through our integration of both EMR and claims data. Data on flare rates in newly diagnosed patients with SLE are sparse; however, in a recent US commercial claims study, patients who were diagnosed earlier (<6 vs ≥6 months from symptom onset to diagnosis) experienced lower flare rates, healthcare utilisation and costs.24 Reducing disease activity, preventing flares and minimising drug toxicities are key treatment goals for patients with SLE that aim to improve patient outcomes and quality of life, and prevent organ damage.25 26 Our results highlight that pursuit of these treatment goals should begin early after diagnosis.
Our analyses demonstrated significant healthcare cost increases up to 90 days post-SLE flare. Healthcare costs were 10.1-fold higher for severe flares and 4.4-fold higher for moderate flares compared with mild flares. Previous studies have shown associations between flare severity and cost at 30 days and 1 year after flare3 6 13; however, all-cause healthcare costs per flare over the 30–90 days post-diagnosis have not been previously reported. Our evaluation of costs across multiple care settings identified that outpatient and inpatient stays account for 64%–90% of costs associated with moderate and severe flares at 30, 60 and 90 days after flare. The leading cost driver of severe flares in the year after diagnosis was inpatient visits, which accounted for 57%–72% of costs. This is consistent with a Canadian cohort study that also found 58% of all-cause medical costs during the year after SLE diagnosis were from hospitalisations.27 High healthcare costs in the first year after diagnosis may be the result of flares that require inpatient stay.
This study identified that 58.5% of patients with newly diagnosed SLE were from the South region of the USA, consistent with a study of 47 states and Washington, DC, that reported the highest SLE prevalence in the South (163.5 per 100 000) and the lowest in the Northeast (125.2 per 100 000) USA.28 Regional differences may reflect different patient demographics across regions, or the potential role of sunlight/ultraviolet light radiation exposure in the pathogenesis of SLE disease activity.29
There are some limitations to our findings. Most patients in the database were covered by commercial insurance (87.7%), with 12.3% covered by an employer-provided Medicare supplemental plan and did not include patients covered by Medicaid. However, by linking claims to EMR data, we captured a comprehensive view of SLE treatment and costs associated with flares. Since SLE disease and flare severity were classified using claims-based algorithms, there is potential for misclassification. Additionally, while the ability of the algorithm to define severity and calculate costs may be strengthened by using patient-level data (ie, inpatient stays), this may also introduce bias. Although we supplemented the algorithm with EMR data to improve its accuracy, occurrence and frequency of SLE flares may be potentially overestimated or underestimated. For example, we considered one flare to have ended when a flare of increased severity began, regardless of the interval between the two flares; this may overestimate flare counts. On the other hand, if the next flare was of lower severity and within 30 days, it was assumed to be a continuation of the same initial flare, potentially leading to underestimation of flare counts. Moreover, multiple inputs of the same code do not necessarily indicate multiple flares, as physicians use the same codes for patients who are in remission but are being monitored. However, given the similarities between our findings and those that have been previously published, we are confident in our application of the claims-based algorithms to the present study. Our study design intended to identify patients with incident SLE within the preceding year. The study population may have included prevalent SLE cases without a healthcare encounter or newly insured during the prior year. Furthermore, patients with lupus nephritis diagnoses pre-index were excluded and may have had higher healthcare costs than those with SLE.30 Cost estimates may also have been inflated because only patients who were receiving SLE medications were included in the analysis, meaning that some cases of mild SLE were probably excluded; however, this population is likely to be small and our exclusion criteria increased the specificity of our findings.
Strengths of our study include the use of the IBM MarketScan commercial claims database, which contains comprehensive healthcare resource utilisation data on real-world encounters of patients with SLE, including details on care settings and pharmacy claims. Data linkage with the GE EMR database allowed deeper evaluation of demographic and clinical information, such as race/ethnicity, diagnoses and written prescriptions. Together these data sources provided a comprehensive view of the study population that is not possible with use of a claims database alone because the data sources complemented and supported each other if patient data were missing within a single source. The data used in this work support a more detailed analysis of SLE flare costs than has been previously reported in studies using single data sources.3 4 13 31 Our work assessed healthcare costs at multiple time points during the interval after a flare, which has not been previously reported in patients with newly diagnosed SLE.
In conclusion, this retrospective cohort study of real-world patients with newly diagnosed SLE demonstrates that flare frequency and severity increase with disease severity in the first year after diagnosis. Additionally, the total all-cause healthcare cost after a flare increases with increasing flare severity from 30 through 90 days after flare. Preventing or decreasing the frequency and duration of flares may improve health outcomes and reduce healthcare costs for patients with SLE.
Ethics statements
Patient consent for publication
Ethics approval
The study data consisted of fully de-identified datasets, in compliance with the US Health Insurance Portability and Accountability Act; therefore, the study did not require institutional review board approval.
Acknowledgments
Writing and editing assistance was provided by Zachary Harrelson and Sarah Thornburg of JK Associates, part of Fishawack Health. This support was funded by AstraZeneca.
References
Supplementary materials
Supplementary Data
This web only file has been produced by the BMJ Publishing Group from an electronic file supplied by the author(s) and has not been edited for content.
Footnotes
Presented at Data were presented at the American College of Rheumatology/Association of Rheumatology Professionals (ACR/ARP) 2019 Annual Meeting, Atlanta, Georgia, USA, 8–13 November 2019.
Contributors ERH, BD, XW and MJ conceived and designed the study. AMN acquired the data and designed the study. All authors analysed and interpreted the data. All authors were involved in development, review and final approval of the manuscript.
Funding Analysis supported by AstraZeneca.
Competing interests ERH, BD, XW and MJ are employees of AstraZeneca. AMN is an employee of IQVIA and was paid by AstraZeneca to conduct this research study.
Provenance and peer review Not commissioned; externally peer reviewed.
Supplemental material This content has been supplied by the author(s). It has not been vetted by BMJ Publishing Group Limited (BMJ) and may not have been peer-reviewed. Any opinions or recommendations discussed are solely those of the author(s) and are not endorsed by BMJ. BMJ disclaims all liability and responsibility arising from any reliance placed on the content. Where the content includes any translated material, BMJ does not warrant the accuracy and reliability of the translations (including but not limited to local regulations, clinical guidelines, terminology, drug names and drug dosages), and is not responsible for any error and/or omissions arising from translation and adaptation or otherwise.