Article Text

Abstract
Objective Proteomic approach was applied to identify candidate biomarkers of chronicity in patients with proliferative lupus nephritis (LN), and their clinicopathological significance and prognostic values were investigated.
Methods This study recruited 10 patients with proliferative LN and 6 normal controls (NCs) with proteomic data to compare protein expression profiles, 58 patients with proliferative LN and 10 NCs to verify proteomic data by immunohistochemistry, and 14 patients with proliferative LN with urine samples to evaluate the urinary expression of the biomarker by western blot assay. The composite endpoints included end-stage renal disease and ≥50% reduction from baseline estimated glomerular filtration rate (eGFR).
Results Proteomics detected 48 proteins upregulated in the group with chronicity index (CI) ≥1 compared with the CI=0 and NC groups. Further pathway analysis was enriched in ‘other glycan degradation’. Neuraminidase 1 (NEU1), the most predominant protein in the pathway of other glycan degradation, was highly expressed in the kidney of patients with proliferative LN and could co-localise with podocyte, mesangial cells, endothelial cells and tubule cells. NEU1 expression in the tubulointerstitium area was significantly higher in the CI ≥1 group compared with the CI=0 and NC groups. Moreover, NEU1 expression was significantly correlated with serum creatinine value, eGFR and CI scores, respectively. Urinary NEU1 excretion in the CI ≥1 group was higher than in the CI=0 group and was also positively correlated with CI scores. Furthermore, the high expression of renal NEU1 was identified as an independent risk factor for renal prognosis by multivariate Cox regression analysis (HR, 6.462 (95% CI 1.025 to 40.732), p=0.047).
Conclusions Renal NEU1 expression was associated with pathological CI scores and renal outcomes in patients with proliferative LN.
- lupus nephritis
- autoimmune diseases
- lupus erythematosus
- systemic
Data availability statement
All data relevant to the study are included in the article or uploaded as supplementary information.
This is an open access article distributed in accordance with the Creative Commons Attribution Non Commercial (CC BY-NC 4.0) license, which permits others to distribute, remix, adapt, build upon this work non-commercially, and license their derivative works on different terms, provided the original work is properly cited, appropriate credit is given, any changes made indicated, and the use is non-commercial. See: http://creativecommons.org/licenses/by-nc/4.0/.
Statistics from Altmetric.com
Key messages
What is already known about this subject?
More recent studies suggested that neuraminidase 1 (NEU1) contributes to the pathogenesis of lupus nephritis, especially in the mesangial cells.
What does this study add?
The study demonstrated that renal NEU1 was associated with chronicity and renal outcomes of proliferative lupus nephritis.
How might this impact on clinical practice or future developments?
This study provides supportive data to confirm the pathogenic role of NEU1 in proliferative lupus nephritis.
New insights into the molecular mechanisms of lupus nephritis chronicity may shed promising therapeutic strategies.
Introduction
SLE is a chronic multisystem autoimmune disorder, and renal involvement is the major cause of overall morbidity and mortality.1 2 To specifically reflect lupus nephritis (LN) real-time disease activity or chronicity, several conventional biomarkers have been studied, including proteinuria amount, serum creatinine value, urine sediments, titres of anti-double-stranded DNA antibodies, serum C3 levels, etc.3 However, their sensitivities and specificities were limited. Invasive renal biopsy is still the gold standard in the classification of LN, evaluation of activity and chronicity of renal injury, guiding treatment and predicting prognosis.2 4
In renal histological indexes of LN, chronicity index (CI) by the National Institutes of Health (NIH) system definition contributed significantly to prediction of renal prognosis.5–12 CI included total glomerular sclerosis, fibrous crescents, tubular atrophy and interstitial fibrosis.4 Austin et al5 discovered the predictive value of CI in 102 patients with LN, and Wallace et al7 found that low biopsy CI was associated with a favourable outcome in steroid/immunosuppressive-resistant patients with LN. Tubular atrophy and interstitial fibrosis were also identified to be significant independent risk factors for renal outcomes in our previous study.13 More importantly, CI was demonstrated to be an independent risk factor for predicting complete renal remission in patients with proliferative LN rather than in patients with membranous LN.11
Recently, mass spectrometry (MS)-based proteomics, which enables a hypothesis-free approach, has become increasingly powerful in novel biomarker discovery of disease pathology, disease activity, specific treatment response, etc, compared with traditional enzymatic or antibody-based methods.14 The earliest application of proteomics in the study of kidney diseases was focused on urine due to its accessibility.14 15 For example, α1-antitrypsin was the most prominent urine biomarker found in patients with chronic kidney disease (CKD) through urine proteomics.16 A series of research identified that several urine proteins correctly classified IgA nephropathy with excellent sensitivity and specificity through urine proteomics.17 Moreover, a few promising urinary biomarkers have been identified in patients with LN using targeted and unbiased proteomics that could predict disease activity, damage and response to therapy,18 such as neutrophil gelatinase-associated lipocalin, monocyte chemoattractant protein-1, vascular cellular adhesion molecule-1, tumour necrosis factor-like weak inducer of apoptosis, interferon-γ-inducible protein-10, etc. However, there is still lack of good molecules associated with chronicity. Unlike urine proteomics with a highly variable biofluid containing a lot of potential variables (eg, osmolarity, pH, concentration, albumin), it was proposed that renal biopsied proteomics might provide more direct insights into disease-relevant mechanisms.14
Herein, we intended to conduct MS-based approaches to investigate alterations in protein expression profiles in the renal specimens of patients with LN associated with CI. The aim was to discover candidate renal biomarkers which could reflect chronic injury in patients with LN and provide initial validation of the clinicopathological significance of its biomarkers.
Methods
Patients and sample collection
Complete clinical and pathological data from 10 patients with renal biopsy-proven proliferative LN for proteomic analysis, 58 patients with renal biopsy-proven proliferative LN for immunohistochemical analysis (online supplemental figure 1) and 14 patients with renal biopsy-proven proliferative LN for urinary analysis who were diagnosed between 2012 and 2018 were collected. All patients fulfilled the 1997 American College of Rheumatology revised criteria for SLE.19 Renal tissues from normal parts of nephrectomised kidneys of patients with solitary renal cell carcinoma were collected as the normal controls (NCs) (6 NCs for proteomic analysis and 10 NCs for immunohistochemistry (IHC) analysis). They were identified normal via regular light microscopy, immunofluorescence and electron microscopy. All renal biopsies were read by two nephropathologists separately, blinded to patients’ clinical data and the scores of the other observer. These two nephropathologists would review the biopsies if there exist differences in scoring and thus reaching an agreement for subsequent clinicopathological analysis. The urine samples studied were obtained on the same day of the biopsy. Informed consent was obtained from each patient. For evaluation of renal outcomes, the composite endpoints included end-stage renal disease and ≥50% reduction from baseline estimated glomerular filtration rate (eGFR).
Supplemental material
Proteomics
Renal biopsied specimens from 10 patients with proliferative LN (3 with class III and 7 with class IV) and 6 NCs were collected for quantitative proteomic analysis. Formalin-fixed and paraffin-embedded renal biopsies were then prepared by filter-aided sample preparation20 and digested by LysC and trypsin. The digests were purified and desalted using C18 column. Next LC-MS/MS (liquid chromatography tandem mass spectrometry) analysis was conducted as previously described.21 Raw data were searched against the UniProt homo species database. Label-free quantification analysis was performed using the Integrated Proteomics Pipeline (IP2; http://integratedproteomics.com/). Raw data were background-corrected and sample distributions were adjusted using normalisation. A fold change ≥1.5 with p<0.05 was used to identify the differential proteins between the two groups and analyse the enriched pathway.22–27
Renal histopathology
Renal histopathology of patients with LN was evaluated according to the International Society of Nephrology/Renal Pathology Society (ISN/RPS) classification system.12 All patients enrolled in our study fulfilled the inclusion criteria of at least 10 glomeruli in the renal biopsy, which is recommended as the appropriate number of glomeruli for evaluation.28 Pathological parameters, including activity and chronicity indices, were determined by renal pathologists.12 Chronicity indices (CI) comprised total glomerulosclerosis score, fibrous crescents, tubular atrophy and interstitial fibrosis. The 58 patients with proliferative LN were divided into the CI ≥1 group and the CI=0 group according to their CI scores.
IHC of renal sections
Formaldehyde-fixed renal slides of patients with proliferative LN and NCs were first dewaxed in xylene ethanol at room temperature and rehydrated through graded ethanol. Antigen retrieval was then performed by heating the slides in citrate buffer (0.01 M, pH 6.0) for 3 min. After being cooled to room temperature and washed with phosphate buffered saline (PBS) three times, the slides were immersed in 3% hydrogen peroxide for 10 min at room temperature to quench endogenous peroxidase activity, and then blocked with 3% bovine serum albumin in PBS at room temperature for 1 hour and then incubated with the primary antibody, including anti-NEU1 (Abcam). The primary antibodies were revealed with the secondary antibodies (ZSGB-Bio, PV9001). Peroxidase activity was revealed by 3-3’-diamino-benzidine-tetrahydrochloride. The cell nucleaus was stained with haematoxylin, and finally the slides were dehydrated in ethanol and xylene and sealed with neutral gum. The results of staining of neuraminidase 1 (NEU1) were evaluated by Image Pro Plus (V.6.0; USA) as the mean optical density (integrated option density/area). Patients were divided into two groups according to the mean optical density of NEU1, which was top 50% versus bottom 50%, for example, high expression group versus low expression group.
Immunofluorescence
The renal sections were incubated with anti-NEU1 (Abcam), anti-NEU1 (Santa Cruz Biotechnology), anti-NPSH2 (Abcam), anti-CD31 (Santa Cruz Biotechnology) and anti-Integrin-α8 (Santa Cruz Biotechnology). The sections were then incubated with the second antibodies, including Goat Anti-Rabbit IgG H&L 594 (Abcam), Goat Anti-Mouse IgG H&L FITC (Abcam) or Lotus Tetragonolobus Lectin (Vector Laboratories). The cell nuclear was stained with 4′,6-diamidino-2-phenylindole (DAPI) (ASGB-BIO). Fluorescence images were collected using fluorescence microscope (90i; Nikon, Japan).
Western blot
The NEU1 protein levels in the urine samples from 14 patients with LN were measured by western blot. Each sample was normalised to the concentration of creatinine and 50 mg creatinine was loaded per lane.29 These urine samples were separated by 12% Sodium Dodecyl Sulfate Polyacrylamide Gel Electrophoresis (SDS-PAGE) and transferred to Polyvinylidene Fluoride (PVDF) membrane (Millipore, USA). After blocking with 5% (w/v) fat-free milk in Tris-Buffered Saline with Tween 20 (TBST) for 1 hour at room temperature, the PVDF membrane was incubated with the primary antibody rabbit anti-NEU1 (H-300; Santa Cruz Biotechnology) at 4°C overnight. The membrane was incubated with Goat Anti-Rabbit IgG (H+L) Horseradish Peroxidase Conjugate (1:5000; Proteintech) at room temperature for 1 hour after washing three times with TBST. The final signals of the fragments were developed by Chemiluminescent Horseradish Peroxidase Substrate Reagent (Millipore).
Statistical analysis
SPSS V.20.0 and Prism V.8 software (GraphPad, San Diego, California, USA) were used for statistical analysis. Experimental statistics were expressed as median with range (minimum–maximum) or mean±SD. When the variables were normally distributed, t-test was used; otherwise Kruskal-Wallis test was introduced. Analysis of variance (ANOVA) with a post-hoc test was performed among the different groups. Correlations between parametric variables were carried out using Pearson’s test, and correlations among non-parametric variables were carried out using Spearman’s test. Patients were stratified into two groups according to expression level of NEU1 (high level group: 29 patients; low level group: 29 patients). The prognosis of patients was analysed using Kaplan-Meier curves. Cox regression model was used for multivariate analysis of patient survival, and the results were expressed as HR with 95% CI. P<0.05 was considered significant.
Results
Demographics
The general data of 10 patients with proliferative LN for proteomic analysis are listed in online supplemental table 1. The general data of 58 patients with proliferative LN for immunohistochemical analysis are listed in online supplemental table 2. The general data of 14 patients with proliferative LN for urinary analysis are listed in online supplemental table 3.
Differential proteome analysis of renal specimens between the high and low CI score groups and the NC group
To identify candidate biomarkers of chronicity in patients with proliferative LN, MS was applied to analyse the differential proteome between the CI ≥1 group (the group of patients with renal chronicity) and the CI=0 or the NC group (the group of patients/controls without renal chronicity) at the renal level (5 patients with LN with CI ≥1, 5 patients with LN with CI=0 and 6 NCs). Volcano maps were used to visually describe the differentially expressed proteins between the CI ≥1 and the CI=0 group (figure 1A) or the NC group (figure 1B). Of the 4364 quantifiable proteins, 48 proteins were upregulated and 24 proteins were downregulated in the CI ≥1 group compared with the CI=0 or NC group (figure 1C and online supplemental table 4).
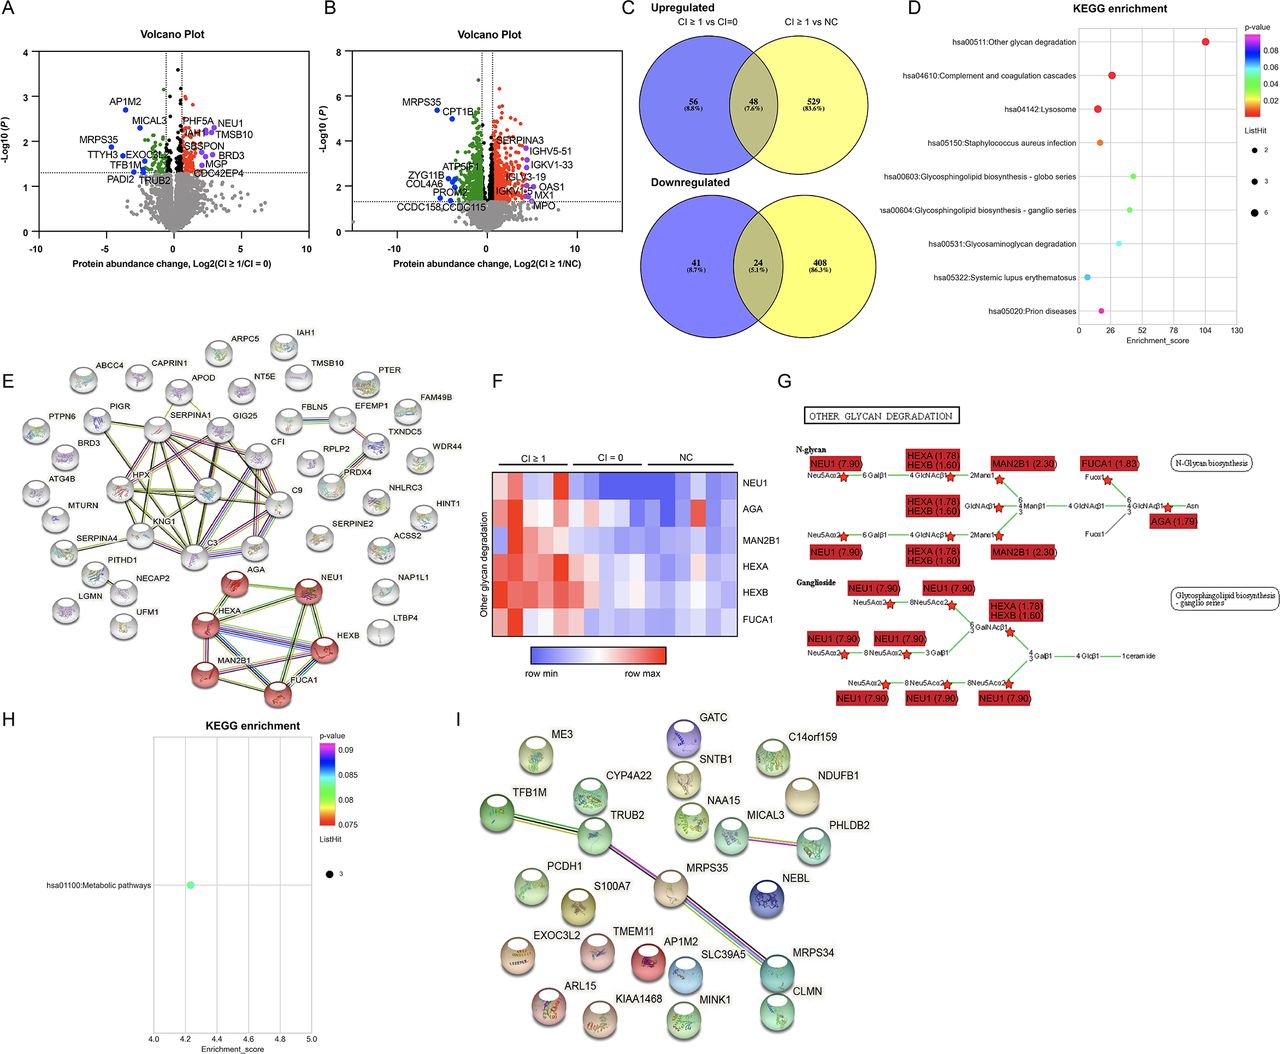
Quantitative proteomic and bioinformatic analyses of the renal specimens of patients with proliferative LN and normal controls (CI ≥1 group vs CI=0/NC group). (A) The volcano map depicts differentially expressed proteins between the CI ≥1 and the CI=0 group. Red dots: upregulated proteins (fold change (CI ≥1/CI=0) ≥1.5, p<0.05); green dots: downregulated proteins (fold change (CI=0/CI≥1) ≥1.5, p<0.05); purple dots: the top 8 upregulated proteins in the volcano map; blue dots: the top 8 downregulated proteins in the volcano map. Seven proteins specific to the CI ≥1 group were assigned a log2 (fold change) of infinity (MAPRE3, VPS13A, FBXL8, NT5C3A, GALC, LIMS2 and UBFD1). One protein specific to the CI=0 group was assigned a log2 (fold change) of infinity (SLC39A5). (B) The volcano map depicts differentially expressed proteins between the CI ≥1 and the NC group. Red dots: upregulated proteins (fold change (CI ≥1/NC) ≥1.5, p<0.05); green dots: downregulated proteins (fold change (NC/CI ≥1) ≥1.5, p<0.05); purple dots: the top 8 upregulated proteins in the volcano map; blue dots: the top 8 downregulated proteins in the volcano map. Two proteins specific to the NC group were assigned a log2 (fold change) of infinity (MCUR1 and SLC39A5). (C) Venn diagram of the proteins in the CI ≥1, CI=0 and NC groups. (D) KEGG pathway enrichment analysis was performed among the upregulated proteins. (E) The network of enriched proteins (upregulated). String: https://string-dborg. (F) Intensity of proteins that were enriched in other glycan degradation. (G) Proteins enriched in other glycan degradation pathway (KEGG; https://www.genome.jp/kegg/pathway.html). The fold change displayed was CI ≥1 vs CI=0. (H) KEGG pathway enrichment analysis was performed among the downregulated proteins. (I)The network of enriched proteins (downregulated). String: https://string-dborg. CI, chronicity index; KEGG, Kyoto Encyclopedia of Genes and Genomes; LN, lupus nephritis; NC, normal control.
We next subjected the 48 upregulated proteins to Kyoto Encyclopedia of Genes and Genomes (KEGG) pathway enrichment analysis and the results revealed that the ‘other glycan degradation’ was the most significantly enriched pathway (figure 1D). The functional protein association network also demonstrated enrichment of the ‘other glycan degradation’ pathway (figure 1E). The generated heatmap of the ‘other glycan degradation pathway’ is shown in figure 1F. The KEGG map demonstrated multiple upregulated proteins in the CI ≥1 samples compared with the CI=0 samples, and NEU1 was the most predominant protein (fold change=7.90) (figure 1G). The KEGG pathway analysis of the downregulated proteins demonstrated that metabolic pathways were disrupted (figure 1H). Figure 1I revealed the protein association network of these downregulated proteins.
Interestingly, the proteomic analysis between the CI=0 and the NC group did not reveal enrichment of the ‘other glycan degradation’ pathway (online supplemental figure 2A–C), which further supported our above finding that the ‘other glycan degradation’ pathway might be specifically associated with renal chronicity in patients with LN. The multiple comparisons between CI ≥1, CI=0 and NC groups for each pairwise using ANOVA with a post-hoc test are displayed in online supplemental figure 3, which also indicated no statistical significance in the six proteins (NEU1, AGA, MAN2B1, HEXA, HEXB, FUCA1) enriched in the ‘other glycan degradation’ pathway between the CI=0 and the NC group.
CI included glomerulosclerosis score, fibrous crescents, tubular atrophy and interstitial fibrosis based on the 2018 ISN/RPS system. More data were analysed according to each component of the CI. The differentially expressed proteins and enriched pathways in patients with different scores of glomerulosclerosis, tubular atrophy and interstitial fibrosis are shown in online supplemental figures 4–6, respectively. These results also suggested enrichment of the ‘other glycan degradation’ pathway. As there were no fibrous crescents in our enrolled samples, this was not included in our final analysis. Especially, the group assignment according to existence of interstitial fibrosis was the same as the total CI scores. The differentially expressed proteins are listed in online supplemental tables 5–7.
NEU1 expression in the kidneys of patients with proliferative LN
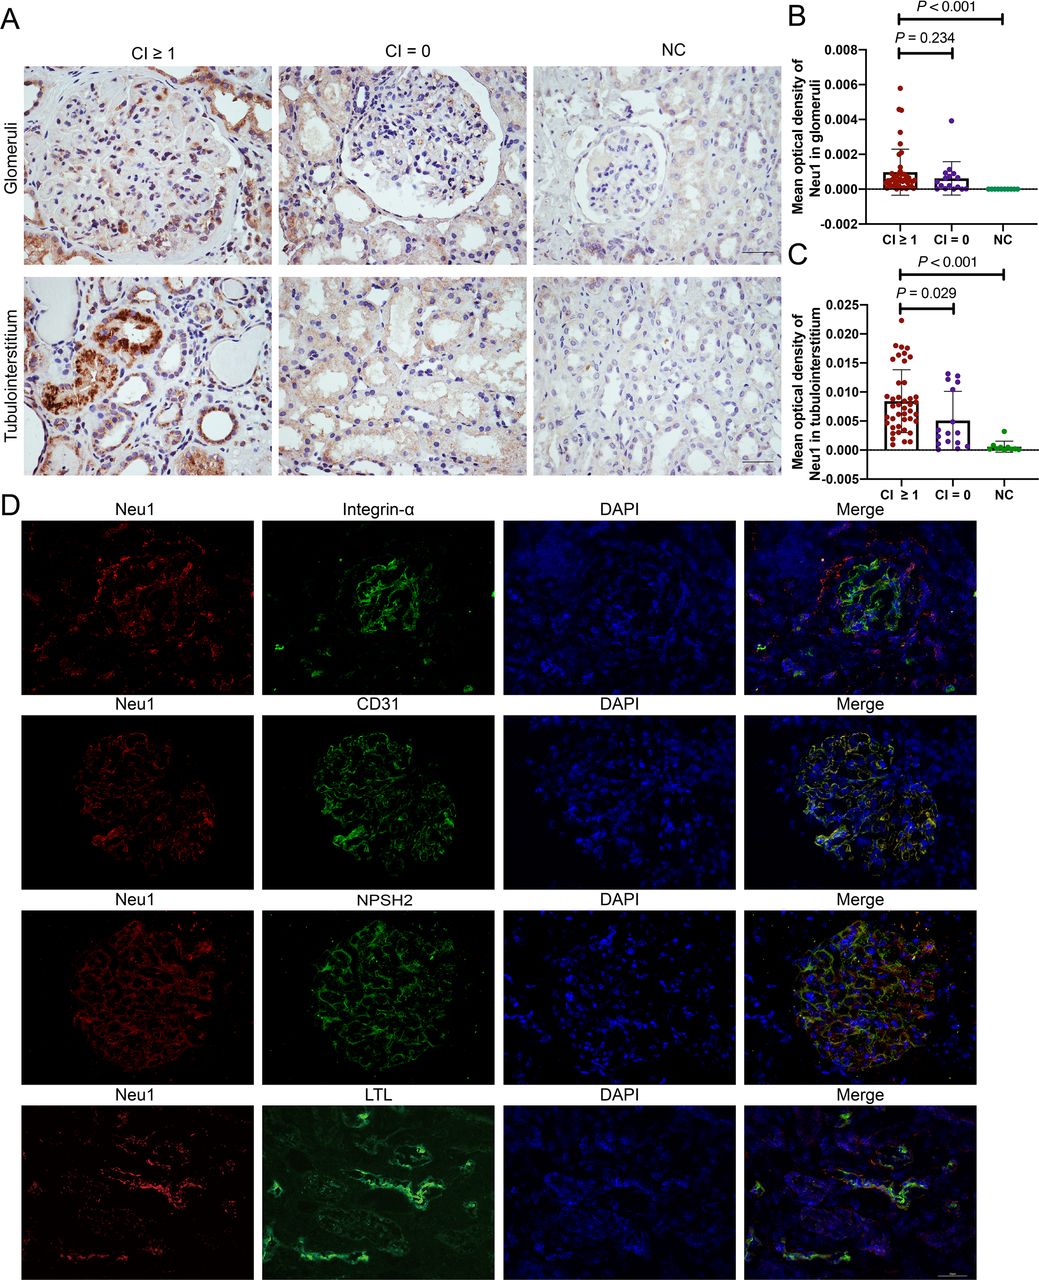
As NEU1 was the most predominant protein in the ‘other glycan degradation pathway’, which was mentioned above, we further assessed the expression of NEU1 in the glomeruli or tubulointerstitium area with a larger sample size (58 patients with proliferative LN) by IHC (42 CI ≥1 samples and 16 CI=0 samples). We tested the normality of NEU1 intensity and found it was not normally distributed (glomeruli: p<0.001; tubulointerstitium: p<0.001; note: p<0.05 indicated that the data were not normally distributed).30 Thus, we applied the Kruskal-Wallis (KW) test with False Discovery Rate (FDR) correction for comparison. As displayed in figure 2A,B, NEU1 intensity in the glomeruli area was significantly higher in the CI ≥1 group than in the NC group (p<0.001), and no significance was found in the glomeruli area between the CI ≥1 group and the CI=0 group (p=0.234). NEU1 intensity in the tubulointerstitium area was significantly higher in the CI ≥1 group than those in the CI=0 group (p=0.029) and the NC group (p<0.001), respectively (figure 2A,C).

Expression pattern of NEU1 in the kidneys of 58 patients with proliferative LN. (A) Immunohistochemical staining of NEU1 in the glomeruli (above) and tubulointerstitium (below) areas of patients with proliferative LN and NC samples. (B) Mean optical density of NEU1 in the glomeruli area of 42 patients with proliferative LN with CI ≥1, 16 patients with proliferative LN with CI=0 and 10 NC samples. (C) Mean optical density of NEU1 in the tubulointerstitium area of 42 patients with proliferative LN with CI ≥1, 16 patients with proliferative LN with CI=0 and 10 NC samples. (D) Co-localisation of NEU1 (red) and integrin-α (green) (marker of mesangial cell), CD31 (green) (marker of endothelial cells), NPSH2 (green) (marker of podocyte) or LTL (green) (marker of proximal tubule cells). Scale bar: 50 µm. CI, chronicity index; DAPI, 4′,6-diamidino-2-phenylindole; LN, lupus nephritis; LTL, Lotus Tetragonolobus Lecti; NC, normal control; NEU1, neuraminidase 1; NPHS2, NPHS2 stomatin family member, podocin.
Co-localisation of NEU1 with renal cells in patients with proliferative LN
A double immunofluorescence assay was conducted to detect the co-localisation of NEU1 and renal cells. As displayed in figure 2D, NEU1 could be well co-localised with podocytes, mesangial cells, endothelial cells and proximal tubular cells, respectively, in patients with proliferative LN.
Clinicopathological significance of NEU1 expression in the kidneys of patients with proliferative LN
Stronger intensity of NEU1 in the glomeruli area was associated with higher serum creatinine values (r=0.416, p=0.001) and lower eGFR (r=−0.307, p=0.019) (table 1). Similar associations were found between tubulointerstitium NEU1 expression and the above two items (serum creatinine values: r=0.428, p<0.001; eGFR: r=−0.375, p=0.004).
Correlations of renal NEU1 expression and clinical features in patients with proliferative lupus nephritis
For renal pathological evaluations, NEU1 expression was significantly correlated with CI scores (glomeruli: r=0.278, p=0.035; tubulointerstitium: r=0.407, p=0.002) (table 1). There was a significantly positive association between NEU1 expression in the tubulointerstitium and ratio of glomerulosclerosis (r=0.356, p=0.006) or interstitial fibrosis (r=0.474, p=0.037).
We further measured the excretion of NEU1 in the urine of 14 patients with proliferative LN to detect the association between NEU1 and CI scores. The urinary levels of NEU1 in the CI ≥1 group were significantly higher than that in the CI=0 group (p=0.048) (online supplemental figure 7A,B). Moreover, the relative expression of urinary NEU1 was positively correlated with CI scores (r=0.590, p=0.029) (online supplemental figure 7C).
Association of renal NEU1 expression with prognosis in 58 patients with LN
The 58 patients with LN were stratified into two groups according to the intensity of NEU1 (dichotomy: high expression group and low expression group). The Kaplan-Meier curve showed that high NEU1 expression in the glomeruli, tubulointerstitium or both could predict worse prognosis by log-rank test (p=0.039, p=0.041 and p=0.005, respectively) (figure 3A,B). The univariate Cox regression analysis demonstrated that high NEU1 expression in the glomeruli or tubulointerstitium was not a risk factor for prognosis (table 2). However, high NEU1 expression both in the glomeruli and tubulointerstitium was found to be a significant risk factor (HR, 6.691 (95% CI 1.419 to 31.560), p=0.016). Furthermore, high NEU1 expression (both in the glomeruli and tubulointerstitium) and renal pathological CI scores were both independent risk factors after adjusting for age and gender (HR, 6.462 (95% CI 1.025 to 40.732), p=0.047; HR, 1.582 (95% CI 1.131 to 2.213), p=0.007, respectively) by multivariate Cox regression analysis (table 2).

Kaplan-Meier analysis of renal composite endpoints between high and low renal NEU1 expression group. (A) Kaplan-Meier analysis of renal composite endpoints between the high and low NEU1 expression group in glomeruli (dichotomy based on the mean optical intensity of NEU1 in glomeruli; 29 patients in the high expression group (top 50%) and 29 patients in the low expression group (bottom 50%)). (B) Kaplan-Meier analysis of renal composite endpoints between the high and low NEU1 expression group in tubulointerstitium (dichotomy based on the mean optical intensity of NEU1 in tubulointerstitium; 29 patients in the high expression group (top 50%) and 29 patients in the low expression group (bottom 50%)). (C) Kaplan-Meier analysis of renal composite endpoints between the high (both in glomeruli and tubulointerstitium) and low (low in glomeruli or tubulointerstitium) NEU1 expression group. NEU1, neuraminidase 1.
Cox regression analysis of renal composite outcomes for patients with proliferative lupus nephritis
Discussion
Several studies demonstrated that renal pathological CI was an individual prognostic indicator of worse renal outcomes in patients with LN.5–10 Biomarkers which could better reflect chronic injury are needed. In this current work, we initially explored a candidate renal biomarker associated with renal pathological CI scores using renal specimens’ proteomic technology in patients with proliferative LN and comprehensively analysed its clinicopathological significance based on a well-defined cohort.
First, proteomic technology was applied to analyse the differential proteome between the CI ≥1 group and the CI=0 group or the NC group at the renal level. The KEGG pathway enrichment analysis demonstrated that the ‘other glycan degradation’ pathway was significantly enriched in the CI ≥1 group and NEU1 was one of the most predominant proteins (fold change=7.90). Moreover, further analysis of each component of the CI also indicated the importance of the ‘other glycan degradation’ pathway in the renal chronicity of patients with LN. Based on the generous recommendation for screening process of proteomics, researchers usually tend to choose the pathways/proteins with higher fold change for the subsequent analysis.31–33 In our study, although HEXA/HEXB was universally overexpressed in the CI ≥1 group, their expressions in the CI=0 group were also high and their fold change (CI ≥1/CI=0) was 1.78 and 1.60, respectively, which was lower than that of NEU1 (7.90). Moreover, the potent pathogenic roles of the candidate proteins should also be taken into consideration. After literature review, we found that NEU1 was highly expressed in the mesangial cells of lupus-prone mice, could mediate interleukin-6 (IL-6) production and was reported to be associated with fibrosis.29 34–38 Taken together, it was suggested that NEU1 might participate in the chronicity of LN. Next, we verified the proteomic results through IHC technology in other 58 patients with proliferative LN and we found that renal NEU1 expression, especially in the tubulointerstitium area, was significantly higher in the CI ≥1 group compared with the CI=0 group or the NC group. The intensity of renal NEU1 expression was positively correlated with serum creatinine values, eGFR and some renal pathological chronicity indices. Urinary NEU1 excretion was also positively correlated with renal pathological CI scores. More importantly, high renal NEU1 expression both in the glomeruli and tubulointerstitium was identified as an independent risk factor for worse renal outcomes. These all suggested that NEU1 might be a candidate renal biomarker of chronicity of proliferative LN. Interestingly, KEGG analysis of the downregulated proteins demonstrated an enrichment of the metabolic pathway. As the metabolic reprogramming was reported to play an important role in the pathogenesis of LN,39 40 further explorations are needed.
The chronicity of LN was assessed by NIH chronicity indices, which comprised glomerular sclerosis, fibrous crescents, tubular atrophy and interstitial fibrosis.12 41 Research on the pathomechanism of chronic lesions mainly focused on interstitial fibrosis, and transforming growth factor-β (TGF-β) was the most important factor which drove fibrosis in most CKD, including LN.42 43 TGF-β1 could activate both canonical (Smad-based) and non-canonical (non-Smad-based) signalling pathways to induce extracellular matrix (ECM, the hallmark of fibrosis) production and lead to renal fibrosis. Inhibition of the TGF-β1 or its downstream pathways could significantly limit renal fibrosis, whereas overexpression of TGF-β1 could induce renal fibrosis42 and vice versa.
Neuraminidases (sialidases) (Neu) are key enzymes that participate in other glycan degradation and glycosphingolipid metabolism that could remove sialic acids from gangliosides and proteins, and their activity could lead to immune cell infiltration, inflammation and tissue damage.29 37 44–46 Of them, NEU1 is the major Neu that is expressed in the kidney and was reported to be associated with childhood-onset nephrotic syndrome, IgA nephropathy and LN.29 37 38 47–50 According to previous studies, NEU1 was associated with chronicity of diseases (fibrosis). NEU1 takes centre stage in the physiological formation of elastic fibres, which were the fundamental components of the ECM (the hallmark of fibrosis).34 51 In idiopathic pulmonary fibrosis, the elevated expression of NEU1 could provoke lymphocytic infiltration and collagen deposition, leading to pulmonary fibrosis,35 and the inhibition of NEU1 significantly reduced the accumulation of pulmonary lymphocytes and deposition of collagen, which indicated that NEU1-selective inhibition provided a potential treatment for pulmonary fibrotic diseases.52 Meanwhile, NEU1 was considered to be able to regulate TGF-β activation, which played an important role in renal fibrosis.34 35 Thus, we proposed that NEU1 might participate in the chronicity of LN. Tamara K Nowling’s group29 previously found that the mRNA levels of NEU1 were elevated in the kidney of nephritic mice compared with that in non-nephritic mice (MRL/lpr mouse model), and urinary NEU1 excretion was much higher in patients with LN in comparison with patients with lupus without nephritis. They also found that NEU1 was highly expressed in the mesangial cells of lupus-prone mice (MRL/lpr and NZM2410).36 Further investigation demonstrated that NEU1 mediated IL-6 production (IL-6 played an important role in the onset of nephritis53–59) in lupus-prone mesangial cells through Toll-Like Receptor 4 (TLR4)-p38/Extracellular signal-Regulated Kinases (ERK) Mitogen-Activated Protein Kinase (MAPK) signalling pathway.37 38 In 2020, the same group applied Neu inhibitor oseltamivir phosphate to treat MRL/lpr mice at the onset of proteinuria.48 Unexpectedly, oseltamivir phosphate failed to significantly impact the renal or immune disease measures in those mice. They proposed that the unsuccessful therapeutic effect of oseltamivir phosphate might be due to the insufficient inhibitor effectiveness to Neu because they did not observe any significant difference in renal Neu activity at the endpoint of the study. Therefore, more specific mammalian Neu inhibitors are needed to verify its therapeutic value in LN. In 2021, this same group constructed female B6. SLE1/2/3 lupus-prone mice with genetically reduced NEU1 levels (NEU1+/−). The results demonstrated that NEU1 was responsible for mediating cytokine release by primary mesangial cells; however, NEU1 heterozygote knockout did not delay the onset or progression of the disease. They proposed that the development of only mild renal disease in the B6. SLE1/2/3 mice was an important limitation of the in vivo study, which may be due to environmental/microenvironment differences.46 The impact of the potential role of NEU1 with respect to established nephritis in lupus-prone mice needs further investigation. The above studies suggested that NEU1 might play a pathogenic role in the kidney of LN by mediating the dysfunctional glycosphingolipid metabolism and inflammation, which might be associated with disease progression and chronicity.
Our present study has some limitations. First, the sample size was not large enough. Second, the level of glucosylceramide and lactosylceramide, the breakdown product of gangliosides by NEUs, in the kidney and urine of patients with LN needs to be examined.
In conclusion, renal NEU1 expression was associated with pathological CI and worse renal prognosis in patients with proliferative LN, which requires further exploration.
Data availability statement
All data relevant to the study are included in the article or uploaded as supplementary information.
Ethics statements
Patient consent for publication
Ethics approval
The research was in compliance with the Declaration of Helsinki and the design of this work was approved by the local ethical committee (2017 (1333)). The study was conducted in accordance with the principles of the Declaration of Helsinki and approved by the Institutional Review Board of Peking University First Hospital (2017 (1333)).
Acknowledgments
The authors would like to thank Wang Luoyi for assistance in immunochemistry assay.
References
Supplementary materials
Supplementary Data
This web only file has been produced by the BMJ Publishing Group from an electronic file supplied by the author(s) and has not been edited for content.
Footnotes
Contributors ZM performed the experiments, analysed the statistics and drafted the manuscript. YT revised the manuscript. FY designed the study and revised the manuscript. MZ reviewed and edited the manuscript. FY had full access to all of the data and provided final approval of the submitted manuscript. All authors read and approved the manuscript.
Funding This work was supported by the National Natural Science Foundation of China (no 81870479), the Beijing Natural Science Foundation (no 7192207 and no 7212114), the Chinese Academy of Medical Sciences Research Unit (no 2019RU023) and the Clinical Medicine Plus X - Young Scholars Project of Peking University supported by 'the Fundamental Research Funds for the Central Universities'.
Competing interests None declared.
Provenance and peer review Not commissioned; externally peer reviewed.
Supplemental material This content has been supplied by the author(s). It has not been vetted by BMJ Publishing Group Limited (BMJ) and may not have been peer-reviewed. Any opinions or recommendations discussed are solely those of the author(s) and are not endorsed by BMJ. BMJ disclaims all liability and responsibility arising from any reliance placed on the content. Where the content includes any translated material, BMJ does not warrant the accuracy and reliability of the translations (including but not limited to local regulations, clinical guidelines, terminology, drug names and drug dosages), and is not responsible for any error and/or omissions arising from translation and adaptation or otherwise.