Article Text

Abstract
Objectives Type 1 interferon (IFN) is key to the pathogenesis of SLE, evidenced by the expression of IFN-stimulated genes (ISGs) in most patients, but the clinical utility of serial ISG assessment remains unknown. With the emergence of IFN-blocking drugs, we aimed to examine IFN status in relation to clinical findings longitudinally to provide insights into the value of testing ISG levels over time.
Methods Clinical data and whole blood were collected prospectively on adult patients with SLE from a single tertiary lupus centre. IFN status was measured using a panel of ISGs.
Findings 729 samples were analysed from 205 patients. At baseline, 62.9% of patients were IFN high, 30.2% IFN low and 6.8% borderline. 142 patients had multiple samples collected, and 87.3% of these demonstrated stable ISG status over time. In longitudinal follow-up, IFN high patients had higher activity in multiple organ domains and spent less time in Lupus Low Disease Activity State, but IFN score did not correlate with SLE Disease Activity Index in individual patients. In the small subset of patients who had large fluctuations in ISG across the observation period, most had high-dose glucocorticoids that correlated with ISG suppression. However, low-moderate-dose glucocorticoids did not suppress ISG expression.
Conclusion Although IFN high status is associated with indicators of more severe SLE, in the majority of patients, ISGs are stable across time and do not correlate with disease activity. Changes in ISG expression may be seen with high-dose, but not routine dose, glucocorticoid exposure. These findings suggest baseline but not serial ISG measurement may be of value in the management of SLE.
- glucocorticoids
- interferon type I
- cytokines
Data availability statement
Data are available upon reasonable request. The data underlying this article will be shared on reasonable request to the corresponding author.
This is an open access article distributed in accordance with the Creative Commons Attribution Non Commercial (CC BY-NC 4.0) license, which permits others to distribute, remix, adapt, build upon this work non-commercially, and license their derivative works on different terms, provided the original work is properly cited, appropriate credit is given, any changes made indicated, and the use is non-commercial. See: http://creativecommons.org/licenses/by-nc/4.0/.
Statistics from Altmetric.com
Key messages
What is already known about this subject?
Small cross-sectional studies suggest patients with SLE who overexpress interferon (IFN)-stimulated genes (ISGs) have more active disease.
Inhibition of the IFN pathway in SLE is an emerging therapeutic option.
What does this study add?
Novel insight is provided into the longitudinal patterns of ISG expression in patients with SLE.
Large changes in ISG expression level were infrequent and were mostly associated with high-dose glucocorticoids.
How might this impact on clinical practice or future developments?
With the emergence of IFN-blocking agents, this study provides important information about the utility of IFN status testing in the management of SLE.
Introduction
SLE is a clinically diverse systemic autoimmune disease, with manifestations ranging from mild to severe and life-threatening.1 Although SLE is biologically heterogeneous,2 activation of the type 1 interferon (IFN) programme, first identified following the development of genome-wide expression analysis3 and exemplified by the upregulation of IFN-stimulated genes (ISGs), has been consistently identified in 60%–80% of patients.4 IFN now forms a central part of accepted paradigms of SLE pathogenesis.1 In these models, IFN is produced by plasmacytoid dendritic cells in response to immune complexes containing host nucleic acids,5 promotes the maturation and activation of components of the immune system involved in SLE pathogenesis, including B lymphocytes,6 7 and perpetuates the production of autoantibodies and a cycle of inflammation and tissue injury. However, approximately one in four patients with SLE do not display the IFN gene signature. Several small studies have analysed differences between patients who overexpress ISGs (IFN high) and those who do not (IFN low), with reports suggesting IFN high patients have more active disease, particularly in renal domains, and more autoantibodies.8–10 However, there is a paucity of information regarding changes in IFN status over time in individual patients, as well as disease outcomes in patients who differ in IFN status.
With the emergence of IFN-blocking medications11 and a move towards personalised medicine in SLE, it is important to analyse differences between IFN high and low patients as well as examine factors that may impact on ISG expression over time, and thereby examine whether IFN status testing has utility either at baseline or longitudinally.
Methods
Consenting adult patients meeting American College of Rheumatology (ACR) criteria for SLE12 or the Systemic Lupus International Collaborating Clinics (SLICC) Classification Criteria for SLE13 were recruited from Monash Lupus Clinic, a dedicated SLE clinic at a large tertiary hospital in Melbourne, Australia, between July 2017 and July 2019. All consenting eligible patients were included. Visit frequency was dictated by clinical need. Whole blood RNA samples were collected in PAXgene tubes at the time of the patients’ routine pathology collection. In this clinic, extensive clinical data temporally relating to blood sampling are prospectively collected using standardised data collection formats,14 including demographic data, medication use, SLE Disease Activity Index (SLEDAI-2K),15 Safety of Estrogens in Lupus Erythematosus: National Assessment (SELENA)-SLEDAI Flare Index (SFI)16 and Lupus Low Disease Activity State (LLDAS)17 status. SLICC-ACR Damage Index (SDI)18 and health-related quality of life (HRQoL) measured using SF-3619 were collected annually. Organ-specific disease activity at the time of IFN testing was assessed using SLEDAI-2K domains.
IFN status was measured by DxTerity Diagnostics (Rancho Dominguez, California, USA), using the DxTerity Modular Immune Profile test, a commercially available chemical ligation-dependent probe amplification and gene expression test with relative quantitative analysis by capillary electrophoresis. Sample testing and analysis was performed directly on PAXgene RNA Stabilized Blood as described by Kim et al20 with minor modifications to the protocol. The DxTerity 4-gene Type 1 Interferon (IFN-1) test measures the RNA expression levels of four ISGs (HERC5, IFI27, IFIT1 and RSAD2) to the expression levels of three housekeeping normaliser genes (ACTB, GAPDH and TFRC). Normalised expression values of each respective response gene were calculated per the following function: Normalised ExpressionGene i =Log2(HeightGene i)–Mean (Log2(Normaliser Gene Height)).
The DxTerity 4-gene IFN-1 signature score was calculated by averaging the normalised expression values of the four ISGs.21 The IFN-1 signature score cut-off of −0.5 between IFN high and low was determined based on measurement of 281 healthy human blood samples and placing the cut-off at 2 SDs (95th percentile) above the mean healthy IFN-1 score (−0.5). This cut-off falls within the trough of the observed bimodal distribution of IFN-1 scores for this and other cohorts of SLE samples. The IFN-1 high/low cut-off of −0.5 includes a ±0.25 borderline range (−0.75 to −0.25). Samples falling within this range of −0.75 to −0.25 were labelled as borderline. Patients with initial borderline results were excluded from the baseline analysis but were included in the longitudinal analysis based on their subsequent results. Stable IFN status was defined as patients in whom all serial results were in the same IFN high versus low category.
Statistical analysis was performed using GraphPad Prism and R software. Univariate logistic regression was used to assess for associations with a binary outcome. Mann-Whitney U tests were used to compare groups of non-parametric continuous data. One way analysis of variance with Tukey’s multiple comparisons test was used to compare multiple groups. Multivariate logistic and linear regression was used to control for potentially confounding variables. P values of <0.05 were considered statistically significant.
Results
Patient characteristics are shown in table 1. Two hundred five patients with SLE were included. Eight hundred samples were submitted for analysis; 729 results were available for analysis after quality control. Sixty-three patients had single samples while 142 patients had longitudinal samples (median 4 (range 2–17) samples) over the study period (median (range) follow-up 644 (42–789) days).
Demographic data and antibody status
On initial test, 129 (62.9%) patients were IFN high and 62 (30.2%) were IFN low, while 14 (6.8%) patients had borderline readings (figure 1A). In the 142 patients who had >1 sample, 124 (87.3%) had stable IFN status over time, with 85 (59.8%) having stable IFN high results, and 39 (27.5%) stable IFN low results. Only 18 (12.6%) patients had both IFN high and low results across the study period (figure 1A). Figure 1B shows ISG readings over the study period in each patient who had >1 sample analysed.
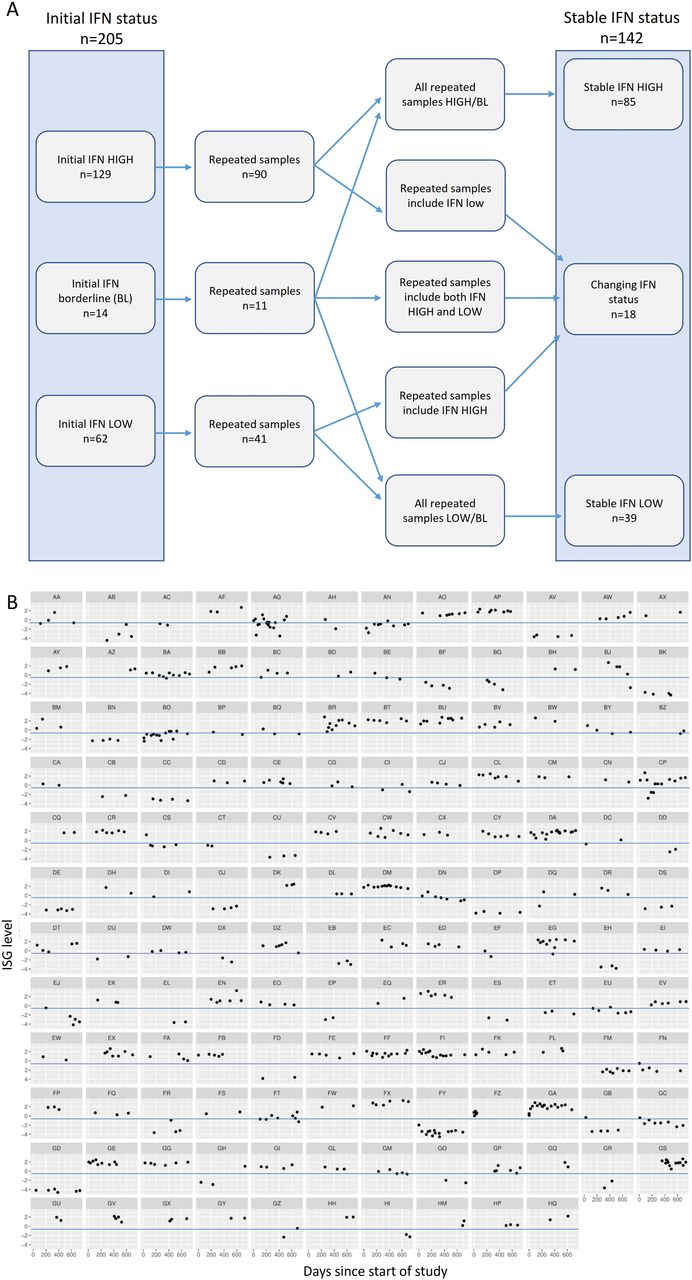
(A) Diagram outlining IFN status of patient samples on initial testing and longitudinal status in patients with >1 sample. (B) Individual patient ISG results over the course of the study period, in 142 patients with >1 sample. Blue line represents ISG test cut-off for IFN high and low. IFN, interferon; ISG, IFN-stimulated gene.
We compared demographic variables and clinical manifestations in patients categorised according to initial IFN high and IFN low status (table 1). IFN high patients were less likely to be of Caucasian ethnicity and more likely to be of East Asian ethnicity. Patients with initial IFN high status were younger at the onset of disease and at enrolment to this study, however disease duration at enrolment did not differ between IFN status groups (table 1). Autoantibody status differed significantly, with initial IFN high patients being more likely to have a speckled ANA pattern, and initial low IFN patients a homogeneous IFN pattern (table 1). Each of anti-RNP, anti-Ro and anti-La were more frequent in the initial IFN high group compared with initial IFN low patients (table 1). Given the differences in age of disease onset and ancestry between the IFN high and low groups, we performed multivariate analysis to control for these variables. Including these variables in the analysis did not alter the above-mentioned differences between IFN high and IFN low patients (table 1).
We next analysed SLE disease activity in groups categorised by IFN status, as measured by the respective SLEDAI-2K organ domain during the study period. At baseline, compared with patients with an initial IFN low reading, initial IFN high patients were more likely to have disease activity in multiple SLEDAI-2K domains, including haematuria, arthritis, skin disease and leucopenia, as well as serological activity (table 2). Findings were similar when comparing stable IFN high patients with stable IFN low patients (table 2). We again performed multivariate analysis to control for ethnicity and age of disease onset. Most clinical associations with IFN high status remained significant after adjustment, but a strong association between the active renal disease and younger age of onset resulted in attenuation of the association between IFN status and active renal disease after adjusting for age (table 2).
Active disease manifestations at baseline and over time, measured by SLEDAI-2K domain scores
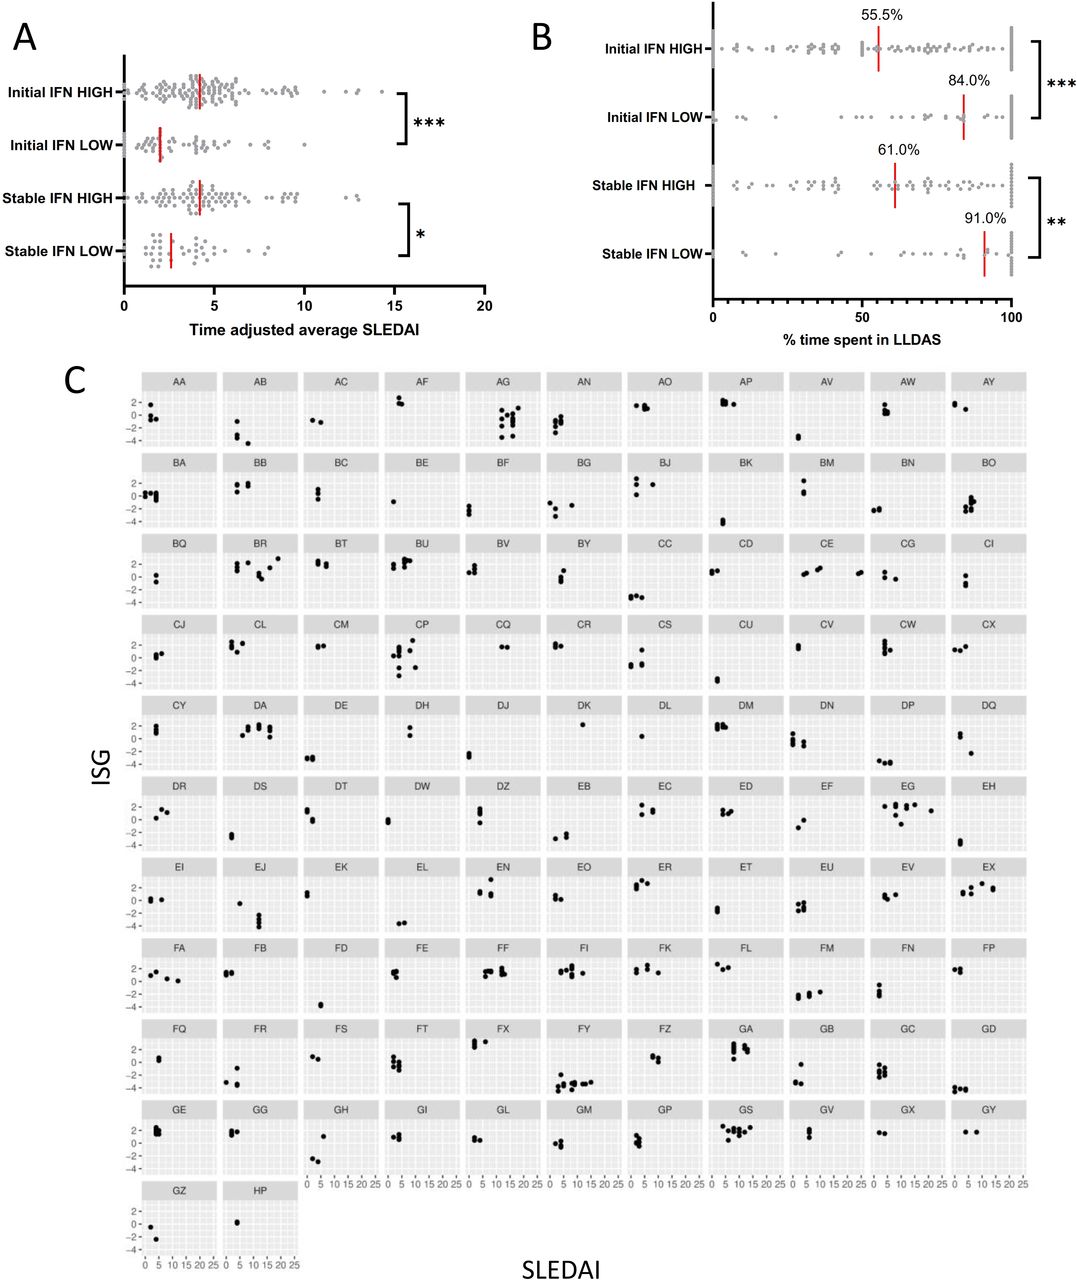
We went on to examine associations of IFN status with disease activity assessed through several composite measures. The median time-adjusted mean SLEDAI-2K22 was higher in the initial high and stable high IFN groups compared with the initial low and stable low groups (figure 2A). Patients with initial high or stable high IFN levels spent significantly less time in LLDAS than those with initial low or stable low IFN readings (figure 2B). Flares measured with the SFI were more frequent in IFN high patients (online supplemental table S1): 69 (53.5%) of patients with initial IFN high status had a mild-moderate flare during the study period compared with 16 (25.8%) of initial IFN low patients (OR 3.31 (1.72 to 6.58), p=0.0004), and 34 (26.4%) initial IFN high patients had a severe flare during the study period compared with 4 (6.5%) initial IFN low patients (OR 5.19 (1.94 to 18.04), p=0.003). Findings were similar where comparing stable IFN status (online supplemental table S1). Like active renal disease, less time spent in LLDAS was associated with younger age of disease onset, and the relationship between IFN status and time spent in LLDAS was thus attenuated on multivariate analysis, but other associations between IFN status and disease state generally remained significant (online supplemental table S1).
Supplemental material

(A) Time-adjusted average SLEDAI scores in patients with initial IFN high and IFN low results, and in patients with stable IFN high and IFN low results. (B) Percentage time spent in Lupus Low Disease Activity State (LLDAS) in patients with initial IFN high and IFN low results, and in patients with stable IFN high and IFN low results. (C) Relationship between SLEDAI and IFN-stimulated genes (ISGs) in patients with ≥3 samples and a change in SLEDAI of ≥3 across the study period. IFN, interferon; SLEDAI, SLE Disease Activity Index.
Medication use was next examined, as an additional surrogate indicator of severity (online supplemental table S2). Data were available for 200 patients. Hydroxychloroquine use was common and similar in all groups (90.6% initial IFN high, 88.1% initial IFN low, 91.6% stable IFN high, 92.1% stable IFN low.) Immunosuppressant use was higher in the initial and stable IFN high groups compared with the respective IFN low groups (initial high vs initial low 74.0% vs 54.2%, p=0.04; stable high vs stable low 78.3% vs 55.3%, p=0.012). Initial IFN high patients were more likely to have received glucocorticoids (GCs) during the study period than IFN low patients (63.8% vs 45.8%, p=0.031) and had a higher median time-adjusted mean GC dose (median 1.7 (range 0–42.2) mg/day vs 0.0 (0–11.5) mg/day, p=0.005).
Having established differences in phenotype between patients grouped according to IFN status, we next examined for associations over time between disease activity and ISG as a continuous variable, using the subset of patients with at least three ISG readings and a change in SLEDAI score of at least 3 points across the study period (figure 2C). In contrast to the differences in aggregate indicators of disease activity between the groups of IFN high and IFN low patients, there was no association over time between ISG level and disease activity in individual patients. IFN high patients as a group had overall lower complement levels (C3 mean (SD) 0.74 (0.21) vs 0.87 (0.23) g/L, p=0.004, C4 mean (SD) 0.13 (0.07) vs 0.15 (0.09) g/L, p=0.039) and higher anti-dsDNA antibody titres (median (range) 64.5 (1–1399) vs 23.0 (1–332) IU/mL, p=0.0014). Despite this, IFN high patients had higher clinical (excluding serological) SLEDAI scores (median (range) 1 (0–15) vs 0 (0–12), p=0.002) than IFN low patients. There was no association between complement level or anti-dsDNA antibody titre and ISG level within individual patients (online supplemental figures S1–S4). The relationship between complement levels and anti-dsDNA antibody titres with non-serological SLEDAI scores is also shown for comparison in online supplemental figures S5–S8. As expected, across the whole cohort, C3 levels were negatively correlated with non-serological SLEDAI (R=−0.22, p<0.0001), and anti-dsDNA positively correlated with non-serological SLEDAI (R=0.13, p=0.0007), however there was no clear correlation within the individual patient.
Next, we analysed the subgroup of 18 patients whose IFN status changed during the study period in more detail. We calculated the mean and SD of the range of ISG expression levels seen in patients with stable IFN low or high results (mean range 1.017±0.77). The range of IFN scores in each individual patient is displayed in figure 3A. Patients with changing IFN status fell predominantly into two groups. Twelve of 18 patients had a range of ISG readings that were within 2 SDs of the mean range seen in the stable IFN groups, however had readings that were close to the high/low cut-off for the test (figure 3B, green boxes). The remaining six patients had variations in IFN score beyond 2 SDs from the mean of the range seen in the stable IFN groups (figure 3B, red boxes). Of these patients, five of six had treatment with high-dose GCs (≥25 mg prednisolone) and/or intravenous cyclophosphamide that was temporally associated with suppression of IFN score (figure 3C–H). We also examined patients with stable high or low IFN status whose IFN score fluctuated by more than 2 SDs from the mean range observed without crossing the cut-off to change IFN status. There were three patients classified as stable IFN high who fell into this category and all three had treatment with high-dose GCs that temporally coincided with suppression of ISGs (online supplemental figure S9A–C). In addition, four IFN low patients fell into this category, one of whom had high-dose GCs temporally relating to ISG suppression (online supplemental figure S9D). The remaining three patients had one higher reading among several lower stable readings without a clear relationship to medication use (online supplemental figure S9E–G). When we examined the effect of GCs on ISG expression across the whole cohort, ISG expression was suppressed in patients on high-dose GCs (>25 mg prednisolone per day) but there was no suppression of ISG expression in patients taking lower doses of GCs (figure 4). Indeed, mean ISG levels were higher in patients taking up to 25 mg prednisolone than patients not taking GCs, likely driven by the association of GC use with higher disease activity (figure 4).
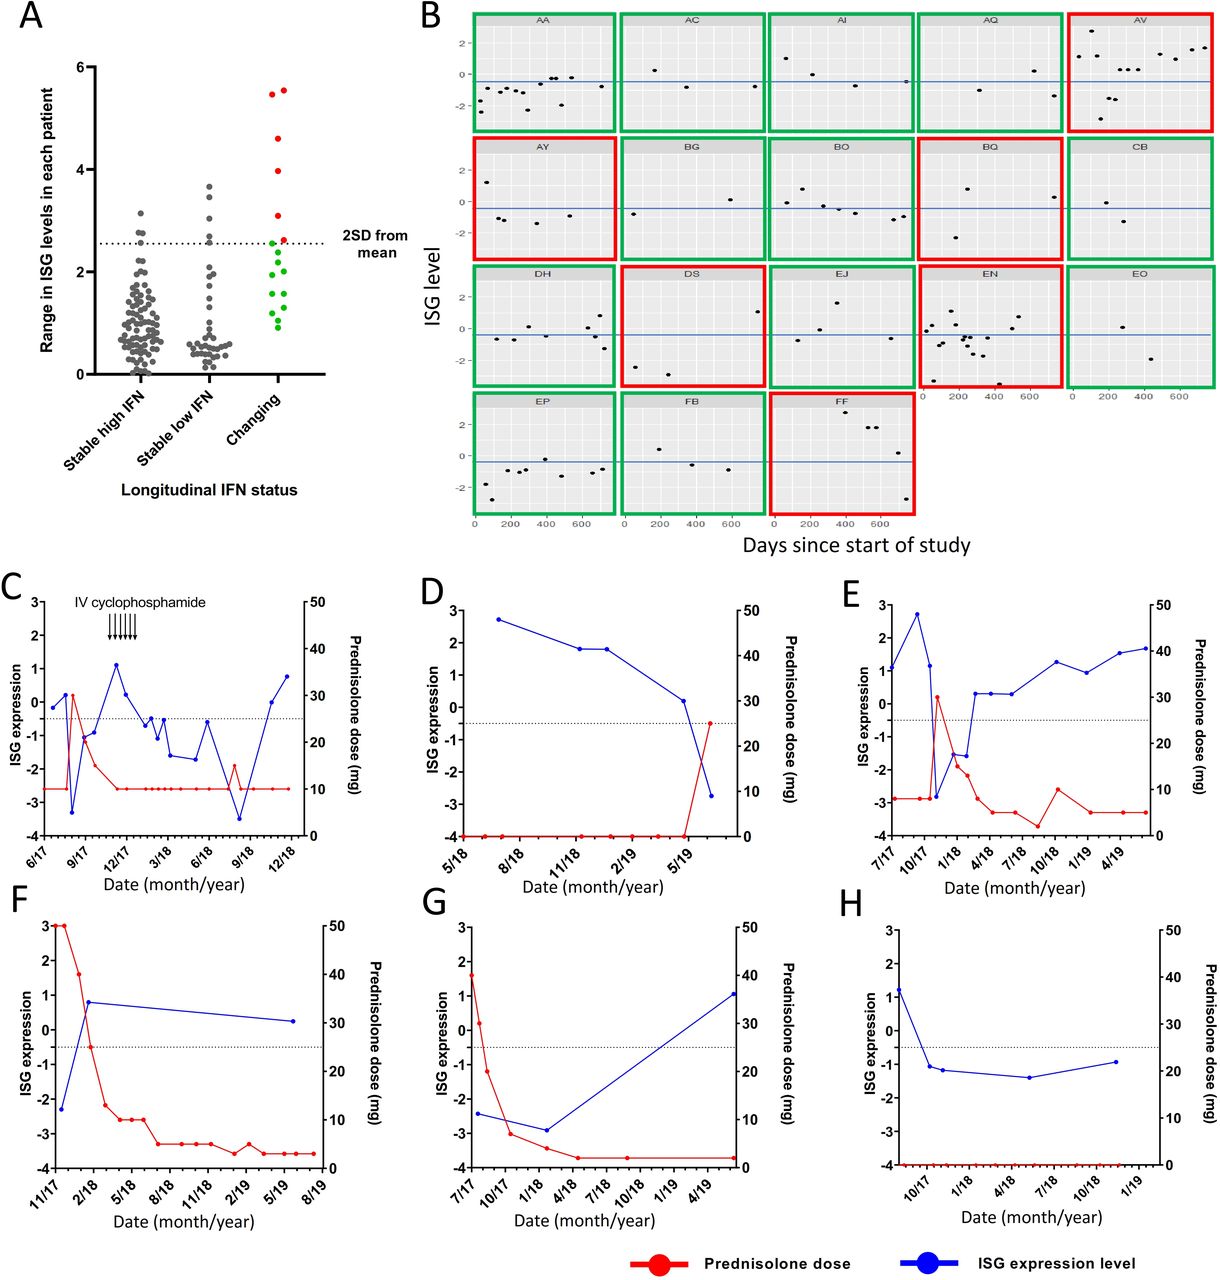
(A) Range of interferon (IFN)-stimulated gene (ISG) readings in each patient over the course of the study period. (B) ISG levels over time in patients with changing IFN status. Patients with green boxes have variation in ISG levels within 2 SDs of that seen in patients with stable IFN status. Patients with red boxes have ISG variations more than 2 SDs from that seen in patients with stable IFN status. Blue line represents cut-off between IFN high and low patients. (C–G) Patients with changing IFN status and large range of ISG levels which correlates temporarily with cyclophosphamide and glucocorticoid use. (H) A patient whose large variation in ISG expression level could not be explained by glucocorticoid use. IV, intravenous.

ISG expression in patients according to prednisolone dose. Dot colour represents patient SLEDAI at time of sample collection. *P<0.05; **p<0.01; ***p<0.001. ISG, interferon-stimulated gene; SLEDAI-2K, SLE Disease Activity Index.
Finally, we examined irreversible organ damage using SDI scores (online supplemental table S3) and HRQoL. SDI scores were available for 185 patients during the study period. There were no differences in median total SDI between the IFN high and low groups. Although patients in the low IFN group had significantly higher proportions of patients with SDI scored in the malignancy and diabetes domain than the respective IFN high groups, in multivariate analysis, these relationships attenuated. There were no differences in HRQoL as measured by SF-36 according to IFN status (data not shown).
Discussion
The role of the IFN cytokine family has become a focus of research in SLE in recent years, with 60%–80% of patients with SLE forming a distinct biological subset that overexpress ISG in peripheral blood. With the emergence of IFN-blocking therapeutics, it is important to understand whether ISG testing could be useful clinically in the management of patients with SLE, but large longitudinal studies in adult patients with SLE are lacking. In this study, we examined IFN signature status over time in a large, prospectively followed cohort of patients with SLE. We confirmed findings from a smaller previous studies that IFN status was strongly associated with differences in disease severity when IFN high and low groups overall were compared. Despite this, IFN status was remarkably stable in the majority of patients with SLE, with almost all of the small proportion of patients whose ISG changed being those treated with high-dose GCs, and ISG results did not correlate with disease activity in individual patients.
In the largest previous study, paediatric patients with SLE with high disease activity had higher expression of ISGs, however a robust correlation between disease activity and ISG expression level was not described.2 Surprisingly, longitudinal clinical associations of IFN status in adult SLE have not previously been extensively described. In a study by Landolt-Marticorena et al, 27 patients had ISG expression levels in two samples 3–12 months apart and only 3 had a change in IFN status.10 Petri et al analysed ISG expression in 15 patients measured in low disease activity and again when flaring, and found no correlation between ISG level and disease activity.23 In this study, 11 patients had three to five samples analysed, and ISG expression levels remained relatively stable in all patients despite changes in disease activity. A further study by Chiche et al studied three ISG modules in three samples from 29 patients with SLE and found stability of the strongest expressed ISG module over time, with weak correlations between disease activity and the other two ISG modules.24 Our results, the largest such study of adult SLE, suggest that variation in ISG status between patients reflects the existence of distinct IFN high and IFN low subgroups of patients with SLE, rather than reflecting time-dependent and disease activity-dependent variations in ISG.
We observed many clinical differences between IFN high and low patients, whether categorised by initial result or stable IFN status over time. IFN high patients had significantly more active disease across multiple individual organ domains, including haematuria, arthritis, skin disease, leucopenia and serological activity, and had more severe disease as indicated by composite status measures including LLDAS non-attainment and SFI. LLDAS attainment has been shown to be protective from damage accrual in SLE17 and reduced rates of LLDAS attainment in IFN high patients suggest that such patients may be at higher risk of damage over time, although the duration of follow-up in this study was insufficient to allow examination of damage accrual. IFN high patients required more immunosuppression and were more exposed to GCs, also consistent with more severe disease. The two groups were also demographically different, with the IFN high group having a higher proportion of South Eastern and North Eastern Asian patients and a younger age of onset, and the IFN low group being correspondingly more likely to be of Caucasian background. Autoantibodies including anti-Ro, anti La and anti-RNP were more common in the IFN high group, consistent with previously published smaller studies. A study by Kirou et al reported higher SLEDAI, more anti-Ro, anti-RNP, anti-Sm and anti-dsDNA antibodies and lower complement in IFN high patients among a cohort of 77 patients.8 Similarly, Feng et al reported higher SLEDAI scores and more active renal disease in IFN high patients in a cohort of 48 patients with SLE.9 A study of 94 patients with SLE by Landolt-Marticorena et al also showed more active renal disease and higher prevalence of anti-Sm and anti-RNP autoantibodies,10 and a further study of 48 patients showed high ISG expression to be associated with more severe disease manifestations.25 We were also interested to note differences in ANA staining patterns, with IFN high patients being more likely to have a speckled pattern, and IFN low patients more likely to have a homogeneous pattern, a previously unreported finding. The higher prevalence of speckled pattern ANA in the IFN high group is likely to reflect the higher prevalence of anti-Ro, anti-La, anti-Sm and anti-RNP antibodies.
Most observations we have made relate to IFN status as a stable concept. While IFN high patients as a group had a more severe phenotype, ISG measured over time did not associate with disease activity as measured by SLEDAI-2K, and change from IFN high to low status or vice versa was infrequent. Importantly, routine doses of GCs (<25 mg/day) did not impact on IFN status, suggesting it could be measured in the clinical setting regardless of GC use in the vast majority of patients. We recently reported supportive findings in a RNAseq study, where while GC-induced gene expression is heavily influenced by IFN in SLE, ISGs are scarcely affected by GCs.26 In the few patients whose IFN status changed significantly, change in ISG expression was associated with intensive GC treatment. It has previously been shown in small studies that high-dose intravenous methylprednisolone suppresses ISG in patients with SLE.3 27 A study of samples taken from three patients with SLE before and after 30 mg intravenous methylprednisolone/day for 3 days showed suppression of ISGs,3 as did another study of six patients with SLE receiving 30 mg/kg intravenous methylprednisolone.27 Only four patients had large fluctuations in ISG expression that could not be attributed to high-dose immunosuppression and all had a single higher reading among several stable lower results. The cause of one-off high ISG results in otherwise IFN low patients with SLE is unknown, however it could be hypothesised that a single high reading related to a transient viral infection.
There are several limitations of this study. While the cohort of patients involved in this study was large, there were small numbers of patients in certain subsets which limited statistical analysis in some cases. We observed patients across a 2-year period but did not capture disease activity prior to the study period, or outcomes, such as damage accrual, beyond this period. Many of our patients had long duration of disease, and further information may be gained from a focused study of patients early in their disease course. Also, here, a fixed set of ISG was measured, rather than an unbiased or more wide-angled approach. However, future clinical tests are likely to be rest on small numbers of reliably IFN-induced genes, such as those included here. We also note that comparison serum IFN protein measurement could provide an alternative method to measure IFN status, although this has been tested using highly sensitive methods in only a handful of studies to date.
Interestingly, there are studies suggesting other IFN-related biomarkers may correlate with disease activity in SLE, including IFNα levels measured by dissociation-enhanced lanthanide fluorescence immunoassay.28 IFN-associated chemokines including IP-10 and SIGLEC-10 have also been shown to associate with disease activity,29 however this does not appear to be the case uniformly across all patients.30 There are limited data investigating the relationship between these serum-based biomarkers and ISG expression. New technologies such as single molecular array assays are emerging to detect serum IFN levels, which have been notoriously difficult to measure, and this may shed further light.31
Conclusions
IFN-blocking therapies have been approved for the treatment of SLE in several regions. In the recent trials of anifrolumab, patients with overexpression of ISG had wider separation of response to the drug versus placebo.11 This raises the possibility of deployment of ISG testing in the clinical setting.
Our data suggest the majority of patients with SLE express IFN high status, particularly young patients and patients of Asian ancestry, and that IFN high patients as a group have significantly more active disease across many organ domains, as well as lower attainment of LLDAS and higher rates of flare. This suggests that IFN status has prognostic significance in the management of SLE. However, IFN status is remarkably stable across time and did not correlate with disease activity in individual patients, suggesting that a single baseline evaluation, rather than serial testing, is likely to be informative. That usual dose GC therapy does not impact on assignment of patients with SLE as IFN high or low aids applicability of such testing, with the caveat that at high GC doses, IFN signatures may be suppressed.
Data availability statement
Data are available upon reasonable request. The data underlying this article will be shared on reasonable request to the corresponding author.
Ethics statements
Patient consent for publication
Ethics approval
This study involves human participants and was approved by the Monash Health Human Research Ethics Committee (reference number: RES-20-0000-052l-61081). Participants gave informed consent to participate in the study before taking part.
References
Supplementary materials
Supplementary Data
This web only file has been produced by the BMJ Publishing Group from an electronic file supplied by the author(s) and has not been edited for content.
Footnotes
Contributors MN performed literature review. MN, EM, SJ and RK-R were involved in study design. RK and JB accessed data and samples from the Australian Lupus Registry and Biobank. MJN performed analysis of data, and MN and FV made the figures. MN and EM wrote the manuscript and all authors contributed to editing of the manuscript and approved the final manuscript. MN is responsible for the overall content as the guarantor.
Funding This study was supported by grants from the Lupus Research Alliance, New York (grant 381308 to EM) and the National Health and Medical Research Council (NHMRC), Australia (scholarship 1133155 to MJN). The interferon-stimulated gene measurement assay was funded by DxTerity Diagnostics, Rancho Dominguez, California, USA. The Australian Lupus Registry and Biobank have received sponsorship from Arthritis Victoria, AstraZeneca, UCB and Janssen.
Competing interests Outside the scope of this work, EM has received consulting fees from AbbVie, AstraZeneca, Amgen, Biogen, Bristol Myers Squibb, Eli Lilly, EMD Serono, Genetech, Janssen, Servier and UCB, and research grants from AbbVie, AstraZeneca, Bristol Myers Squibb, Eli Lilly, EMD Serono and Janssen. AH has received research grants from AstraZeneca, Merck and BMS.
Provenance and peer review Not commissioned; externally peer reviewed.
Supplemental material This content has been supplied by the author(s). It has not been vetted by BMJ Publishing Group Limited (BMJ) and may not have been peer-reviewed. Any opinions or recommendations discussed are solely those of the author(s) and are not endorsed by BMJ. BMJ disclaims all liability and responsibility arising from any reliance placed on the content. Where the content includes any translated material, BMJ does not warrant the accuracy and reliability of the translations (including but not limited to local regulations, clinical guidelines, terminology, drug names and drug dosages), and is not responsible for any error and/or omissions arising from translation and adaptation or otherwise.