Article Text

Abstract
Objectives Based on clinical and laboratory indicators, this study aimed to establish a multiparametric nomogram to assess the risk of refractory cases of SLE-related thrombocytopenia (SLE-related TP) before systematic treatment.
Methods From June 2012 to July 2021, a dual-centre retrospective cohort study of prospectively collected data of patients with SLE-related TP was conducted. The cohort data were divided into a developing set, internal validation set and external validation set. Refractory thrombocytopenia (RTP) was defined as failed to prednisone at 1 mg/kg per day with a platelet count cannot achieve or maintain higher than 50×109/L. In the developing set, a nomogram were established to predict RTP risk based on clinical characteristics and laboratory indicators by multivariable logistic regression, and its performance was assessed by receiver operating characteristic (ROC) curves, calibration curves, decision curve analysis (DCA) and clinical impact curve (CIC).
Results A total of 1778 patients with SLE were included, and 413 eligible patients were involved in the final analysis with 121 RTPs. The RTP risk assessment (RRA) model was composed of five significant risk variables: pregnancy, severity of TP, complement 3, anticardiolipin antibody-immunoglobulin G and autoimmune haemolytic anaemia. In three datasets, the AUCs were 0.887 (95% CI 0.830 to 0.945), 0.880 (95% CI 0.785 to 0.975) and 0.871 (95% CI 0.793 to 0.949), respectively. The calibration curve, DCA and CIC all showed good performance of the RRA model.
Conclusion The RRA model demonstrated good capability for assessing the refractory risk in SLE-related TP, which may be helpful for early identification and intervention.
- systemic lupus erythematosus
- epidemiology
- glucocorticoids
Data availability statement
Data are available upon reasonable request. All data that support the findings of this study are available from the corresponding author on reasonable request.
This is an open access article distributed in accordance with the Creative Commons Attribution Non Commercial (CC BY-NC 4.0) license, which permits others to distribute, remix, adapt, build upon this work non-commercially, and license their derivative works on different terms, provided the original work is properly cited, appropriate credit is given, any changes made indicated, and the use is non-commercial. See: http://creativecommons.org/licenses/by-nc/4.0/.
Statistics from Altmetric.com
WHAT IS ALREADY KNOWN ON THIS TOPIC
SLE-related refractory thrombocytopenia is difficult to identify early and could lead to poor prognosis.
WHAT THIS STUDY ADDS
An individualized treat-to-target strategy is of vital importance to improve prognosis of such patients.
An individualized treat-to-target strategy is of vital importance to improve prognosis of such patients.
This study was aimed to visualize risk of refractoriness and provide advice on second-line treatment.
HOW THIS STUDY MIGHT AFFECT RESEARCH, PRACTICE AND/OR POLICY
For patients with high risk of SLE-related refractory thrombocytopenia, early identification and an individualizsed treat-to-target strategy with second-line treatment should be emphasized.
Introduction
SLE, as the most common autoimmune disease, displays diverse clinical manifestations characterised by autoimmune inflammation with a large number of autoantibodies and immune complexes.1 Haematological involvement is one of the most common clinical manifestations of SLE and the prevalence of SLE-related thrombocytopenia (TP) is approximately 7%–40%.2–6 However, SLE-related TP is associated with other serious clinical manifestations and poor prognosis in SLE. In a Chinese SLE cohort,7 8 the 6-year survival rate of SLE-related TP patients was significantly reduced compared with that of non-TP SLE patients (88.2% vs 95.5%). The reduced survival rate of SLE-related TP patients was due to the difficulty in achieving the treatment goal of long-term remission.9
At present, the standard treatment for SLE-related TP is glucocorticoids (GCs) with or without intravenous immunoglobulin (IVIG) and immunosuppressants (ISs). However, refractory cases of failure or relapse after standard treatment are still common, and up to 60% of patients suffer from SLE-related refractory TP (RTP) at different stages of treatment.10–12 RTP implies that the treatment course would be prolonged and that the incidence of GC side effects could be greatly increased. Under these circumstances, clinicians are obliged to use second-line treatment methods, such as splenectomy or rituximab (RTX), according to the guidelines after the failure of standard treatment.13–15 While second-line therapy remains effective, it may further prolong the treatment course and greatly increase the treatment burden of patients after the failure of standard therapy. Although the clinical diagnosis of SLE-related TP remains relatively easy, it is still a challenge to identify RTP in the early stage of SLE-related TP. After a long period of GC and IS treatment, the possible accompanying infection and other adverse reactions also greatly limit the use and effectiveness of second-line treatment. Therefore, if potential RTP can be identified before standard treatment failure or recurrence of SLE-related TP, effective intervention may be more important to improve the prognosis of these patients, which is in line with the concept of treat to target.16 17
To assess the risk of possible RTP in SLE-related TP more accurately and efficiently, we established a clinical prediction model through clinical and laboratory features based on the dual-centre cohort. Moreover, development of a nomogram made the model clinically available18 to help clinicians identify and manage RTP early.
Methods
This dual-centre retrospective cohort study followed the Transparent Reporting of a multivariable prediction model for Individual Prognosis or Diagnosis (TRIPOD) guidelines19 to report the clinical prediction model and assess its performance.
Study cohort
We conducted a retrospective cohort study of prospectively collected data from 1778 patients newly diagnosed with SLE who were hospitalised in the First Hospital of Jilin University and the Second Hospital of Shanxi Medical University from June 2012 to July 2021. Among them, 927 cases were from the Department of Rheumatology of the First Hospital of Jilin University, and 851 cases were from the Department of Rheumatology of the Second Hospital of Shanxi Medical University. Patients with the following criteria were included in the study cohort and analysed: (1) met the 1997 American College of Rheumatology SLE classification criteria and/or the 2012 SLE International Collaborating Centres classification criteria20 21; (2) diagnosed with SLE-related TP with baseline platelet count less than 100×109/L; and (3) treated with 1 mg/kg prednisone (or equivalent GC) with or without IVIG and immunosuppressants (including methotrexate, azathioprine, cyclophosphamide, mycophenolate mofetil, leflunomide and tacrolimus). Patients who met one of the following criteria were excluded: (1) treatment with second-line therapy, such as blood purification therapy, RTX or eltrombopag, at baseline; (2) patients with thrombocytopenia due to known infections, such as hepatitis B virus; (3) thrombocytopenia due to aplastic anaemia, myelodysplastic syndrome or other myeloproliferative disorders; (4) drug-induced thrombocytopenia; (5) thrombotic thrombocytopenic purpura/microthrombotic vasculopathy; and (6) follow-up less than 6 months. SLE-related RTP was defined as resistant to prednisone (or equivalent GC) at 1 mg/kg per day or relapsed during prednisone tapering with a platelet count cannot achieve or maintain higher than 50×109/L.22 Severity of TP is divided into three levels: mild, moderate and severe. Severe TP was defined as platelet count less than 20×109/L and moderate TP was defined as platelet count less than 50×109/L. The baseline data were from inpatient data, and the follow-up data were from inpatient or outpatient data. The first follow-up time was 4–6 weeks after the initiation of GC-induced remission treatment or earlier when refractoriness occurred, and the subsequent follow-up time was determined by clinicians according to the actual clinical situation of patients, usually once in 2–3 months. Data review endpoints were defined as the RTP diagnosis or the end of GC tapering.
For each eligible patient, we used a structured clinical assessment protocol that included demographic characteristics, clinical manifestations, laboratory indicators, SLE subdiagnosis, SLE disease activity index and treatment regimen at baseline. The clinical manifestations, laboratory indicators, SLE disease activity index and treatment regimen adjustments were collected at each follow-up. The SLE disease activity index was assessed by SLEDAI-2K.23 Details are provided in the online supplemental data S1 for the methods.
Supplemental material
Cohort and feature processing
According to the occurrence of outcome events (RTP diagnosis), stratified random sampling was used to divide the patients of the First Hospital of Jilin University SLE cohort into a developing set (70%) and an internal validation set (30%), while eligible patients in the SLE cohort from the Second Hospital of Shanxi Medical University were all enrolled into an external validation set. To ensure the comparability of the dual-centre data, we conducted a data transform of quantitative laboratory data to qualitative data (eg, normal, abnormal, elevated and decreased) according to the reference value. For the same laboratory indicator, different detection methods in different centres and different time periods may lead to different reference value ranges. Therefore, all data transforms were conducted by the specific reference value given in the corresponding time period of each centre.
Statistical analysis
Continuous variables conforming to a normal distribution are expressed as the mean±SD, and continuous variables not conforming to a normal distribution are expressed as the median and IQR. Moreover, categorical values are expressed as frequencies and percentages. The χ2 test, Kruskal-Wallis test and Fisher’s exact test were used to compare qualitative variables. One-way analysis of variance was used to compare normally distributed quantitative variables, and a Mann-Whitney U test was used to compare abnormally distributed quantitative variables.
In the developing set, we first used univariable logistic regression to screen the possible RTP risk variables. Variables with p<0.1 were then screened by the least absolute shrinkage and selection operator (LASSO) logistic regression algorithm to determine the risk variables with nonzero coefficients. As a powerful tool to demonstrate disease risk with clinical characteristics,18 a clinical prediction model was built by backwards stepwise multivariable logistic regression analysis of the variables screened by the LASSO logistic regression algorithm and exhibited by a nomogram. Correlations among risk variables and outcomes were assessed by Spearman’s test. Validation and demonstration of the model were conducted from the following three perspectives: discrimination, calibration and clinical usefulness. The discrimination capability of the model was validated by receiver operating characteristic (ROC) curve and area under the curve (AUC). Delong’s test was used to analyse the difference between the AUCs of two ROC curves. The Hosmer-Lemeshow test was applied for the goodness of fit test, and the calibration curves were plotted to exhibit the calibration of the model. In the developing set, decision curve analysis (DCA) and clinical impact curve (CIC) analysis were performed to demonstrate the clinical usefulness of the model. Except for the first step univariable logistic regression, p≤0.05 was considered statistically significant, and all statistical tests were two-tailed. The data were analysed using R software (V.4.1.2) and SPSS V.26.0 (IBM).
Ethics
This study was specifically reviewed and approved by the Ethics Committee of the First Hospital of Jilin University and the Second Hospital of Shanxi Medical University in compliance with the Declaration of Helsinki with a waiver of informed consent (ethics application reference number: 2021-695, 2021-YX-252). Patients or the public were not involved in the design, or conduct, or reporting or dissemination plans of our research.
Results
Baseline demographic and clinical characteristics
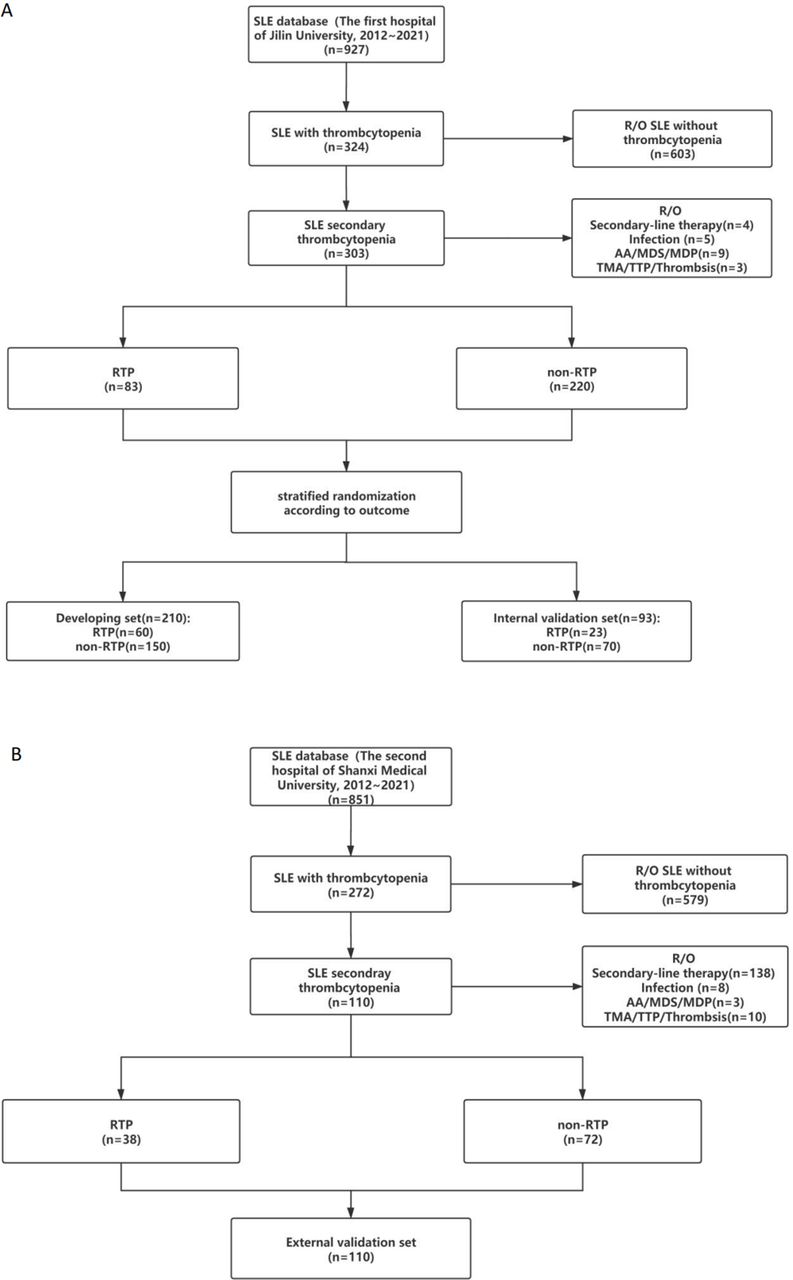
There were a total of 1778 patients with SLE in this study, and 413 eligible SLE-related TP patients were included in the final analysis (figure 1). The baseline characteristics of the developing, internal validation and external validation sets are listed in table 1. The developing set consisted of 210 cases (60 RTPs and 150 non-RTPs). The internal validation set consisted of 93 cases (23 RTPs and 70 non-RTPs), and the external validation set consisted of 110 cases (38 RTPs and 72 non-RTPs). The mean age of the patients in the whole cohort was 34.18±8.96 years old, and the female:male sex ratio was 19:1. Except for autoimmune haemolytic anaemia (AIHA), arthrosis, serositis, lupus nephritis, disease activity, decreased complement 4 (C4), anti-Sm, antinuclear antibodies-membranous pattern (ANA-M), antinuclear antibodies-nucleolar pattern (ANA-N), anticardiolipin antibody-immunoglobulin M (ACL-IgM) and anticardiolipin antibody-immunoglobulin A (ACL-IgA), the other demographic characteristics, clinical manifestations and laboratory indicators did differ among the three datasets (p>0.05, respectively). The detailed information about treatment among the three datasets also has been described in table 1 and online supplemental table S1.
Supplemental material

Flowchart. (A) SLE cohort from the first hospital of Jilin University. (B) SLE cohort from the Second Hospital of Shanxi Medical University. AA, aplastic anaemia; MDP, myeloproliferative disorder; MDS, myelodysplastic syndrome; RTP, refractory thrombocytopenia; TMA, microthrombotic vasculopathy; TTP, thrombotic thrombocytopenic purpura.
Baseline characteristics of patients included in this study
The baseline characteristics of the RTP and non-RTP subgroups among the three datasets are listed in online supplemental table S1. Compared with patients without RTP, patients with RTP showed a more frequent incidence of anaemia, AIHA, severe TP and elevated ACL-IgG among the three datasets (p<0.01). The coexistence of SLE with pregnancy and decreased C3 tended to occur more often in the RTP subgroup than in the non-RTP subgroup in the developing set and external validation set (p<0.01) but not in the internal validation set (p=0.402 and p=0.152, respectively). In the developing set, the RTP subgroup showed a higher positive rate of ANA-H (p=0.008) but not in the internal validation and external validation sets (p=0.188 and p=0.063, respectively).
Of all 413 patients, 315 (76.2%) had a bone marrow examination (table 1). In developing set and external validation set, bone marrow examination rates of patients with RTP were both higher than that of patients without RTP (p=0.038 and p=0.001, respectively) but not in the internal validation set (p=0.311, respectively). Cytomorphological examination showed either brisk proliferation or marked hyperplasia with normal granulocytic erythroid lineage. Among three datasets, there were no significant statistical difference of results of bone marrow examination between patients with and without (online supplemental table S3).
Risk variable selection and model establishment
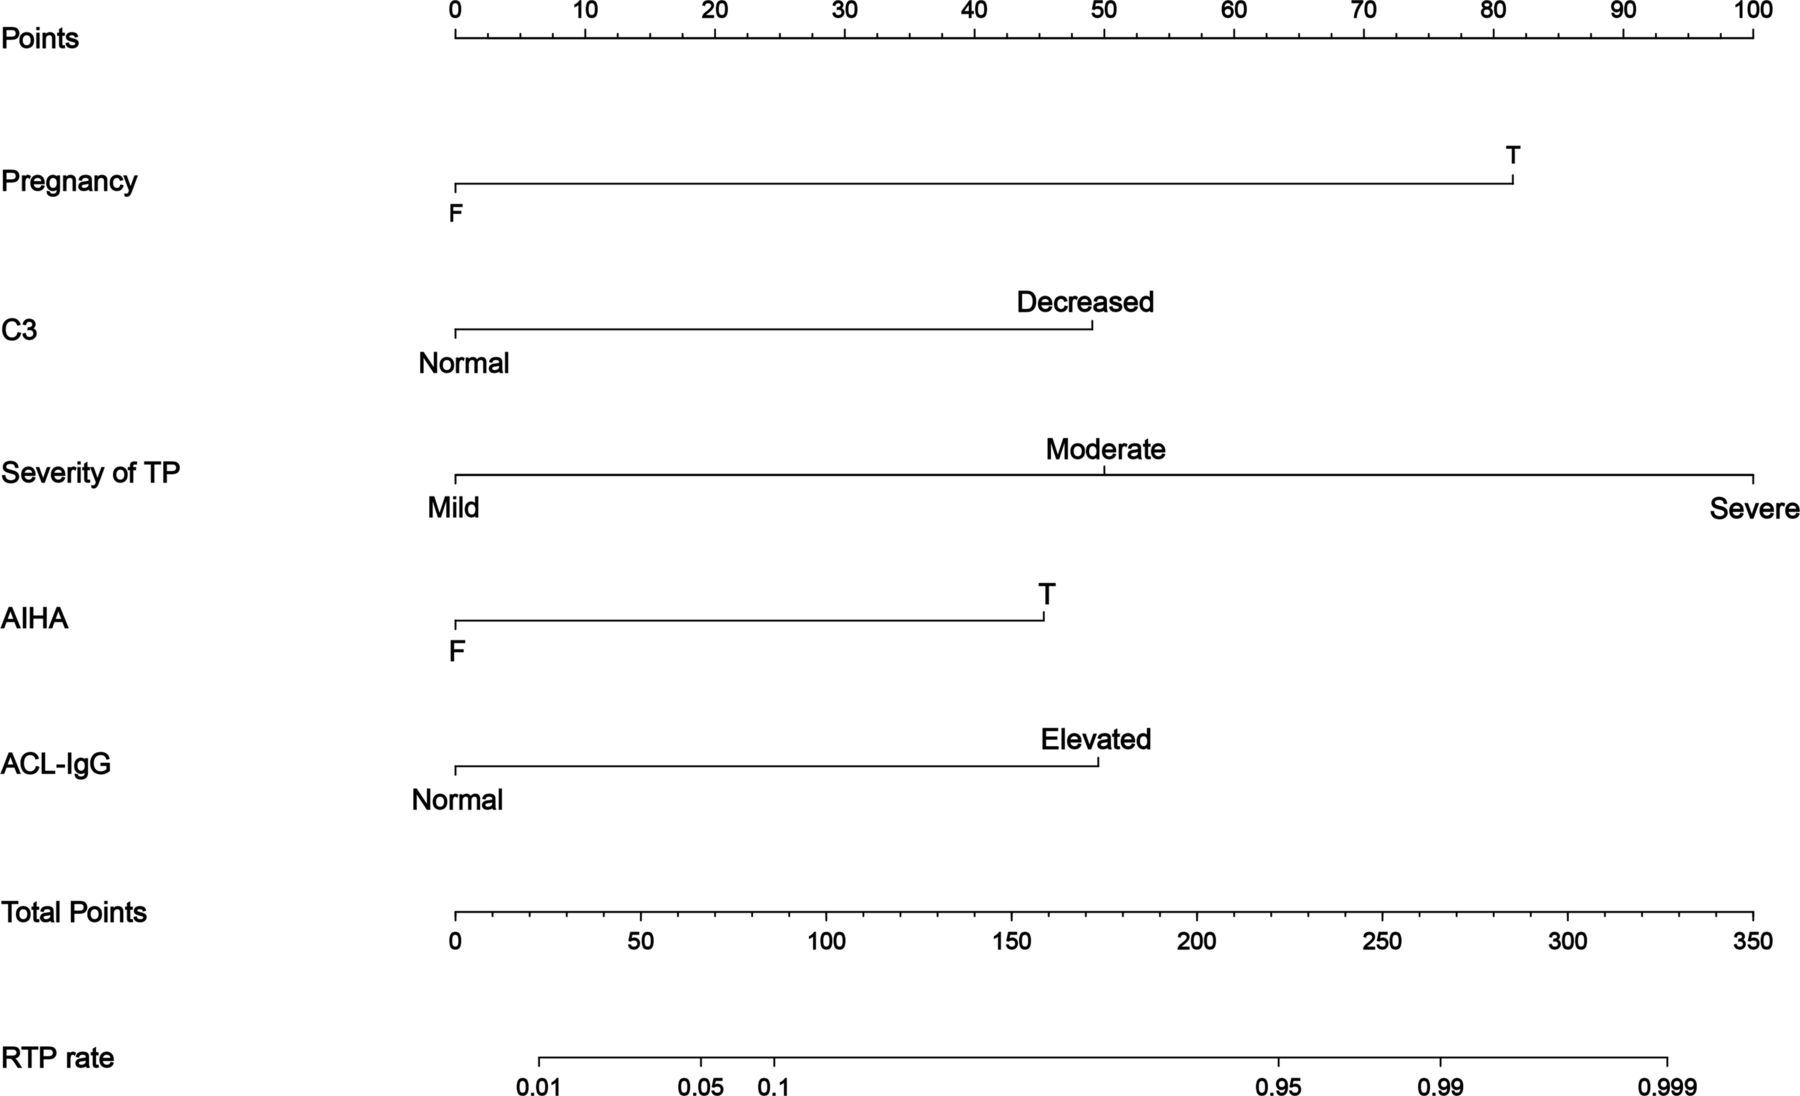
In the developing set, 121 clinical features were included in the univariable logistic regression analysis, obtaining a total of 13 possible risk variables with p<0.1 (table 2). These 13 variables were then used in the LASSO logistic regression, and 11 potential predictors with non-zero coefficients were subsequently selected (table 2); the optimal lambda (λ) value was 0.029 (log [λ]=−3.525, online supplemental figure S1A,B). The above 11 variables were analysed by backwards stepwise multivariable logistic regression analysis, and five risk variables with p<0.05 were screened. The five risk variables were pregnancy, AIHA, decreased C3, severity of TP and elevated ACL-IgG. Forest plot was drawn to show the contribution of each risk variable in the model to the outcome (online supplemental figure S2 and online supplemental table S2). Plotting the heatmap of the correlation coefficient matrix based on Spearman’s correlation analysis (online supplemental figure S3A–C) showed that RTP was positively correlated with each of the six risk variables. Based on these five risk variables, the model named ‘RTP risk assessment (RRA)’ was established, and the nomogram was plotted (figure 2). The resulting formula of the final multivariate analysis of RRA model was Ln(p/1 p)=−6.138+3.082 pregnancy +1.746 AIHA +1.798 Decreased C3 +3.206 moderate TP +4.032 severe TP +2.028 elevated ACL-IgG.

Nomogram of the RRA model. The RRA model was developed with five risk variables: pregnancy, C3, severity of thrombocytopenia, AIHA and ACL-IgG. The scale of the line segment corresponding to each risk variable in the prediction model indicates the possible value range of the risk variable, and the length of the line segment indicates the influence of the risk variable on the outcome event (RTP). Point represents the individual score corresponding to each risk variable under different values, and the total score is obtained by adding the individual scores of all risk variables. RTP rate represents the risk of RTP in individual SLE-related TP patient. ACL-IgG, anticardiolipin antibody-immunoglobulin G; AIHA, autoimmune haemolytic anaemia; C3, complement 3; RTP, refractory thrombocytopenia; TP, thrombocytopenia.
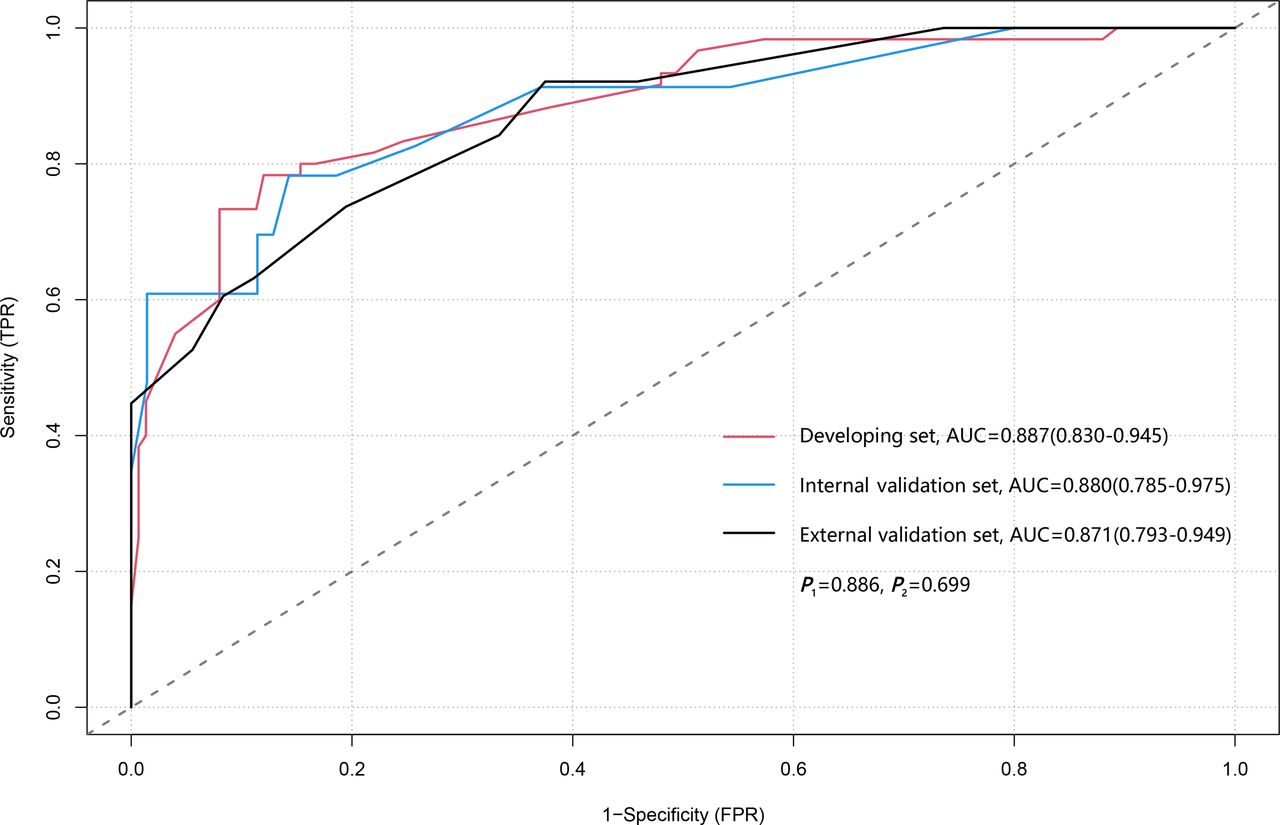
ROC curve of the RRA model. Three ROC curves plotted from the developing set, the internal validation set and the external validation set respectively, their AUCs and 95% CI have been calculated. P1 represents the AUCs’ comparison between the developing set and the internal validation set; P2 represents the AUCs’ comparison between the developing set and the external validation set. AUC, area under the curve; ROC, receiver operating characteristic; RRA, RTP risk assessment; RTP, refractory thrombocytopenia.

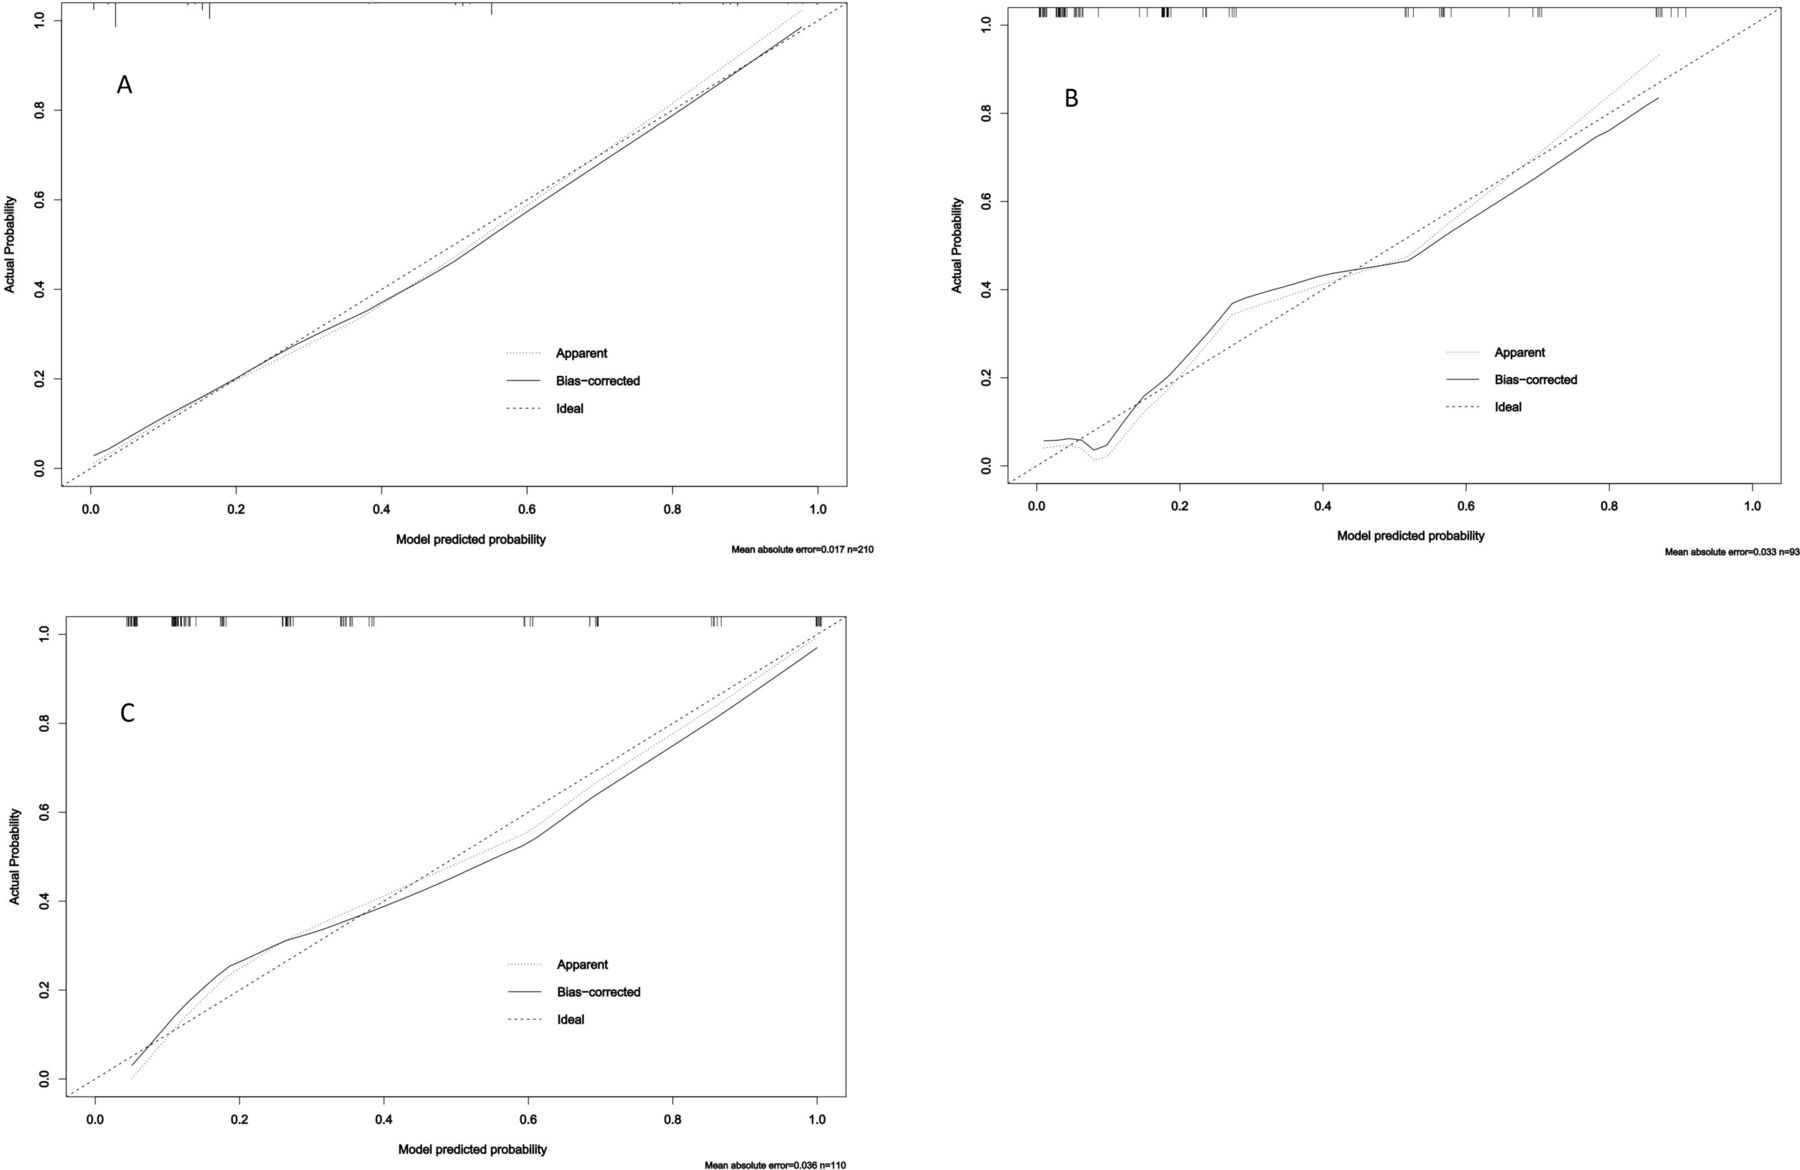
Calibration curves of the RRA model. The Y-axis of calibration plot represents the actual probability of outcome (RTP). The X-axis represents the predicted risk of RTP in current set. The ‘Apparent’ curve means uncalibrated predicting curve of the outcome probability in current set, the ‘Bias-corrected’ curve means calibrated curve and the ‘Ideal’ straight line means the perfect prediction between predicted probability and actual probability of outcome. (A) Calibration curve of the developing set. (B) Calibration curve of the internal validation set. (C) Calibration curve of the external validation set. RRA, RTP risk assessment; RTP, refractory thrombocytopenia.
Risk factors for RTP in the SLE-related TP according to univariable and LASSO logistic regression
Model assessment and performance
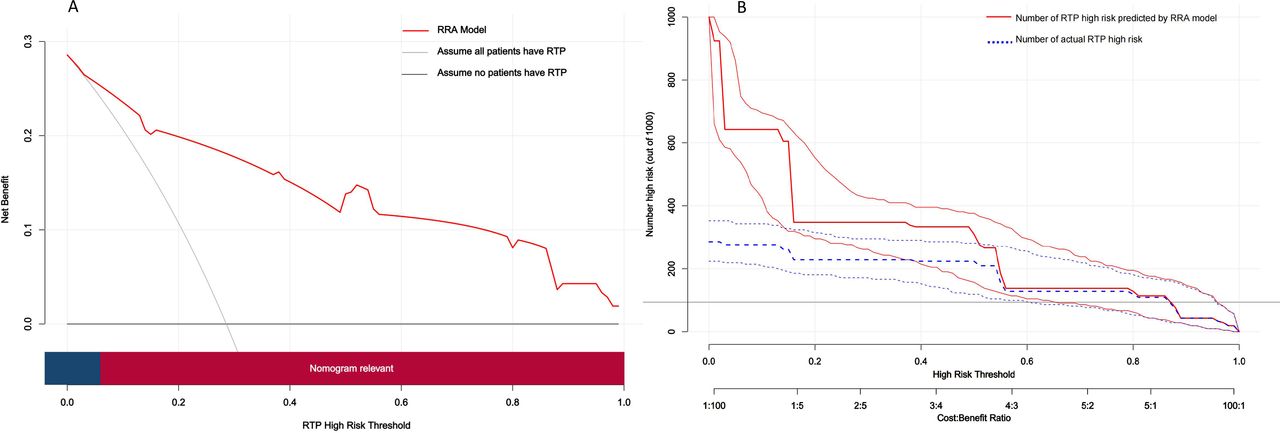
The ROC curves of the three datasets showed good sensitivity and specificity of the RRA model (figure 3). The AUCs of the development, internal validation and external validation sets were 0.887 (95% CI 0.830 to 0.945), 0.880 (95% CI 0.785 to 0.975) and 0.871 (95% CI 0.793 to 0.949), respectively. Neither the AUC of the developing set and the internal validation set nor the AUC of the developing set and external validation set differed statistically (P1=0.887 and P2=0.699, respectively). The Hosmer–Lemeshow goodness-of-fit test showed that the RRA model had acceptable calibration capability (developing set p=0.147, internal validation set p=0.390 and external validation set p=0.461). The calibration curve also illustrated good consistency of the RRA model between the predicted and actual values (figure 4A–C). DCA showed a net benefit of applying the RRA model to predict RTP in SLE-related TP compared with the ‘assume all patients have RTP’ or ‘assume no patients have RTP’ strategies at diagnostic thresholds of 0.06–1.0 (figure 5A). The CIC revealed a good cost–benefit ratio and good consistency between predicted and actual probabilities when applying the model to predictions (figure 5B).

Decision curve analysis (DCA) and clinical impact curve (CIC) of the RRA model. (A) The Y-axis of the DCA represents the net benefit and the X-axis represents the diagnostic threshold of RRA model. The grey line ‘ALL’ represents the assumption that all SLE-related TP patients had RTP and would taken further treatment, and the black line ‘NONE’ represents the assumption that no patients had RTP. The red curve represents the RRA model. At a threshold probability of >6%, the nomogram is relevant. B. The RRA model is used to predict the RTP risk of 1000 assumed SLE-related TP patients, expresses the cost: benefit ratio axis, and assign eight scales to the ratio axis, from 1:100 to 100:1. The Y-axis of the CIC represents the number of RTP and the X-axis represents the diagnostic threshold of RRA model. The blue curve represents the actual number of RTP under different diagnostic threshold, the red curve represents the predicted number of RTP. RRA, RTP risk assessment; RTP, refractory thrombocytopenia; TP, thrombocytopenia.
Discussion
RTP, as a difficult-to-treat, clinically recurrent complication of SLE, is an important reason for the poor prognosis of patients with SLE.7–9 12 However, SLE-related RTP often leads to delays in diagnosis and treatment due to difficulties in early identification, which may result in severe bleeding, infections and other severe complications or death. To the best of our knowledge, there has been no research on the early assessment and identification of SLE-related RTP. In our study, based on the clinically accessible disease characteristics of SLE-related TP patients, we established an RRA model through a dual-centre database, visualised the model and developed a nomogram to make it available for each potential patient for assessment of RTP risk,18 which may be a novel approach for the early identification of SLE-related RTP in the clinic, especially for young physicians with insufficient clinical experience.
The coexistence of SLE and pregnancy is an important alternative reason for TP in pregnancy. Pregnancy has been reported to be strongly related to flare and relapse of SLE, while the combination of SLE and pregnancy leads to a contradiction of immunosuppressive therapy, resulting in difficult treatment and a poor prognosis.24 25 Moreover, the coexistence of SLE and pregnancy may result in severe complications, such as haemolysis, elevation of liver transaminase and low platelet syndrome (HELLP) and pre-eclampsia, which may lead to a rapid decrease in platelets, invalidation of GC therapy and poor prognosis.26 Another significant characteristic of SLE during pregnancy is the strong correlation with the positive reaction of the ACL. Due to the microthrombosis caused by ACL, platelets are constantly depleted, and the probability of RTP is greatly increased if the patient has HELLP or pre-eclampsia.27 A cohort study28 reported that the onset of lupus in pregnancy is insidious and is generally identified until severe lupus complications appear in the second to third trimesters, lead to poor maternal and fetal outcomes, and it is recommended to conduct risk assessment at the beginning of pregnancy. Similarly, our study found that the coexistence of pregnancy and SLE was positively correlated with RTP risk, moreover, 18 of 22 patients with lupus in pregnancy were identified RTP later in the second to third trimesters, suggesting that clinicians should pay attention to the high risk of RTP and enhance pregnancy complication assessment and associated management in this subset of patients especially later in pregnancy.
Activation of C3 plays an important role in the pathophysiology of SLE. A longitudinal SLE cohort has reported that compared with C4, C3 is a more important marker of poor prognosis.29 Decreased C3 has been reported to serve as an independent risk factor for relapse and poor prognosis in SLE-related TP, and low C3 levels in immune thrombocytopenia are associated with severity and a tendency towards refractoriness of TP.7 30 31 In our study, an association between low baseline C3 levels and a high risk of SLE-related RTP was also found.
Haematological involvement in SLE is mainly characterised by cytopenias due to autoimmunity, including immune thrombocytopenia, anaemia and leucopenia. In our data, the combination of AIHA and TP in patients with SLE could lead to the refractoriness. The presence of multiple cytopenias in SLE suggests that clinicians should be aware of the secondary Evans syndrome. Evans syndrome is an autoimmune condition that presents with two or more cytopenias, which commonly includes AIHA and immune thrombocytopenia which reflects a state of profound immune dysregulation.32 SLE is one of the most common causes of secondary Evans syndrome. In a large proportion of patients with SLE secondary Evans syndrome, TP and AIHA occur simultaneously, and high disease activity and decreased C3 are common. As reported by a cohort study, SLE with Evans syndrome often has longer courses of induction remission therapy and more severe flares with more frequent relapses than primary Evans syndrome.33 Failure rates of GC, IS and IVIG therapy in SLE secondary Evans syndrome are relatively high, and after treatment failure or recurrence, the subsequent application of second-line treatments, such as blood purification, RTX and bortezomib, has good effects.15 34 35 Currently, Evans syndrome is still considered as a diagnosis of exclusion reflects a state of profound immune dysregulation.36 These results combined with our data suggested that clinicians should pay attention to the association between the combination of AIHA and TP and the refractoriness of the disease, meanwhile, meticulous differential diagnosis should be made to identify secondary Evans syndrome to make appropriate clinical decisions.
Through the antibody-mediated autoimmune response, ACL can lead to the destruction of platelets, of which ACL-IgG is most clearly associated with a high risk of TP.37 According to reports from case and cohort studies,26 34 38 the coexistence of pregnancy, AIHA and positive ACL in SLE can lead to a greatly increased risk of RTP, and the vast majority of such patients treated with GC, IS and IVIG have high failure rates and require the application of second-line treatments. Based on these studies and our study, we speculated that there is a positive relationship between ACL-IgG and SLE-related RTP.
Severe TP is associated with a long disease course and recurrence. In the course of relapse and retreatment, the likelihood of a poor prognosis for patients increases greatly; cohort studies have reported that severe TP has a tendency to refractoriness, and its treatment response can be predicted by bone marrow biopsy.39 In the RRA model, severe TP contributed the most to the risk of RTP, which implied that severe TP is strongly associated with RTP, suggesting that clinicians should focus on severe TP even when TP is temporarily relieved after initial GC therapy. Interestingly, due to recurrence of GC tapering, the majority of patients with mild TP who were diagnosed with RTP had baseline platelet counts between 50 and 70×109/L, suggesting that a more accurate clinical assessment is needed for this subset of patients to make a more refined treatment regimen.
Recent clinical trials and cohort studies15 35 40 have shown promising results for RTX, eltrombopag and belieumab in the treatment of SLE-related RTP with high efficiency and acceptable safety, while blood purification therapy has also been reported to have a good effect in such patients. Thus, we speculated that second-line therapy should be provided early or modestly to patients with high-risk SLE-related RTP to improve the prognosis of patients and reduce the burden of subsequent treatment under the rational consideration of indications and contraindications, which is more consistent with the precise, individualised concept of clinical decision-making based on the strategy of treatment to target.16 17
Although well designed and implemented, our research had several limitations. (1) The design of a retrospective study of prospectively collected data made the problems of data accuracy and missing data more unsatisfactory than prospective cohort studies. The regimen of each patient was restricted by the assessment of clinicians and the actual conditions of patients, which may lead to selection bias. However, the cohort study design, management and case ascertainment reduced the above shortcomings to the degree that is practically feasible in the context of an epidemiological study. (2) Although the study cohort included a population of dual-centre cohorts and the RRA model was externally validated, the small sample size increased the possibility of type II errors, which may lead to a decline in the reliability of the model. (3) Due to conditional limitations, additional analysis of antiplatelet antibodies may lead to more accurate predictions of RTP risk. In further prospective studies based on the present model, we will include more detailed multicentre data to enhance the performance and extrapolation of the model. Moreover, a prospective study on the application of second-line treatment effects to high-risk patients predicted by the RRA model could also be conducted to improve the treat-to-target strategy.
In conclusion, based on a dual-centre database, we established a clinical prediction model using clinical and laboratory data to assess the risk of refractory cases in SLE-related TP, which may contribute to early identification and intervention for SLE-related RTP in clinical practice.
Data availability statement
Data are available upon reasonable request. All data that support the findings of this study are available from the corresponding author on reasonable request.
Ethics statements
Patient consent for publication
Acknowledgments
We extend our gratitude to the Department of Rheumatology of the Second Hospital of Shanxi Medical University for their invaluable help with regard to data collection and data management.
References
Supplementary materials
Supplementary Data
This web only file has been produced by the BMJ Publishing Group from an electronic file supplied by the author(s) and has not been edited for content.
Footnotes
Contributors All authors met the authorship criteria, they had a substantial contribution to the conception or design of the work (KS, YY, QG and JJ) or the acquisition (KS, HC, HY and HW), analysis (KS, Z Jia, Z Jiang and JJ) or interpretation of data for the work (all authors) and were involved in revising a draft of this work, gave final approval of this version to be published, and are accountable for all aspects of the work in ensuring accuracy and integrity. Corresponding author (JJ) is responsible for the overall content as guarantor who accepts full responsibility for the finished work and/or the conduct of the study, had access to the data, and controlled the decision to publish. All authors have no conflicts of interest.
Funding This work was supported by the Projects for Major Science and Technology, Jilin Province, China (Project No. JLSWSRCZX2020-034 and Project No. JLSWSRCZX2020-010). All are non-profit organisations.
Competing interests None declared.
Patient and public involvement Patients and/or the public were not involved in the design, or conduct, or reporting or dissemination plans of this research.
Provenance and peer review Not commissioned; externally peer reviewed.
Supplemental material This content has been supplied by the author(s). It has not been vetted by BMJ Publishing Group Limited (BMJ) and may not have been peer-reviewed. Any opinions or recommendations discussed are solely those of the author(s) and are not endorsed by BMJ. BMJ disclaims all liability and responsibility arising from any reliance placed on the content. Where the content includes any translated material, BMJ does not warrant the accuracy and reliability of the translations (including but not limited to local regulations, clinical guidelines, terminology, drug names and drug dosages), and is not responsible for any error and/or omissions arising from translation and adaptation or otherwise.