Article Text

Abstract
Objective To explore cooperation between activated naïve (aNAV) B cells and CD4+ T cells in the pathogenesis of SLE through autoantibody production, T-cell differentiation and inflammatory cytokine secretion.
Methods Peripheral blood mononuclear cell samples were obtained from 31 patients with SLE and used to characterise phenotype of aNAV B cells (n=14) and measured the phosphorylation of B-cell receptor (BCR) signalling molecules (n=5). Upregulation of T-cell costimulatory molecules after BCR and toll-like receptor (TLR)-7/TLR-8 stimulation was detected in cells from four subjects. To explore the role of these cells in SLE pathogenesis via T cell-dependent mechanisms, four subjects were analysed to detect the promotion of CD4+ T-cell activation and antibody-secreting cell (ASC) differentiation after CD4+ T-cell–B-cell cocultures. The aNAV B cells from four patients were used to assess cytokine secretion.
Results The aNAV B cells of patients with SLE had increased expression of surface CD40, HLA-DR and interleukin-21 receptor (IL-21R) and FCRL5 molecules. With BCR stimulation, these cells greatly increased PLCγ2 phosphorylation. Integrated BCR and TLR-7/TLR-8 signals induced overexpression of CD40, CD86, IL-21R and HLA-DR on lupus aNAV B cells. In T-cell–B-cell cocultures, lupus aNAV B cells (with upregulated costimulatory molecules) promoted CD4+ T-cell proliferation and polarisation toward effector Th2 and Th17 cells. Importantly, in this coculture system, CD4+ T-cell signals enhanced aNAV B-cell differentiation into auto-ASCs and produced anti-DNA antibodies. The interaction between CD4+ T cell and aNAV B cell increased production of inflammatory cytokines (IL-6, IL-8 and IL-23).
Conclusion Cooperation between aNAV B cells and CD4+ T cells contributed to SLE pathogenesis by promoting both differentiation of pathogenic T cells (Th2 and Th17) and autoantibody secretion.
- lupus erythematosus, systemic
- B-Lymphocytes
- autoimmunity
Data availability statement
Data are available upon reasonable request. The original data presented in the study are included in the article/supplementary material; further inquiries can be directed to the corresponding author.
This is an open access article distributed in accordance with the Creative Commons Attribution Non Commercial (CC BY-NC 4.0) license, which permits others to distribute, remix, adapt, build upon this work non-commercially, and license their derivative works on different terms, provided the original work is properly cited, appropriate credit is given, any changes made indicated, and the use is non-commercial. See: http://creativecommons.org/licenses/by-nc/4.0/.
Statistics from Altmetric.com
WHAT IS ALREADY KNOWN ON THIS TOPIC
Activated naïve (aNAV) B cells display an CD11c+CXCR5−CD21− phenotype. They increase in patients with SLE flare, and their expansion correlates positively with disease activity. Functional and repertoire studies show a developmental link between aNAV and double negative 2 B cells which leads to the generation of autoreactive plasma cells. However, a full understanding of the role of aNAV B cells in SLE pathogenesis remains unclear.
WHAT THIS STUDY ADDS
This study showed that aNAV B cells, with upregulated T-cell costimulatory and FCRL5 molecules, responded to B-cell receptor (BCR) ligation leading to the phosphorylation of PLCγ2 signalling molecules. Cocultures of lupus aNAV B cells and CD4+ T cells, synergised with BCR and toll-like receptor (TLR)-7/TLR-8 signals, significantly promoted CD4+ T-cell proliferation and polarisation into Th2 and Th17 cells. The addition of IL-21 in this coculture system significantly enhanced aNAV B-cell differentiation into auto-antibody-secreting cells (ASCs) and increased anti-dsDNA antibody production. The functional role of lupus aNAV B cells in secretion of inflammatory cytokines (interleukin (IL)-6, IL-8 and IL-23) was shown.
HOW THIS STUDY MIGHT AFFECT RESEARCH, PRACTICE OR POLICY
Since aNAV B cells are precursors of auto-ASCs, inflammatory cytokine-producing cells and cooperative players in autoreactive CD4+ T-cell activation, targeting them may provide new approaches to B-cell depletion and improve SLE therapies.
Introduction
SLE is a prototypical autoimmune disease characterised by B-cell dysfunction. B cells can produce autoantibodies, serve as professional antigen-presenting cells (APCs) and produce inflammatory cytokines.1–4 For T cell-dependent autoantibody responses, B cells present autoantigen on major histocompatibility complex (MHC) class II receptors with upregulated CD80, CD86 and CD40, which prime autoreactive CD4+ T cells.5–7 During cognate T cell–B cell interactions, B cell-secreted cytokines are critical in T-cell polarisation such as toll-like receptor (TLR)-stimulated B cells secreted type I interferons (IFN-α, β).8 9 This, in turn, may prime Th1 cell induction and interleukin (IL)-6 secretion, and promote polarisation of Th17 and follicular helper T (TFH) cells. Meanwhile, activated helper T cells (CXCR5+Th2 and Th17) promote B-cell differentiation into auto-antibody-secreting cells (ASCs) and the secretion of autoantibodies.10–12 B cells also augment lupus pathology through cytokine secretion. In patients with active lupus, serum levels of B cell-derived IL-6 and tumor necrosis factor alpha (TNF-α) correlate with those of anti-dsDNA antibody and disease activity.13–15 These cytokines can help T-cell polarisation toward pathogenic Th17 cells.11 16 17 This collaboration between T and B cells is central to SLE pathogenesis.
Activated naïve (aNAV) B cells, displaying IgD+CD27−CD11c+CD21−CXCR5− or IgD+CD27−MTG+CD24− phenotype, expand during flares of SLE disease.18 19 It had been reported that aNAV and double negative 2 (DN2) B cells (CD27−IgD−CD21−CD11c+CXCR5−) in patients with SLE shared the characteristics of phenotype, function and transcriptome.18–20 The aNAV B cells may be precursors of DN2 B cells which differentiate into plasma cells via TLR-7, IFN-γ and IL-21 signalling.20 They have an open chromatin configuration in genetic regions which are important for B-cell activation and differentiation, and thereby allow binding of transcription factors.21 These findings suggest that aNAV B cells are precursors of different subsets of B cells that undergo auto-ASC differentiation and produce the autoantibodies which are central to SLE pathogenesis. However, the mechanisms and signals of this process, and the pathogenic roles of inflammatory cytokine secretion and self-antigen presentation to autoreactive T cells, remain unclear.
In this study, the expression of B-cell coreceptors and T-cell costimulatory molecules on aNAV B cells of patients with SLE was analysed. In vitro cultures were used for analysis of responses to B-cell receptor (BCR) ligation, signals that drive costimulatory capacities, and functions of aNAV B cells in cooperation with T-helper (Th) cells for promoting autoantibody secretion together with effector T-cell differentiation. The capability of aNAV B cells to secrete inflammatory cytokines was evaluated. Our findings will inform strategies for more efficacious B cell-targeted therapies.
Methods
Participants and study design
Patients with SLE were enrolled from the Department of Medicine, Ramathibodi Hospital, Bangkok, Thailand. All were older than 18 years and met the Systemic Lupus International Collaborating Clinics (SLICC) 2012 criteria or the American College of Rheumatology (ACR) 1997 criteria22 23 for SLE diagnosis and classification. Patients received standard treatment according to disease activity and degree of organ damage. Study exclusion criteria were presence of overlapping syndrome, infection or cancer. Collected data consisted of clinical manifestations, demographics and laboratory results.
Thirty-one patients with SLE were recruited into the present study. Blood samples were collected to characterise the phenotype of aNAV B cells (n=14) and to measure the phosphorylation of BCR signalling events (n=5). The upregulation of T-cell costimulatory molecules after BCR and TLR-7/TLR-8 in vitro stimulation was studied in four subjects. Blood samples from patients with SLE were used to detect CD4+ T-cell activation and ASC differentiation (n=4) and to assess cytokine secretion (n=4) after CD4+ Tcell–B cell cocultures. Healthy donors (n=21) were recruited as healthy controls (HCs) in our study. Samples from 10 subjects were analysed for aNAV B-cell phenotype and from 3 others for phosphorylation of their BCR signalling molecules; samples from 8 subjects were assessed for activation of CD4+ T cells (n=4) and for plasma cell differentiation (n=4). Additional information about study subjects is in online supplemental table S1.
Supplemental material
Cell staining and flow cytometry
Peripheral blood mononuclear cells (PBMCs) were prepared and stained with monoclonal antibodies (mAbs) according to manufacturer recommendations (described in online supplemental table S2). The characteristics of aNAV B cells were determined by staining with mAbs against CD19, CD20, CD11c, CD27, CD21, CD86, HLA-DR, CD40, interleukin-21 receptor (IL-21R), IgD, CXCR5, CCR7, FCRL4 and FCRL5. Plasma cells were identified with mAbs against CD19, CD27 and CD38. Analyses were done with a FACS Canto II flow cytometer (BD Biosciences, San Jose, California, USA).
Costimulatory molecule expression
To observe expression of T-cell costimulatory molecules on B cells after in vitro stimulation, sort-purified aNAV B cells were cultured at 2×10⁴ cells in 200 µL of R10 medium (RPMI 1640 with 10% fetal bovine serum, 2 mM L-glutamine, 100 U/mL penicillin, 100 µg/mL streptomycin, 10 mM hydroxyethyl piperazineethanesulfonic acid (HEPES)), supplemented with 1 µg/mL R848, 50 ng/mL IL-2 (PeproTech, Rocky Hill, New Jersey, USA) and 10 µg/mL calf thymus DNA (Sigma-Aldrich, St. Louis, Missouri, USA). After 24 hours’ culture, the stimulated aNAV B cells were harvested for analysis of CD40, CD86, IL-21R and HLA-DR expression by flow cytometry.
BCR signalling
PBMCs (1×10⁶) were stained with anti-CD19, anti-CD21, anti-CD27, anti-CD11c, anti-CXCR5 and anti-IgD mAbs. Cells were washed and incubated at 37°C for 30 min before adding F(ab’)2 anti-IgM and anti-IgG (Southern Biotech and Jackson ImmunoResearch, West Grove, Pennsylvania, USA) at a final concentration of 20 µg/mL and incubated at 37°C for 5 min. For detection of protein phosphorylation, cells were fixed, permeabilised and stained with mAbs specific for PLCγ2 (pY759), SYK (pY352) and BLNK (pY84) (online supplemental table S2).
In vitro CD4+ T-cell induction and proliferation
aNAV B cells and CD4+ T cells were sorted using FACSAria III (BD Biosciences). Sorted cells were cocultured in 96-well plates precoated with anti-human CD3 mAbs (BioLegend, San Diego, California, USA), in the presence of 1 µg/mL R848, 50 ng/mL IL-2, 10 µg/mL calf thymus DNA at 37°C, 5% CO2 for 5 days. Cells were harvested and assessed for T-cell proliferation and effector Th-cell polarisation by carboxyfluorescein succinimidyl ester (CFSE) proliferation assay and intracellular cytokine staining, respectively. Controls included cultures of CD4+ T cells with anti-CD3 mAbs, R848, IL-2 and calf thymus DNA. Positive controls of T-cell proliferation were stimulated with 2% (v/v) phytohaemagglutinin (Thermo Fisher Scientific, Massachusetts, USA).
For T-cell proliferation assay, CD4+T cells were labelled with 10 µM CFSE (BioLegend) before coculture. On day 5, cells were harvested and stained with Zombie Red dye, then CD4+ T-cell proliferation was determined by flow cytometry.
Intracellular cytokine staining
PBMCs or cultured CD4+T cells (n=4) were stimulated with 50 ng/mL phorbol 12-myristate 13-acetate plus 1 µg/mL ionomycin and 10 µg/mL of brefeldin A (Sigma-Aldrich) for 6 hours. Cells were then surface stained with mAbs against CD3 and CD4, and intracellularly with Abs against IFN-γ, IL-4 and IL-17 according to the manufacturer’s instructions. FACS data were acquired with a FACSCanto II and were analysed with FlowJo software.
Plasma cell differentiation
Sorted aNAV B cells (2×10⁴ cells) were cultured in RPMI media supplemented with one of three stimuli: stimuli 1 (S1), 1 µg/mL R848, 50 ng/mL IL-2 and 10 µg/mL calf thymus DNA; stimuli 2 (S2), 1 µg/mL R848, 50 ng/mL IL-2, 10 µg/mL calf thymus DNA and allogeneic CD4+ T cells (8×10⁴ cells); stimuli 3 (S3), 1 µg/mL R848, 50 ng/mL IL-2, 100 ng/mL IL-21 and 10 µg/mL calf thymus DNA in the presence of allogeneic CD4+ T cells. After culture at 37°C, 5% CO2 for 11 days, cells were harvested, and plasma and CXCR5+ B cells were counted. Culture supernatants were collected for total IgG and anti-DNA autoantibody levels.
ELISA
The total IgG and anti-DNA autoantibody levels were determined by ELISA as previously reported.18 Briefly, 1 µg/mL anti-human IgG (Mabtech, Nacka, Stockholm, Sweden) or 10 µg/mL calf thymic DNA was coated on 96-well plates and blocked with phosphate buffered saline with 10% fetal bovine serum (10% FBS–PBS). Undiluted supernatants were added to wells followed by goat anti-human IgG conjugated to horseradish peroxidase (KPL, Milford, Massachusetts, USA). Plates were developed with tetramethylbenzidine enzyme substrate and optical density was read at 450 nm. Supernatants from non-stimulated aNAV B cells were used as background.
Cytokines in culture supernatant
To assess cytokine production by aNAV B cells, sorted aNAV B cells from patients with SLE (n=4) were cultured in R10 medium in the presence of allogeneic CD4+ T cells, 1 µg/mL R848, 50 ng/mL IL-2 and 10 µg/mL calf thymus DNA at 37°C, 5% CO2 for 6 days. Culture supernatants were stained with antibodies and quantified using a multiplex bead-based assay (#740809, LEGENDplex; BioLegend). The assay detects 13 inflammatory cytokines/chemokines (IL-1β, IFN-α, IFN-γ, TNF-α, MCP-1 (CCL2), IL-6, IL-8 (CXCL8), IL-10, IL-12p70, IL-17A, IL-18, IL-23 and IL-33). Staining followed the manufacturer’s protocol. Flow cytometry was performed using BD FACSVerse (BD Biosciences). Culture supernatants from non-stimulated aNAV B cells served as controls.
Statistical analysis
Data were analysed using GraphPad Prism V.8.2.1 software (GraphPad Software, San Jose, California, USA). Group comparisons were performed using two-tailed, unpaired Mann-Whitney U tests (results presented as group median (IQR)). Group differences with p values less than 0.05 were considered statistically significant.
Results
Lupus aNAV B cells exhibited costimulatory phenotype and upregulated T-cell costimulatory molecules after BCR and TLR-7/TLR-8 stimulation
As aNAV B cells might contribute in SLE pathogenesis,18–20 we assessed whether T cells promote their activation. Expression profiles of T-cell costimulatory receptors (CD11c, CD40, CD86, HLA-DR and IL-21R), CCR7 and FCRL4 on aNAV B cells of patients with SLE and HCs were determined by flow cytometry (figure 1A and online supplemental figure S1). CD40, HLA-DR and IL-21R were significantly upregulated on aNAV B cells of patients with SLE (figure 1B and online supplemental figure S2). Expression of CD11c, CD86, CCR7 and FCRL4 was similar on cells from patients and HCs (figure 1B). Expression of CD40, HLA-DR and IL-21R on three different B-cell subsets (DN2, resting naïve (rNAV) and aNAV B cells) was significantly higher for HLA-DR and IL-21R on aNAV B cells (figure 1C). CD40 expression did not differ significantly among the B-cell subsets (figure 1C).

The aNAV B cells exhibited a costimulatory phenotype and upregulated T-cell costimulatory molecules after BCR and TLR7/8 stimulation. (A) General gating strategy for aNAV (CD19+CD27−IgD+CD21−CXCR5−), rNAV (CD19+CD27−IgD+CD21+CXCR5+) and DN2 (CD19+CD27−IgD−CD21−CXCR5−) (left) and representative histograms of CD40, HLA-DR and IL-21R expression (right) on aNAV B cells of patients with SLE (n=14) and HC (n=10). (B) MFI of CD11c, CD40, CD86, HLA-DR, IL-21R, CCR7 and FCRL4 in aNAV B cells from patients with SLE (n=14) and HCs (n=10). (C) MFI of CD40, HLA-DR and IL-21R on DN2, rNAV and aNAV B cells in patients with lupus (n=14). (D) The fold changes in MFI of CD40, CD86, IL-21R and HLA-DR on aNAV B cells from patients with lupus patients (n=4) and HCs (n=4) after in vitro stimulation (S) Stimuli: R848, IL-2 and autoantigen compared with non-stimulated cells. Bars represent median with IQR. P values were determined by Mann-Whitney U test: *p<0.05, **p<0.01. aNAV, activated naïve; BCR, B-cell receptor; DN2, double negative 2; HC, healthy control; IL, interleukin; IL-21R, interleukin-21 receptor; MFI, mean fluorescent intensity; rNAV, resting naïve.
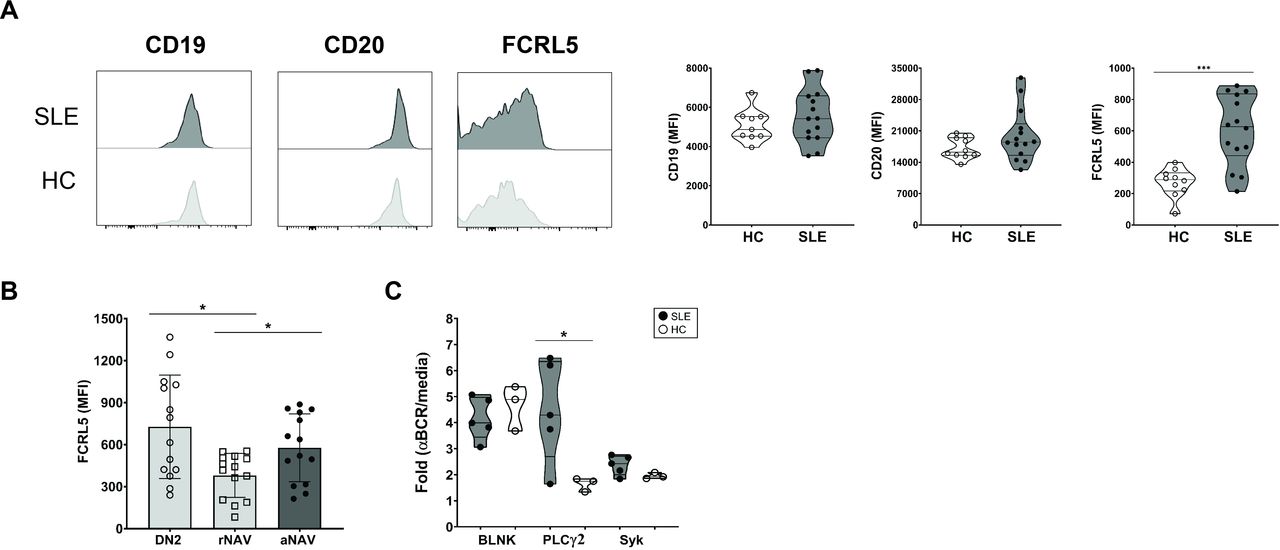
The aNAV B cells with FCRL5 overexpression greatly increased BCR signalling. (A) Representative histogram overlays for CD19, CD20 and FCRL5 (left), and MFI of CD19, CD20 and FCRL5 (right) on aNAV B cells from patients with SLE (n=14) and HCs (n=10). (B) MFI of CD19, CD20 and FCRL5 on DN2, rNAV and aNAV B cells in patients with lupus (n=14). (C) The fold changes in MFI of BLNK (Y84), PLCγ2 (pY759) and SyK (Y352) in aNAV B cells from patients with lupus (n=5) and HCs (n=3) after BCR cross-linking. Bars represent median with IQR. P values were determined by Mann-Whitney U test: *p<0.05. aNAV, activated naïve; BCR, B-cell receptor; DN2, double negative 2; HC, healthy control; MFI, mean fluorescent intensity; rNAV, resting naïve.
Since aNAV B cells of patients with SLE upregulated ex vivo expression of CD40, HLA-DR and IL-21R, costimulation of T-cell activation was assessed by determining levels of CD40, CD86, IL-21R and HLA-DR expression after TLR-7/TLR-8 ligand and autoantigen stimulation (figure 1D and online supplemental figure S3). CD86 expression was greatest, approximately sevenfold increased. Multifold increases of CD40, IL-21R and HLA-DR molecules also occurred on aNAV B cells of patients compared with HCs (figure 1D).
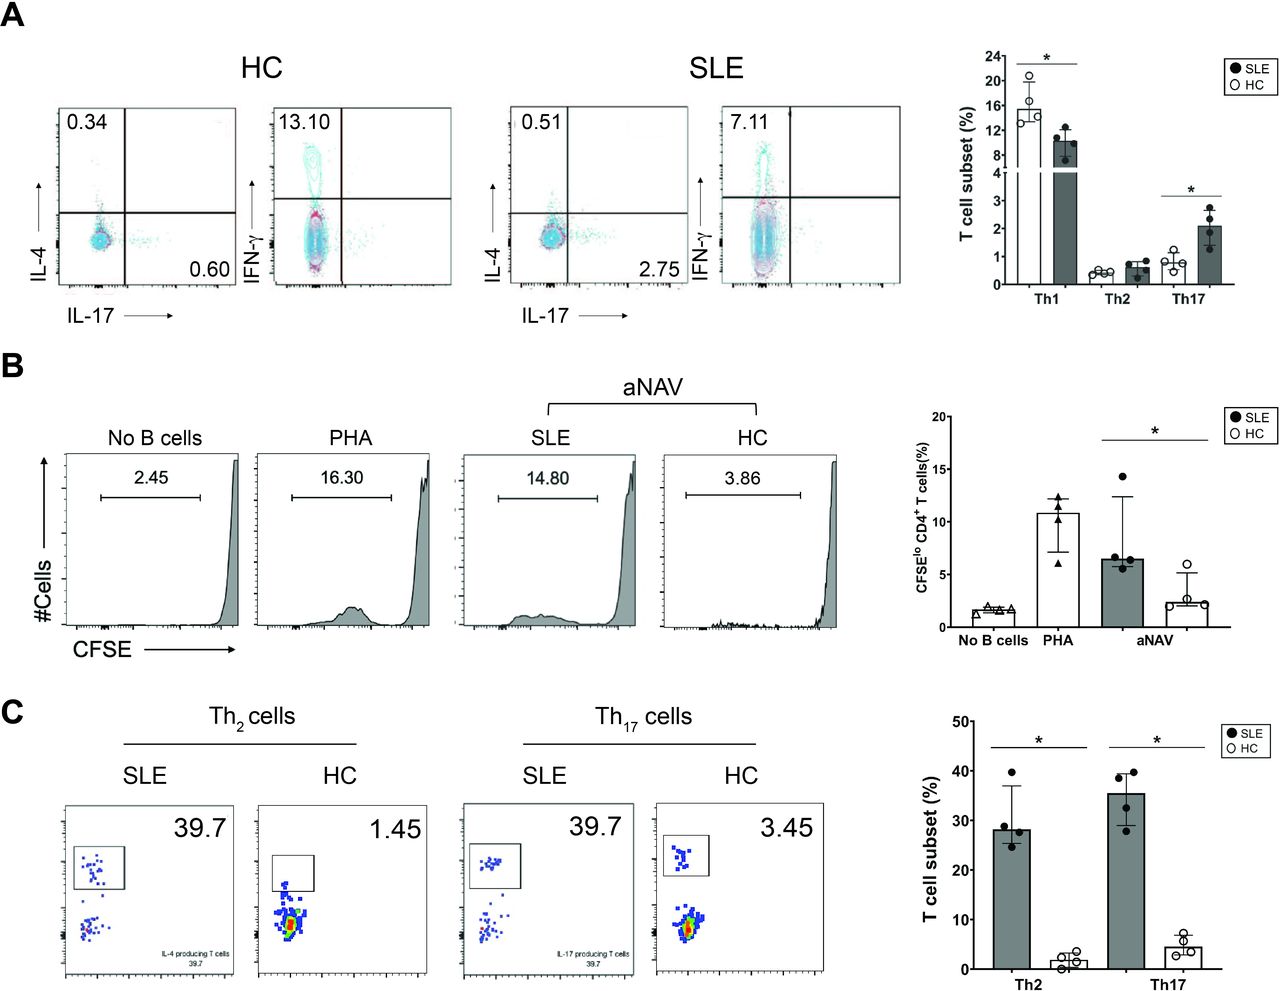
The aNAV B cells effectively induced CD4+ T-cell proliferation and Th2-cell and Th17-cell polarisation. (A) Representative dot plots showing CD4+ T cells producing IFN-γ, IL-4 or IL-17 (left), and the frequency of Th1, Th2 and Th17 cells (right) in patients with SLE (n=4) compared with HCs (n=4). (B) Representative flow cytometry plots (left) and accumulated data (right) show the ability of aNAV B cells to costimulate CD4+ T-cell proliferation. Non-B-cell stimulation (no B cells) cultures included CD4+ T cells with anti-CD3, R848, IL-2 and calf thymus DNA. PHA-stimulated CD4+ T cells served as positive control cultures (C) Flow cytometric plots (left) and accumulated data (right) show the frequency of Th2 and Th17 cells after stimulation by aNAV B cells from patients with lupus (n=4) and HCs (n=4) in the presence of anti-CD3, R848, IL-2 and calf thymus DNA in vitro cultures. Bars represent median with IQR. P values were determined by Mann-Whitney U test: *p<0.05. aNAV, activated naïve; HC, healthy control; IFN-γ, interferon gamma; IL, interleukin; PHA, phytohaemagglutinin.
Lupus aNAV B cells with FCRL5 overexpression greatly increased PLCγ2 BCR signalling
The phenotype shared by aNAV B and DN2 B cells (pre-ASCs) might be involved in autoantibody secretion.18 20 Here, the upregulation of B-cell coreceptors (CD19, CD20 and FCRL5) on these cells and their increased expression involving B cell activation via BCR stimulatory signals was assessed. FCRL5 was significantly overexpressed on aNAV B cells from lupus patients versus HCs, whereas no significant difference was found with CD19 nor CD20 (figure 2A). FCRL5 expression was greater on both DN2 and aNAV B cells than on rNAV B cells (figure 2B).
Since BCR signalling has been reported to induce FCRL5 expression and subsequently drive B-cell proliferation,24 25 phosphorylation of BCR signalling molecules was investigated. PLCγ2 expression was significantly increased in aNAV B cells from patients with lupus compared with HCs. However, no significant differences in SyK and BLNK expression were observed (figure 2C).
aNAV B cells activated CD4+ T-cell proliferation and Th2-cell and Th17-cell polarisation
Since B cells can present antigen to T cells,7 16 we explored the capability of aNAV B cells to promote T-cell activation. First, the frequency of effector CD4+T cells (Th1, Th2 and Th17) was determined in PBMCs from lupus patients. Higher cell frequencies of Th2 (SLE: 0.61% (0.37–0.78) vs HCs: 0.42% (0.36–0.48)) and Th17 (SLE: 2.10% (1.55–2.54) vs HCs: 0.79% (0.60–1.03), p<0.05) cells were found in patients with SLE compared with HCs, though only significant in the Th17-cell population (figure 3A). In contrast, the frequency of Th1 cells was decreased in lupus patients (SLE: 10.33% (8.49–11.65) vs HCs: 15.49% (13.70–18.76), p<0.05) (figure 3A). The Th2-cell and Th17-cell subsets were therefore expanded to explore the antigen presenting function of aNAV B cells in promotion of T-cell activation.
To determine whether lupus aNAV B cells, with upregulated T-cell costimulatory molecules, function as APCs for promoting T-cell activation, sorted aNAV B cells were stimulated with TLR-7/TLR-8 ligand, autoantigen and allogeneic CD4+T cells. The stimulated lupus aNAV B cells costimulated significantly more CD4+ T-cell proliferation than did aNAV B cells from HCs (SLE: 6.24% (0.28–11.20) vs HCs: 2.40% (2.06–4.32), p<0.05) (figure 3B). We next assessed the capacity of these aNAV B cells to promote the polarisation of CD4+ T cells into effector T cells. A significantly higher frequency of IL-4 (SLE: 28.21% (26.13–34.25) vs HCs: 1.89% (0.72–2.95), p<0.05) and IL-17 (SLE: 35.5% (30.15–39.10) vs HCs: 4.55% (3.06–6.44), p<0.05) containing CD4+ T cells was detected after stimulation by lupus compared with HC aNAV B cells (figure 3C).
IL-21 synergised with BCR, TLR-7/TLR-8 and CD4+ T-cell signals promoted autoantibody secretion by aNAV B cells
Since T cell–B cell interaction promotes B-cell differentiation into plasma cells,12 26 CD4+ T-cell signals might help aNAV B cells differentiate into auto-ASCs. To test this hypothesis, lupus aNAV B cells were cultured with S1, S2 or S3 (figure 4A). By receiving allogeneic CD4+ T cells in S2, these aNAV B cells generated higher frequencies of plasma cells than those given S1 (S2: 21.60% (18.90–25.00) vs S1: 5.05% (4.21–6.86), p<0.05) (figure 4B). Since our data showed IL-21R upregulation on lupus aNAV B cells, we next explored the relation of IL-21 to differentiation into auto-ASCs. The presence of IL-21 in S3 resulted in approximately 1.5-fold and 6-fold greater induction of aNAV B-cell differentiation into plasma cells compared with S2 (S3: 33.80% (25.65–41.90) vs S2: 21.60% (18.90–25.00), p<0.05) and S1 (S3: 33.80% (25.65–41.90) vs S1: 5.05% (4.21–6.86), p<0.05), respectively (figure 4B). No significant difference in the frequency of plasma cells was detected in S1, S2 or S3 cultures of lupus patients compared with HCs.
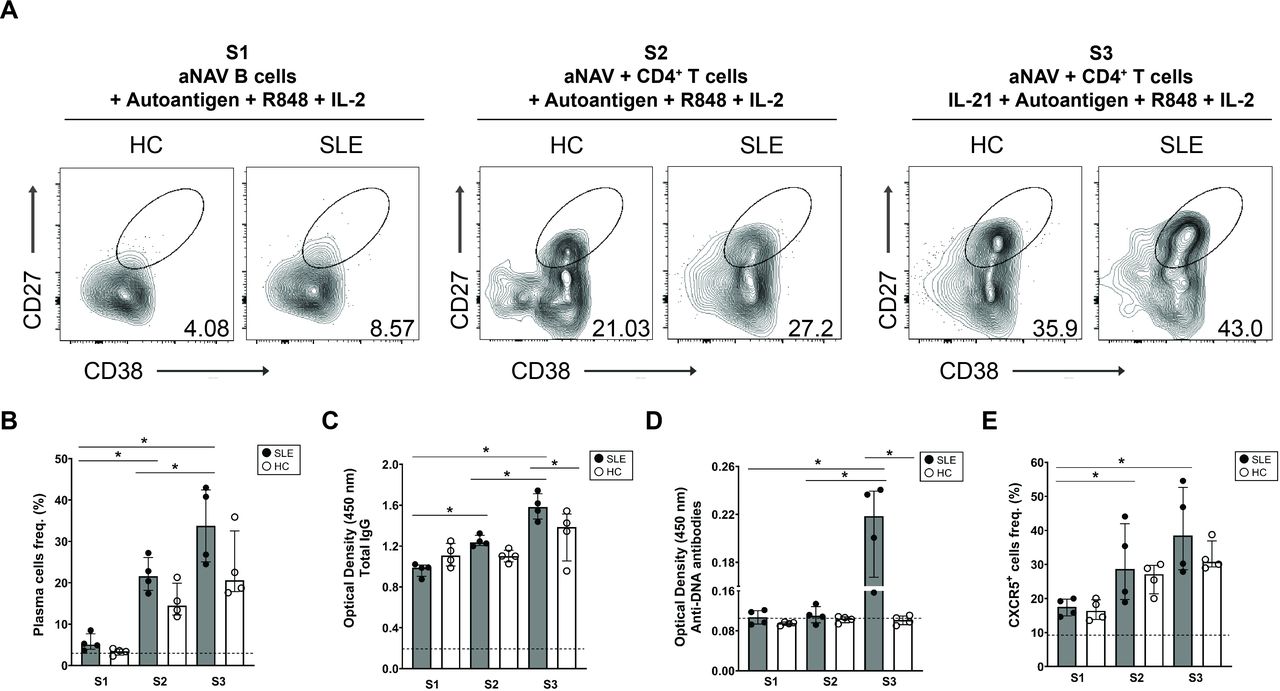
IL-21 synergised with BCR, TLR-7/TLR-8 and CD4+ T-cell signals promoted autoantibody secretion by aNAV B cells. (A) Representative flow cytometric plots indicating expression of plasma cell differentiation markers (CD27+CD38+) from aNAV B-cell cultures with one of three conditions of stimuli (S1: R848, IL-2 and autoantigen; S2: R848, IL-2 and autoantigen in the presence of CD4+ T cells; S3: R848, IL-2, autoantigen, CD4+ T cells and IL-21) are shown in patients with lupus and HCs. (B) Frequencies of plasma cells. Optimal density of (C) total IgG and (D) anti-DNA antibodies and (E) frequencies of CXCR5+ B cells were determined in each culture condition. Bars represent median with IQR. P values were determined by Mann-Whitney U test: *p<0.05. Dashed line indicates the baseline of non-stimulated aNAV B cells. aNAV, activated naïve; HC, healthy control; IL, interleukin; S1, stimuli 1; S2, stimuli 2; S3, stimuli 3.
In addition, the ability of lupus aNAV B cells to secrete autoantibodies was assessed on in vitro stimulation. Significantly higher levels of total IgG were detected in S2 cultures compared with S1 (S2: 1.23 (1.21–1.29) vs S1: 0.99 (0.93–1.01), p<0.05). The IL-21 in stimulus S3 enhanced lupus aNAV B cell secretion of IgG compared with S1 (S3: 1.58 (1.49.–1.68) vs S1: 0.99 (0.93–1.01), p<0.05) and S2 (S3: 1.58 (1.49.–1.68) vs S2: 1.23 (1.21–1.29), p<0.05) (figure 4C). Compared with HCs, lupus aNAV B cells in S3 greatly increased IgG production (SLE: 1.58 (1.49.–1.68) vs HCs: 1.38 (1.15–1.48), p<0.05) (figure 4C). The S1 and S2 stimuli did not induce aNAV B cells to produce anti-DNA antibodies. Rather, S3 with IL-21 significantly promoted secretion of anti-DNA antibodies in lupus aNAV B-cell cultures (SLE: 0.22 (0.18–0.24) vs HCs: 0.10 (0.09–0.11), p<0.05) (figure 4D).
Since cognate interaction between T and B cells promotes B-cell migration into germinal centres (GCs),26 we assessed the frequency of CXCR5-expressing B cells on in vitro stimulation. S2 significantly promoted lupus aNAV B cell differentiation into CXCR5+ B cells compared with S1 (S2: 28.70% (20.45–39.75) vs S1: 17.50% (15.20–19.60), p<0.05) (figure 4E). Adding IL-21 (along with TLR-7/TLR-8 and BCR signals) to CD4+T-aNAV B cell cocultures significantly enhanced CXCR5 expression (S3: 38.54% (29.05–50.70) vs S2: 28.70% (20.45–39.75)) and (S3: 38.54% (29.05–50.70) vs S1: 17.50% (15.20–19.60), p<0.05) (figure 4E).
CD4+ T cell–aNAV B cell interaction enhanced secretion of IL-6, IL-8 and IL-23 cytokines
To evaluate cytokine secretion by aNAV B cells from patients with SLE, 13-cytokine profiles of culture supernatants were determined, comparing stimulated with non-stimulated B cell cultures. TLR-7/TLR-8 and BCR signals did not stimulate significant cytokine production (figure 5A,B). Next, we investigated whether the interaction between CD4+T cells and aNAV B cells might promote these cells for cytokine secretion. In the presence of allogeneic CD4+T cells, the significantly higher amounts of IL-6 (12.85 pg/mL (8.76–16.45) vs 4.26 pg/mL (4.26–5.02), p<0.05), IL-8 (64.79 pg/mL (42.65–93.58) vs 19.61 pg/mL (19.61–20.19), p<0.05) and IL-23 (4.20 pg/mL (3.85–4.98) vs 1.63 pg/mL (1.54–1.79), p<0.05) were detected compared with cultures without B cells or CD4+T cells (figure 5C,D). These data indicated the cooperation between aNAV B cells and CD4+T cells could promote secretion of IL-6, IL-8 and IL-23 cytokines.

CD4+ T–aNAV B-cell interaction enhanced secretion of IL-6, IL-8 and IL-23 cytokines. The levels of inflammatory cytokines (IL-1β, IFN-α, IFN-γ, TNF-α, MCP-1 (CCL2), IL-6, IL-8 (CXCL8), IL-10, IL-12p70, IL-17A, IL-18, IL-23 and IL-33) in culture supernatants of aNAV B cells (A) with non-stimulation, (B) stimulated with autoantigen and TLR-7/TLR-8 ligand and (C) in the presence of allogeneic CD4+ T cells. (D) The levels of IL-6, IL-8 and IL-23 cytokines in optimal conditions of aNAV B–CD4+ T-cell coculture (aNAV+T) compared with only aNAV B cell and T-cell cultures. Bars represent median with IQR. P values were determined by Mann-Whitney U-test: *p<0.05. aNAV, activated naïve; IFN-α, interferon alpha; IFN-γ, interferon gamma; IL, interleukin; TNF-α, tumour necrosis factor alpha.
Discussion
The contribution of aNAV B cells to SLE pathogenesis has been documented. As precursors of auto-ASCs, they have the capacity to differentiate into DN2 B cells (which share essentially the same functional phenotype and transcriptome) and ASCs on TLR-7, IFN-γ and IL-21 stimulation.19 20 27 Recently, a study showed that aNAV B cells engage with dsDNA and that their number was positively correlated with disease activity.18 However, the exact roles of aNAV B cells in SLE pathogenesis are not clear. Our study found that lupus aNAV B cells overexpressed T cell costimulatory (CD40, HLA-DR and IL-21R) and FCRL5 molecules. These cells greatly increased PLCγ2 phosphorylation after BCR stimulation. On receipt of BCR and TLR-7/TLR-8 signals, aNAV B cells upregulated CD40, CD86, IL-21R and HLA-DR costimulatory molecules. This suggested that aNAV B cells can present antigen and deliver costimulatory signals to T cells. Notably, coculture of CD4+T and aNAV B cells, along with TLR-7/TLR-8 and autoantigen, resulted in driving T cell polarisation toward effector Th2 and Th17 cells. After receiving CD4+T cell and IL-21 signals, aNAV B cells differentiated into auto-ASCs, and increased anti-DNA autoantibody production. The study also showed that interaction of CD4+T cells and aNAV B cells promoted secretion of IL-6, IL-8 and IL-23 inflammatory cytokines. Altogether, our data documented that lupus aNAV B cells cooperate with CD4+T cells in promoting effector T cell differentiation, autoantibody production and inflammatory cytokine secretion.
The role of aNAV B cells in contributing to SLE pathogenesis remains unclear. But T cell-dependent mechanisms are known to be crucial for autoreactive memory B cells and ASC generation.28 Therefore, we hypothesised that aNAV B cells may cooperate with T cells in the pathogenesis of SLE. The phenotype of aNAV B cells in patients with SLE included elevated expression of T cell costimulatory markers (CD40, HLA-DR and IL-21R) and B cell co-receptors (FCRL5). Moreover, in vitro studies showed that dual stimulation with autoantigen and TLR-7/TLR-8 ligand promoted upregulation of CD40, CD86, IL-21R, and HLA-DR costimulatory molecules on the aNAV B cell surface, suggesting that these cells deliver costimulatory signals to T cells. In addition, these cells (with T cell costimulatory phenotypes) increased expression of proximal PLCγ2 BCR signalling molecules on crosslinking. These data indicated that the recognition of autoantigen by BCR may initiate a signalling cascade leading to aNAV B cell survival, proliferation and differentiation.29 30 Taken together, our data demonstrated that the combination of BCR and TLR-7/TLR-8 signal enhanced aNAV B cell function in antigen presentation and co-stimulated T cell responses.
T cell-dependent B cell activation is important for the generation of memory B cells and long-lived plasma cells which secrete switched high-affinity antibodies.3 28 In SLE, the mechanisms that drive aNAV B cells into GC or extrafollicular reactions are unclear. Here, aNAV B cell culture following CD4+T cell, autoantigen and TLR-7/TLR-8 ligand stimulation promoted T cell polarisation toward effector Th17 cells. These results are consistent with the correlation between Th17 cells and disease activity in lupus patients.31 32 Thus, these results suggest a potential role of aNAV B cells as APCs and in driving autoreactive T cell differentiation toward pathogenic effector Th17 cells. We also observed the function of aNAV B cells in autoantibody secretion via T cell-dependent activation. More plasma cells were detected in CD4+T cell-aNAV B cell cultures compared with those lacking T cell stimulation. Integration of IL-21 promoted differentiation of aNAV B cells into auto-ASCs and anti-DNA autoantibody secretion, as well as upregulation of CXCR5 which is critical for cell trafficking to germinal centres (GCs). The possible mechanism used by aNAV B cells in T cell-dependent activation for autoantibody secretion may be that self-antigen recognition via BCRs, cooperating with signalling of B-cell coreceptors, resulted in activation of naïve B cells. These aNAV B cells migrate to the border of T-cell zones and interact with primed TFH cells. During cognate T cell–B cell interactions, signals from T cells (CD40 ligand, IL-4 and IL-21) induce upregulation of IL-21R and CXCR5 on aNAV B cells and drive their migration into GCs.33 34 There, coordinated interactions between TFH and these B cells (via IL-21R-IL-21 and CD40-CD40L) drive the process of aNAV B-cell differentiation into autoreactive plasma cells and the secretion of autoantibodies which contributes to lupus pathogenesis. Further investigations of the mechanisms that drive aNAV B cells to differentiate into auto-ASCs are likely to improve strategies for B cell-targeted therapy.
Another central function of B cells is cytokine production. In patients with SLE, cytokines (IFN-α, IFN-β and IL-6) produced by B cells are increased.8 9 35 36 These cytokine levels positively correlate with disease activity scores, suggesting that these inflammatory mediators are involved in lupus pathogenesis.37–40 Here, our data showed that the collaboration between CD4+ T cells and aNAV B cells increased secretion of IL-6, IL-8 and IL-23 cytokines. Others suggest that B cell-derived IL-6 and IL-8 in SLE recruit macrophages to sites of inflammation, and that IL-6 and IL-23 (inflammatory mediators) promote Th17-cell differentiation.11 16 41–43 Thus, these cytokines may contribute to the pathogenesis of SLE by promoting pathogenic Th17-cell differentiation, as well as by activating and recruiting innate immune cells to sites of inflammation. Subsequently, the aberrant activation of innate immune cells, along with T and B lymphocytes, leads to systemic inflammation.1 44 Further investigation of the aNAV B-cell function involved in inflammatory cytokine (IL-6, IL-8 and IL-23) secretion and of cooperation with autoreactive Th cells, as contributors to disease pathogenesis, is needed.
The limitation of this study includes small sample sizes of patients with SLE with an active disease. Since the treatment with biologics demonstrated the depletion of the circulating B-cell population, only patients with reduced or without biological treatment were recruited in this study. In our study, in vitro culture system was established to provide proof of concept for cooperative role between aNAV B cells and CD4+ T cells in patients with SLE. Studies in larger sample sizes with different disease activity levels would help to validate these observations as well as to clarify the pathogenic role of aNAV B cells in SLE pathogenesis.
In summary, aNAV B cells of patients with SLE exhibited a costimulatory phenotype and upregulated T-cell costimulatory molecules after BCR and TLR-7/TLR-8 stimulation which led to T-cell activation and polarisation toward effector Th2 and Th17 cells. Integration of CD4+ T cell and IL-21 signals promoted aNAV B-cell differentiation into auto-ASCs and their secretion of anti-DNA autoantibodies. In addition, the collaboration between CD4+ T cell and aNAV B cells enhanced secretion of IL-6, IL-8 and IL-23 inflammatory cytokines. These findings will likely enhance understanding of aNAV B-cell function, increase knowledge of SLE aetiology and hopefully provide new avenues for B cell-targeted therapy.
Data availability statement
Data are available upon reasonable request. The original data presented in the study are included in the article/supplementary material; further inquiries can be directed to the corresponding author.
Ethics statements
Patient consent for publication
Ethics approval
This study involves human participants and was approved by ethical committee of Mahidol University (MURA 2015/731). The participants gave informed consent to participate in the study before taking part.
Acknowledgments
We are indebted to the patients with SLE for their willingness to participate in this study.
References
Supplementary materials
Supplementary Data
This web only file has been produced by the BMJ Publishing Group from an electronic file supplied by the author(s) and has not been edited for content.
Footnotes
Contributors KW designed and planned the study; performed the experiments, statistical analyses and initial data interpretations; and wrote the manuscript. PKo and CL analysed the flow cytometric data. PT, LK and PKh helped interpret the data. PN and TS collected the samples and performed laboratory analyses. PP wrote the manuscript. PC designed and planned the study, and reviewed the data, analyses, data interpretations and the final manuscript. PC supervised the findings of this project. All authors have read and approved the final manuscript.
Funding This research project is supported by Mahidol University and National Research Council of Thailand (NRCT): NRCT5-RGJ63012-121.
Competing interests None declared.
Patient and public involvement Patients and/or the public were not involved in the design, conduct, reporting or dissemination plans of this research.
Provenance and peer review Not commissioned; externally peer reviewed.
Supplemental material This content has been supplied by the author(s). It has not been vetted by BMJ Publishing Group Limited (BMJ) and may not have been peer-reviewed. Any opinions or recommendations discussed are solely those of the author(s) and are not endorsed by BMJ. BMJ disclaims all liability and responsibility arising from any reliance placed on the content. Where the content includes any translated material, BMJ does not warrant the accuracy and reliability of the translations (including but not limited to local regulations, clinical guidelines, terminology, drug names and drug dosages), and is not responsible for any error and/or omissions arising from translation and adaptation or otherwise.