Article Text

Abstract
Objective Urine proteomic approaches have shown promise in identifying biological pathways in lupus nephritis (LN) which are not captured on renal histopathology or by measurement of proteinuria alone. We investigated how the urine proteome changes with treatment response and with belimumab therapy.
Methods Urine samples from 54 Belimumab International Systemic Lupus Erythematosus–Lupus Nephritis trial participants (all with biopsy-proven LN) were collected at weeks 0, 24 and 52. At each time point, 1000 urinary proteins were quantified using antibody microarrays (Raybiotech Kiloplex), and their abundance was compared in responders (n=31) versus non-responders (n=22) and with belimumab treatment (n=28) versus standard of care therapy (n=26). Response was defined as proteinuria <500 mg/gcreatinine (cr), serum creatinine ≤1.25 times the week 0 value and prednisone ≤10 mg/day at week 52.
Results By week 52, CD163 was the urine protein with the most significant difference in abundance between complete responders (median 1.8 pg/mgcr) versus non-responders (median 8.2 pg/mgcr, p=4e-7) regardless of treatment arm. At week 24, five urinary proteins were present at a significantly lower (CD23 and Siglec-5) or higher (AIF, CRELD2 and ROR2) level in the belimumab group. Belimumab therapy was particularly associated with reduction in CD23 between week 0 and week 24 (p=0.0001).
Conclusions Reduction in urinary CD163 was strongly associated with complete renal response, confirming the results of multiple prior studies. Treatment with belimumab can be detected in the urine proteome, and further study is needed to determine whether modulation of CD23-mediated immune enhancement pathways might be implicated in LN treatment response.
- Lupus Erythematosus, Systemic
- Lupus Nephritis
- Autoimmunity
Data availability statement
Data are available upon reasonable request.
This is an open access article distributed in accordance with the Creative Commons Attribution Non Commercial (CC BY-NC 4.0) license, which permits others to distribute, remix, adapt, build upon this work non-commercially, and license their derivative works on different terms, provided the original work is properly cited, appropriate credit is given, any changes made indicated, and the use is non-commercial. See: http://creativecommons.org/licenses/by-nc/4.0/.
Statistics from Altmetric.com
WHAT IS ALREADY KNOWN ON THIS TOPIC
The urine proteome is a potential source of non-invasive biomarkers for the diagnosis and treatment of lupus nephritis (LN). It is already known that certain urinary proteins (eg, CD163) correlate with histological activity index and treatment response.
WHAT THIS STUDY ADDS
This is the first study to examine the effect of a specific medication, namely belimumab, on the urine proteome in LN. We discovered that shifts in urine proteomic profiles are seen with belimumab therapy, with results suggesting that future studies should examine whether modulation of CD23-mediated immune enhancement pathways might be implicated in LN treatment response. Additionally, reduction in urinary CD163 was strongly associated with complete renal response regardless of treatment arm, confirming the results of multiple prior studies.
HOW THIS STUDY MIGHT AFFECT RESEARCH, PRACTICE OR POLICY
Urine proteomic biomarkers may have potential uses in drug monitoring and selection. This work also presents additional evidence that the development of a urinary biomarker to predict disease response in LN may be feasible.
Introduction
Urine proteomics is a non-invasive source of novel biomarkers which may better reflect the dynamic and multidimensional immunobiology of lupus nephritis (LN) in real time. Urinary biomarkers can differentiate individuals with lupus from healthy controls with high sensitivity and specificity.1 Moreover, urinary proteins such as interleukin-16 and CD163 can non-invasively predict histological activity in LN,2–4 and longitudinal reduction in CD163 has been associated with treatment response.2 5 Alterations in the urine proteome have also suggested putative pathophysiological pathways involving extracellular matrix remodelling and neutrophil infiltration into the kidney, which may better inform our understanding and treatment of LN.6 7 There is considerable interest in developing new urinary biomarkers not only to diagnose LN but also to better monitor disease activity, predict treatment response and thereby inform dosage and selection of drug therapy.
The Belimumab International Systemic Lupus Erythematosus–Lupus Nephritis (BLISS-LN) trial was a 2-year randomised control trial which demonstrated improved renal outcomes when belimumab (vs placebo) was added to standard-of-care therapy for LN.8 Participants with biopsy-proven active LN were randomised to belimumab 10 mg/kg or placebo in addition to standard therapy with either (1) mycophenolate mofetil (MMF) or (2) cyclophosphamide (CYC) followed by azathioprine (AZA). At 104 weeks after randomisation, significantly more participants in the belimumab group exhibited a positive renal response to treatment, and risk of adverse renal events or death was lower in the belimumab group.8
Using a subset of participants in the BLISS-LN trial, we investigated how the urine proteome changes with treatment response versus no response at 1 year, how the urine proteome changes with belimumab therapy and whether any of these changes might implicate particular pathways involved in the pathophysiology of LN.
Methods
Patient population
The overall patient population in the BLISS-LN trial is described in full detail by Furie et al.8 A subset of 54 participants from the BLISS-LN trial was included in this study, where the subset used was chosen to reflect available urine samples and to represent a balance of belimumab versus placebo. Participant characteristics are summarised in table 1. Overall, this set of individuals was relatively enriched in renal responders but was otherwise similar to the full BLISS-LN cohort. There were no statistically significant demographic differences between the belimumab and placebo groups.
Demographics and clinical features of participants
Urine proteomic data
Urine samples were collected and frozen at week 0 (time of randomisation), week 24 and week 52. All urine samples were screened for 1000 urinary proteins using the Kiloplex Quantibody protein array platform purchased from Raybiotech Life (QAH-CAA-X00; Norcross, Georgia, USA), as previously described.9 These 1000 proteins include cytokines, growth factors and other soluble markers of biological processes. A full list of proteins assayed is available online (https://www.raybiotech.com/files/manual/Antibody-Array/QAH-CAA-X00.pdf). Urinary protein abundance was normalised to urine creatinine before being used in statistical analyses.
Response outcome assignment
Unfortunately, the original outcome assignments in BLISS-LN were not available to us and could not be obtained. We thus created a definition of complete renal response comparable to that used in most clinical trials. Specifically, each participant was classified as a responder (vs non-responder) if they had proteinuria of <500 mg/g, serum creatinine of ≤1.25 times the week 0 value and a prednisone dosage of ≤10 mg/day at week 52 after randomisation.
Statistical analysis
The abundance of each urinary protein was compared between patient groups (eg, responders vs non-responders) at each time point using the Wilcoxon rank-sum test with Benjamini-Hochberg correction for multiple comparisons. Given the exploratory nature of this work and the large number of proteins being assayed relative to the number of participants, we defined ‘statistical significance’ as any finding with a q value of <0.25 (ie, false discovery rate (FDR) of 25%). This generally corresponded to a nominal p value threshold of <0.001 to <0.05, depending on the analysis.
Patient involvement in research
BLISS-LN participants were not directly involved in the design or execution of this analysis.
Results
Urine proteomic signal of treatment response
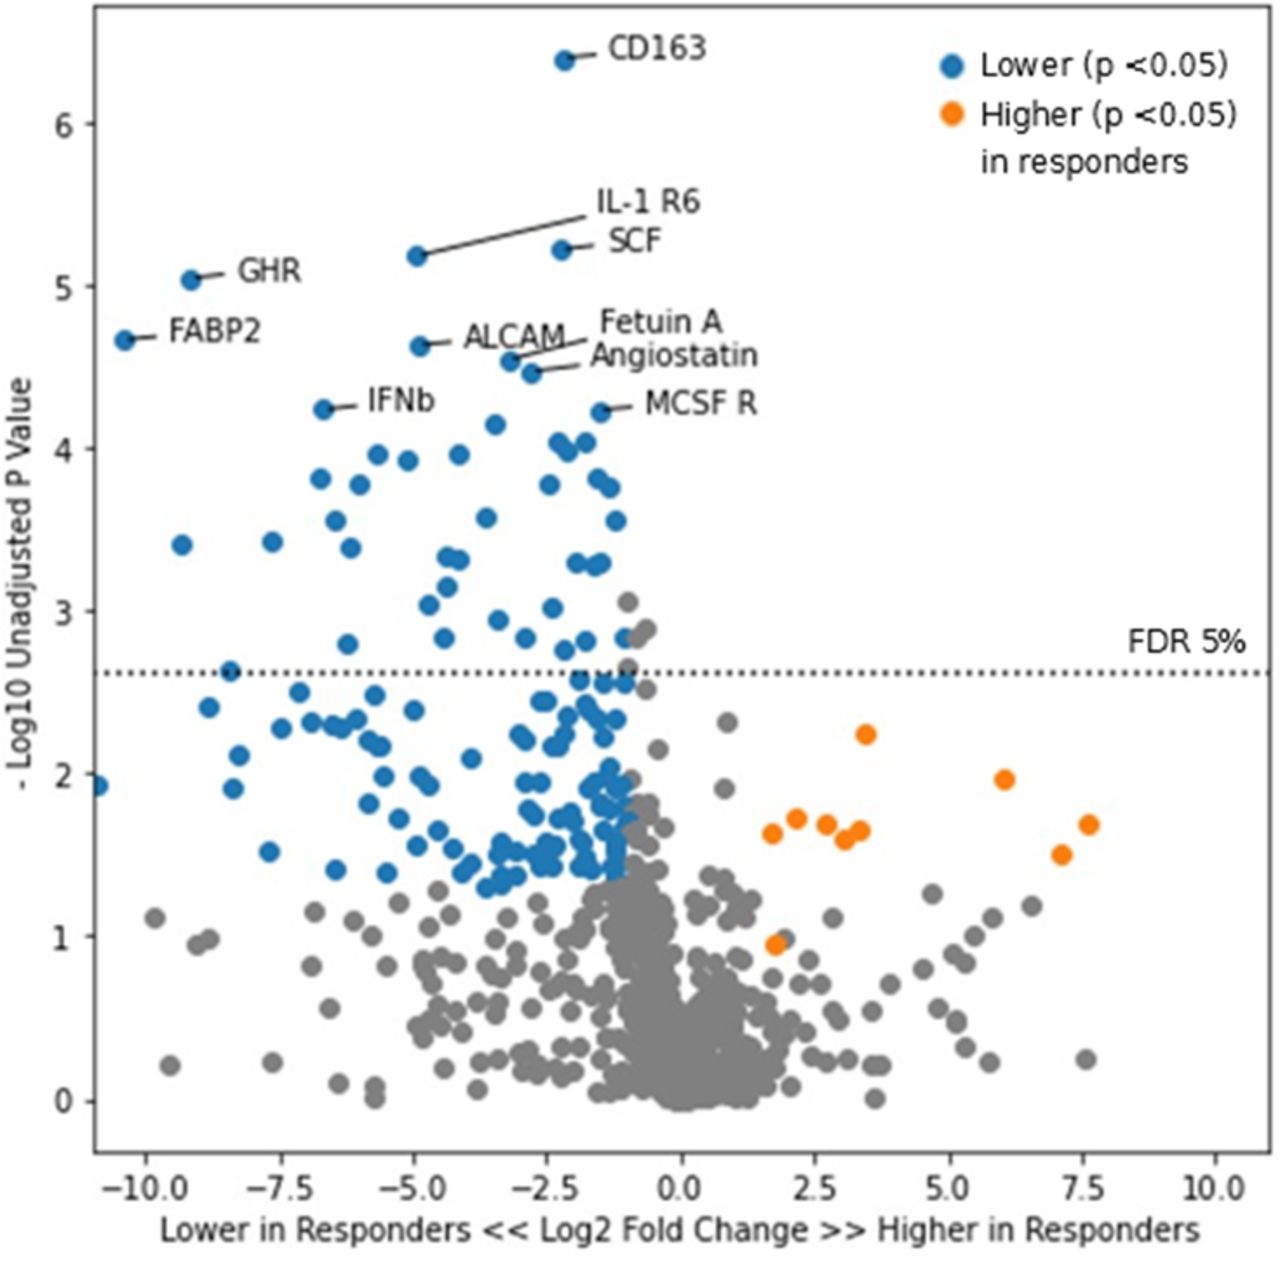
We first examined all responders versus non-responders irrespective of treatment arm. At week 0, there was no significant difference in urinary proteins between those who would become responders and those who would not. By week 52, CD163 was the urine protein with the most significant difference in abundance between responders (median 1.8 pg/mg, IQR 0.8–2.6 pg/mg) versus non-responders (median 8.2 pg/mg, IQR 4.0–48.4 pg/mg, p=4e-7, figure 1). Including CD163, a total of 199 proteins had a significantly higher or lower abundance in responders versus non-responders by week 52. These results are summarised in online supplemental table 1, which also includes an area under the curve for each protein as a summary metric of its discriminatory ability.
Supplemental material

Volcano plot of urinary proteins at time of response determination in responders versus non-responders. Points in blue represent proteins which were lower in the complete response group with a p value of <0.05. Points in orange represent proteins which were higher in the complete response group with a p value of <0.05. ALCAM, activated leucocyte cell adhesion molecule; IFNb, interferon beta; IL, interleukin.
Divergence in CD163 abundance was also observed at week 24 (not shown), though at a lower degree of significance between responders (median 3.5 pg/mg, IQR 1.1–10.4 pg/mg) and non-responders (median 17.4 pg/mg, IQR 6.2–36.1 pg/mg; p=0.002). CD163 versus time is shown in figure 2, demonstrating a longitudinal reduction in both groups, but with a more robust reduction in CD163 in complete responders.

Abundance of CD163 over time in responders (blue, n=31) and non-responders (orange, n=22). Each small circle represents one participant’s CD163 value at the given time. Thick lines represent the median CD163 value per response group at each time point.
All of the aforementioned findings were similarly found within both the belimumab and standard of care treatment subgroups (not shown). Furthermore, among all participants, the abundance of urinary CD163 did not correlate with treatment subgroup at any given time point (p=0.5 at week 24, p=0.4 at week 52). While it would be of great interest to identify a urine proteomic signal unique to those who respond specifically to belimumab, we were unable to perform a robust subgroup analysis in this fashion given the small sample size, with only 18 belimumab responders and 10 belimumab non-responders (and 1000 urinary proteins).
Urine proteomic signal of belimumab therapy
When comparing participants in the belimumab treatment arm versus those in the placebo arm, there was no significant difference in the urine proteome at week 0, as expected. At week 24, five urinary proteins—AIF, CD23, CRELD2, ROR2 and Siglec-5—were present at a significantly lower or higher level in those treated with belimumab (figure 3). A list of all proteins which were higher or lower in the belimumab group at week 24 per nominal p value of <0.05 is included in online supplemental table 2. Numerically, lower CD23 and Siglec-5 (but not higher AIF, CRELD2 or ROR2) in the belimumab group persisted into week 52, though this was no longer significant per FDR threshold (CD23 p=0.002, q=0.69; Siglec-5 p=0.004, q=0.69).
Supplemental material
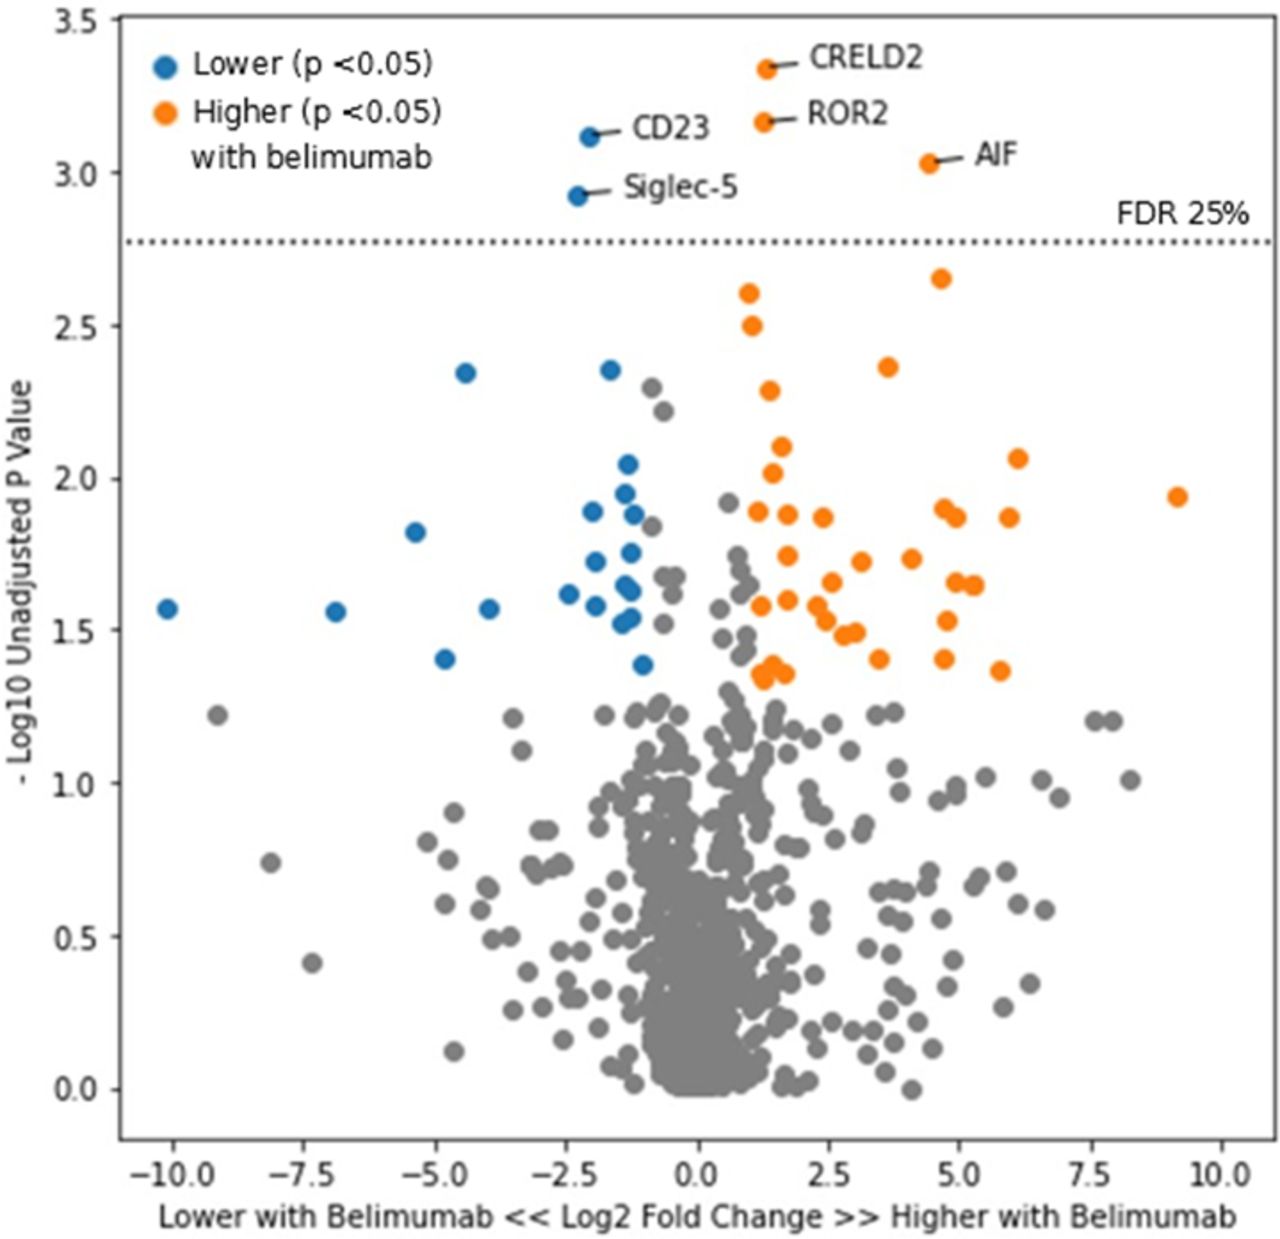
Volcano plot of urinary proteins at week 24 in the belimumab versus standard of care treatment arms. Points in orange represent proteins which were higher in those treated with belimumab and had a p value of <0.05. Points in blue represent proteins which were lower in those treated with belimumab with a p value of <0.05. FDR, false discovery rate.
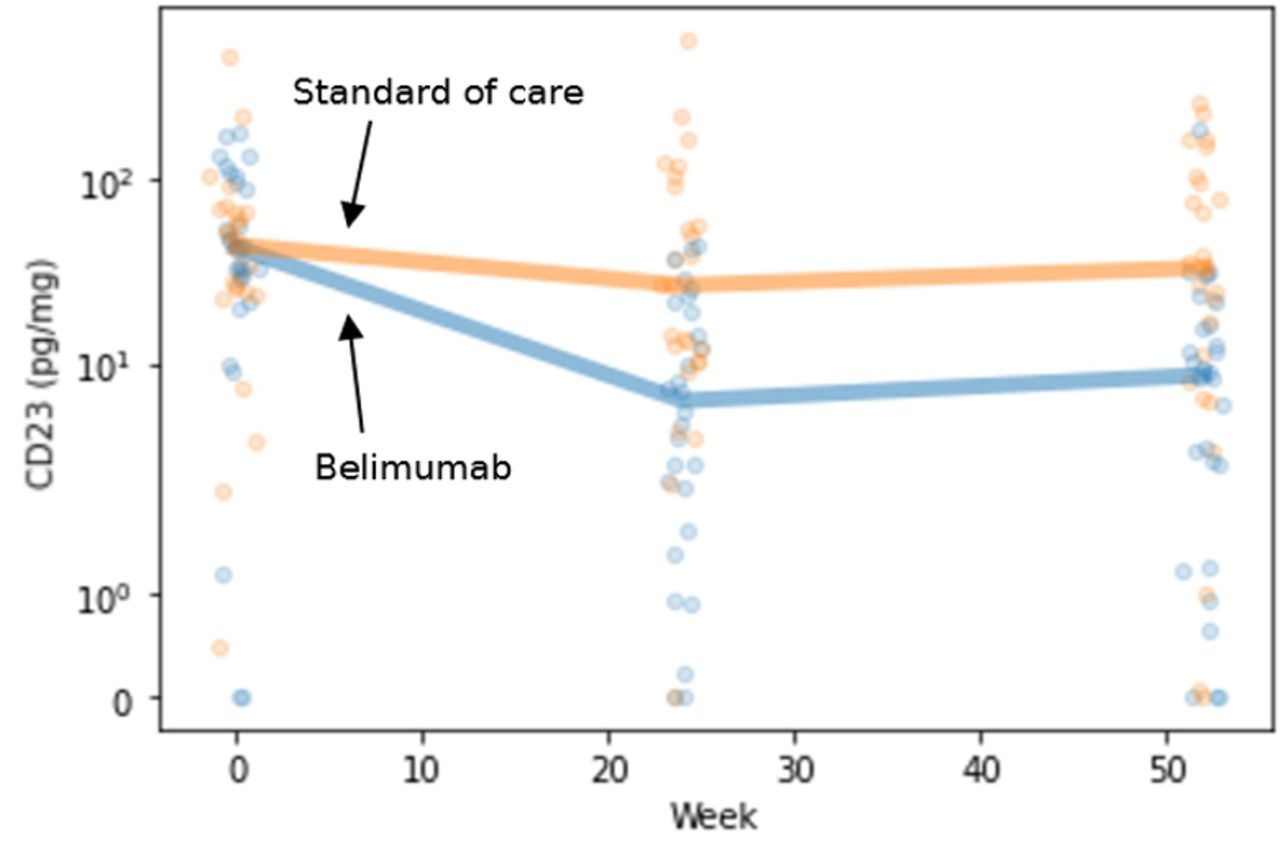
In examining these five proteins more closely, belimumab treatment was particularly associated with a negative fold change in CD23 between week 0 and week 24 (figure 4). Specifically, the median fold change was −6.02 (IQR −14.42 to −3.82) in belimumab recipients vs −1.25 (IQR −2.60 to +1.56) in the placebo arm (p=0.0001). With respect to longitudinal fold change, no other protein exhibited this behaviour. We note that CD23 did not necessarily correlate with treatment response. Among all participants, the abundance of urinary CD23 was not significantly different when comparing responders versus non-responders at any time point (p=0.9 at week 24, p=0.9 at week 52).
Abundance of CD23 over time in the belimumab (blue, n=28) and standard of care (orange, n=26) treatment groups. Each small circle represents one participant’s CD23 value at the given time. Thick lines represent the median CD23 value per group at each time point.
Additional proteomic analyses
Though limited by the small sample size of this analysis, background therapy with MMF versus CYC-AZA did not appear to have a clear effect on any of the aforementioned results; that is, there was no significant difference between any protein’s abundance when comparing MMF versus CYC-AZA in belimumab responders or non-responders, MMF versus CYC-AZA in all participants treated with belimumab, or in MMF versus CYC-AZA in all participants.
We also investigated for any association between urine proteomic profile at week 0 (time of randomisation) and renal biopsy class. At week 0, no urine proteins significantly correlated with LN class on most recent renal biopsy. We compared (1) participants with pure proliferative versus pure membranous disease and (2) participants with any proliferative (ie, pure proliferative or mixed) versus pure membranous LN. Neither approach demonstrated any differences in urine proteome based on class. We suspect that this was an artefact of the BLISS-LN study design in that week 0 urine samples were not timed to renal biopsy, which occurred up to 6 months prior to randomisation. Aside from renal biopsy class, other biopsy features such as activity index, chronicity index and the presence of thrombotic angiopathy were not assessed or stored in the original BLISS-LN data.
Discussion
We have identified several significant and mechanistically interesting changes in the urine proteome in participants in the BLISS-LN trial. To our knowledge, this is the first study of the LN urine proteome in the context of a successful LN clinical trial, and likewise the first study to examine the effect that a specific medication—belimumab, in this case—may have on urine proteomic patterns in LN. With respect to complete renal response, we have confirmed the findings of urine proteomic analyses in at least two other independent studies2 4 and thereby present additional evidence that the development of a multidimensional urinary biomarker to predict disease response in LN may be feasible. Furthermore, given the identified urinary signature associated with belimumab therapy, this work shows that treatment with specific medications can be detected in the urine proteome, and this may inform drug monitoring strategies.
With respect to renal response, longitudinal reduction in urinary CD163 abundance was strongly associated with complete response (per the definition used in the Methods) in the BLISS-LN trial regardless of treatment arm. Urinary CD163 is a macrophage marker which correlates with histological activity index on renal biopsy and has been previously associated with renal response to LN therapy in at least two independent studies, namely our prior findings in the Accelerating Medicines Partnership in Rheumatoid Arthritis/SLE4 and also those of Mejia-Vilet et al.2 As shown in figure 1, reduction in activated leucocyte cell adhesion molecule (ALCAM) and interferon beta (IFNb) were also seen in renal responders versus non-responders. Urinary ALCAM is increased in patients with SLE with nephritis, and increased concentrations of such have been associated with increased activity index on renal biopsy10 and an increased risk of decline in estimated glomerular filtration rate (eGFR).11 With respect to IFNb, this would also appear to play a role in lupus pathophysiology. A single-cell RNA sequencing analysis of renal biopsies in LN demonstrated that type I interferon response signatures were characteristic of LN and associated with failure to respond to immunosuppressive therapy.12 Anifrolumab, a type I interferon receptor antagonist, was recently approved for the treatment of SLE by the US Food and Drug Administration, though patients with severe LN were excluded from the preceding clinical trials.13 14 The phase II clinical trial of anifrolumab for LN failed to meet its primary endpoint, but a subset receiving high-intensity anifrolumab did have numeric benefit.15
These changes in the urine proteome with complete renal response were identified irrespective of belimumab therapy. We did not identify an obvious unique urinary signature predictive of response to belimumab specifically, though our small sample size limited any robust analysis along these lines. Nevertheless, these findings provide further evidence that dynamic urinary biomarkers may be used to monitor response to LN treatment in clinical practice and clinical trials.
With respect to the urinary proteomic signature of belimumab therapy, significant reduction in urinary CD23 by week 24 was most characteristic of belimumab therapy versus standard of care. CD23 is the low-affinity receptor for IgE on B cells and also regulates IgE synthesis. CD23+ B cell-mediated antigen presentation of IgE-antigen complexes has been implicated in the enhancement of antibody and CD4+ T-cell responses to said antigens.16 Anti-dsDNA IgE is common in SLE and is associated with active LN and worsened disease activity overall.17 Thus, modulation of this immune enhancement pathway might be an important mechanism of belimumab therapy. We note, however, that reduction in CD23 was not directly associated with response in this analysis, though this could be a reflection of our relatively small sample size. Further study is needed to determine whether modulation of CD23-mediated pathways might be directly implicated in LN treatment response.
It is important to note that the breadth of belimumab’s effect on the urine proteome may not be fully captured in this analysis due to the timing of urine sample collection in relation to renal biopsy and treatment initiation. In BLISS-LN, renal biopsy occurred up to 6 months before randomisation (week 0), and induction therapy with non-belimumab immunosuppression could occur up to 2 months before randomisation. In our group’s experience, urinary proteomic profiles shift significantly within the first 3 months after any treatment initiation.4 18 Thus, because of the lag time between biopsy and/or induction and week 0, initial proinflammatory urinary signals were possibly already blunted by other immunosuppressive therapy, including corticosteroids, by the time belimumab was added. This aspect of the BLISS-LN trial design also limited our ability to correlate urinary proteomic changes with renal biopsy features, as week 0 and renal biopsy were not timed to one another. As mentioned previously, urinary CD163 and ALCAM are already known to associate with renal biopsy features.2–4 10 11
There were several other limitations to this study. Only a relatively small subset of participants in the BLISS-LN trial was included in this analysis due to the need for complete data from multiple time points. We have presented a descriptive, exploratory analysis of urine proteomic changes—larger cohorts and independent datasets are needed in order to develop predictive, multidimensional (rather than single protein) biomarkers to better prognosticate and monitor disease activity. Indeed, it is inherently challenging to determine whether any single urinary protein is superior to proteinuria alone in predicting treatment response, as proteinuria itself is considered the ‘gold standard’ in current definitions of response. Additionally, individual urinary proteins are co-correlated with total proteinuria (as would be expected), though it has previously been demonstrated that total proteinuria only explains 40% of the variability in urinary CD163 and its association with treatment response.2 Within our group, additional studies are under way exploring these co-correlations and early prediction of treatment response using individual or multidimensional urinary biomarkers. Ultimately, long-term studies focused on eGFR preservation are needed to establish the utility of these biomarkers.19
Another limitation of this work is that the original outcome assignments in BLISS-LN could not be obtained, though in this case we constructed a definition of complete renal response in line with other clinical trials in LN. Finally, longitudinal renal function data—specifically, eGFR at baseline and over time—was also not available and could not be obtained. A follow-up analysis of BLISS-LN patients demonstrated that belimumab can slow eGFR decline in patients with LN as compared with standard therapy alone,20 but as these data were not available to us, we were unable to correlate urine proteomic changes to eGFR trends. Further research with larger cohorts of patients is needed to better understand how to use urine proteomic trends to predict long-term renal outcomes.
Data availability statement
Data are available upon reasonable request.
Ethics statements
Patient consent for publication
Ethics approval
Ethics approval for the original Belimumab International Systemic Lupus Erythematosus–Lupus Nephritis clinical trial was obtained as detailed by Furie et al.8 All participants consented to the collection and analysis of urine samples. Our proteomic analysis was reviewed by the Johns Hopkins IRB (IRB number IRB00142686) and was determined to not constitute human subjects research.
Acknowledgments
This manuscript is based on work presented at American College of Rheumatology Convergence 2021: 'Reduction in Urinary CD163 Is Associated with Treatment Response in the Belimumab Lupus Nephritis Trial' (abstract number 1737) and 'Treatment of Lupus Nephritis with Belimumab Is Associated with Reduction in Urinary CD23' (abstract number 1736), both authored by EW, AF, CM, DG and MP.
References
Supplementary materials
Supplementary Data
This web only file has been produced by the BMJ Publishing Group from an electronic file supplied by the author(s) and has not been edited for content.
Footnotes
Twitter @andreafava
Contributors EW completed data analyses and drafted and revised the manuscript. All authors including AF, CM, LM, DG and MP contributed significantly to conceptual refinement of the analyses performed and critical revision of the manuscript. EW and MP accept full responsibility for the finished work and conduct of the study, had access to the data and controlled the decision to publish.
Funding GlaxoSmithKline supplied samples and funding for the urine proteomic studies. EW was funded through the National Institutes of Arthritis, Musculoskeletal, and Skin Diseases (NIAMS) of the National Institutes of Health (NIH) under award number T32-AR048522. This content is solely the responsibility of the authors and does not necessarily represent the official views of the NIH or NIAMS.
Competing interests EW, CM, LM and DG: none; AF: served as a consultant to Sanofi; MP: received research funding from and/or served as a consultant to Alexion, Amgen, AstraZeneca, Aurinia, Eli Lilly, Emergent BioSolutions, Exagen, Gilead Sciences, GSK, IQVIA, Idorsia, Janssen, EMD Serono, Momenta Pharmaceuticals, PPD, Sanofi, Thermo Fisher and UCB.
Patient and public involvement Patients and/or the public were not involved in the design, conduct, reporting or dissemination plans of this research.
Provenance and peer review Not commissioned; externally peer reviewed.
Supplemental material This content has been supplied by the author(s). It has not been vetted by BMJ Publishing Group Limited (BMJ) and may not have been peer-reviewed. Any opinions or recommendations discussed are solely those of the author(s) and are not endorsed by BMJ. BMJ disclaims all liability and responsibility arising from any reliance placed on the content. Where the content includes any translated material, BMJ does not warrant the accuracy and reliability of the translations (including but not limited to local regulations, clinical guidelines, terminology, drug names and drug dosages), and is not responsible for any error and/or omissions arising from translation and adaptation or otherwise.