Article Text

Abstract
Objectives Lupus nephritis (LN) is a major cause of morbidity in patients with systemic lupus erythematosus (SLE). B cells have a central role in the pathogenesis of SLE. B lymphocyte stimulator (BLyS) and a proliferation inducing ligand (APRIL) are pivotal in B cell homeostasis. We aimed to investigate a potential role of serum BLyS and APRIL as biomarkers in LN, especially as predictors of treatment response.
Methods Sixty-four patients with active LN (52 proliferative lupus nephritis (PLN); 12 membranous LN) were included. Renal biopsies were performed at baseline and after immunosuppressive treatment. Serum levels of BLyS, APRIL and autoantibodies were measured on both biopsy occasions and in 64 individually matched controls. Renal biopsies were evaluated using the International Society of Nephrology/Renal Pathology Society classification, and scored for Activity Index and Chronicity Index. Clinical responders (CR) were required to have ≥50% reduction in proteinuria, normal or improved renal function, and inactive urinary sediment. Histopathological responders (HR) were required to have ≥50% improvement in Activity Index.
Results Baseline BLyS levels were significantly higher in LN patients compared with controls (p<0.001) and remained unchanged following induction treatment. APRIL levels were significantly higher in patients compared with controls at baseline (p=0.005) and decreased following treatment (p<0.001). Among PLN patients, APRIL levels decreased significantly only in responders (CR: p=0.009; HR: p=0.01). Baseline BLyS levels <1.5 ng/mL predicted treatment response, attaining a positive predictive value of 92% for CR with PLN at baseline.
Conclusions BLyS and APRIL were affected differently by immunosuppression; BLyS levels remained unchanged following therapy while APRIL levels decreased. Despite unchanged BLyS levels following therapy, low baseline levels predicted both clinical and histopathological improvement. Our data support APRIL as a candidate biomarker of renal disease activity in lupus patients with proliferative glomerulonephritis and point to low baseline BLyS levels predicting treatment response in LN, especially in PLN.
- Systemic Lupus Erythematosus
- Lupus Nephritis
- B cells
This is an Open Access article distributed in accordance with the Creative Commons Attribution Non Commercial (CC BY-NC 4.0) license, which permits others to distribute, remix, adapt, build upon this work non-commercially, and license their derivative works on different terms, provided the original work is properly cited and the use is non-commercial. See: http://creativecommons.org/licenses/by-nc/4.0/
Statistics from Altmetric.com
Key messages
-
Low baseline levels of BLyS predicted response to induction therapy in patients with lupus nephritis.
-
Our data support serum APRIL as a candidate biomarker of renal disease activity in lupus patients with proliferative glomerulonephritis.
-
This is one of the largest lupus nephritis cohorts with follow-up renal biopsies, allowing a reliable evaluation of treatment response based on both clinical and histopathological outcome.
Introduction
Systemic lupus erythematosus (SLE) is a chronic inflammatory autoimmune disease with a broad spectrum of manifestations and organ involvement.1 Lupus nephritis (LN) affects up to 50% of patients with SLE and is a major cause of morbidity, despite modern therapeutic approaches.2
Although a better understanding of autoimmunity in SLE has been achieved, reliable biomarkers of treatment response in both SLE and LN have yet to be found. As B cells have a pivotal role in the pathogenesis of SLE and autoantibody production, B cell activating cytokines have in recent years received increasing attention as both potential biomarkers and target molecules for new treatments.
B lymphocyte stimulator (BLyS), also known as B cell activating factor belonging to the tumour necrosis factor family (BAFF), has an important role in the activation and differentiation of B cells, as well as in the maintenance of activated B cells.3 ,4 BLyS deficient mice have been found to lack mature B cells5 while in other murine settings selective BLyS blockade prevented LN.6 Overexpression of BLyS led to autoimmune manifestations, including nephritis and arthritis.7 In human studies, patients with SLE and rheumatoid arthritis have been shown to overexpress BLyS.8–11 Renal lupus patients have also been shown to have higher levels of serum BLyS compared with SLE patients without renal involvement.12 A recent study demonstrated higher BLyS mRNA levels in glomeruli from patients with proliferative LN (PLN) compared with control tissue from pretransplant biopsies of living donors,13 indicating an important role of BLyS in this LN subset.
A proliferation inducing ligand (APRIL) is involved in the induction and maintenance of B and T cell responses.14 In murine models, overexpression of APRIL led to increased frequencies of B cells and serum levels of IgM.15 APRIL deficient mice had, contrary to BLyS deficient ones, normal B cell populations in the periphery.15 Some studies have demonstrated raised serum levels of APRIL in patients with SLE11 ,16 ,17 while in others, APRIL levels did not differ from values regarded as normal.18 APRIL levels have been shown to be lower in SLE patients with renal involvement compared with lupus patients without kidney disease,12 and APRIL mRNA levels were higher in the glomeruli of PLN patients compared with tissue from living donors.13
Given the critical role BLyS and APRIL play in B cell homeostasis, we investigated serum levels of BLyS and APRIL in patients with LN in order to clarify how these levels are affected by immunosuppressive treatment. Through comparisons with clinical data, analyses in different treatment groups and correlations with autoantibodies of known importance in renal SLE, we further aimed to evaluate serum BLyS and APRIL as candidate biomarkers in LN, including their potential role as predictors of treatment response. In one individual, serum BLyS and APRIL were assayed longitudinally on multiple renal biopsy occasions.
Methods
Patients and controls
Sixty-four patients with active biopsy ascertained LN and an equal number of population based controls, individually matched for age, sex and origin, were enrolled between 1996 and 2011 from the Rheumatology Unit of Karolinska University Hospital, Stockholm, Sweden. All patients fulfilled the 1982 revised criteria,19 as well as the Systemic Lupus International Collaborating Clinics criteria20 for classification of SLE, and participated in a prospective control programme for LN. Cohort characteristics and clinical data are presented in table 1.
Patient characteristics at baseline and at follow-up
Therapeutic regimens
Baseline renal biopsies were performed on clinical indication, at signs of active renal disease. After confirmation of active LN, patients received immunosuppressive induction therapy with corticosteroids combined with cyclophosphamide (CYC, n=45), mycophenolate mofetil (MMF, n=11), rituximab (RTX, n=7) or azathioprine (n=1). The CYC regimen comprised monthly intravenous pulses of 0.5–1 g according to the modified National Institutes of Health protocol,21 except for one patient who was given low dose CYC, as proposed in the Euro-Lupus Nephritis Trial.22 The RTX regimen was given in combination with CYC in patients with CYC resistant PLN,23 or as intravenous infusions of 1 g at week 0 and week 2 in cases where CYC was regarded as inappropriate. For evaluation of treatment response, a follow-up was conducted at 6 months or after completion of induction treatment (mean 8.1 months). At this time, patients underwent a follow-up renal biopsy, with the exception of one patient who declined due to trepidation.
A woman with renal lupus was followed longitudinally from the time of the first biopsy ascertained LN. Renal biopsies were performed on six different occasions, either at clinical signs of active nephritis or for evaluation of treatment outcome. The patient was also included in the main study cohort, with the first biopsy as baseline and the second as follow-up. The treatment regimens given as induction or remission maintenance therapy varied during the course of the observation, depending on the biopsy results and clinical assessment. The regimens included CYC, MMF, RTX (combined with CYC) and plasmapheresis (performed on seven occasions). Concurrently with these regimens, the patient was on antimalarials and low dose oral corticosteroids during the entire observation period.
Evaluation of histopathology, renal function and SLE disease activity
Renal biopsies were performed by ultrasound guided percutaneous puncture. Renal tissue was evaluated using light microscopy, immunofluorescence and electron microscopy. All renal biopsies were assessed by the same pathologist (BS) according to the International Society of Nephrology/Renal Pathology Society (ISN/RPS) classification system for LN,24 and scored for Activity Index (AI) and Chronicity Index (CI).25
Global disease activity was assessed using the SLE Disease Activity Index 2000 (SLEDAI-2K).26 The patients' urinary status was evaluated on each biopsy occasion by urine test strips and urinary sediment. Proteinuria was estimated by 24 h urine albumin excretion (g/day). Renal function was assessed by plasma creatinine concentration (μmol/L) and by the estimated glomerular filtration rate, as determined by the Modification of Diet in Renal Disease Study equation.27
Estimation of BLyS and APRIL levels
Serum from patients was collected before starting (baseline) and after completion of the induction treatment (follow-up), as well as on each biopsy occasion for the patient followed longitudinally. Serum from controls was collected at recruitment. Sera were cryopreserved at −80°C. Serum levels of BLyS and APRIL were determined by ELISA (R&D Systems Inc, Minneapolis, Minnesota, USA, and eBioscience Inc, San Diego, California, USA, respectively) following the manufacturers’ instructions.
Determination of autoantibody and complement component levels
Serum levels of antibodies to double stranded DNA (anti-dsDNA; reference values <5 IU/mL) were measured by Luminex, a multiplex flow immunoassay (BioPlex 2200; Bio-Rad Laboratories Inc, Hercules, California, USA). Levels of antibodies to complement component 1q (anti-C1q; reference values <14 U/mL) were determined by ELISA (Alegria; Orgentec Diagnostika GmbH, Germany).
Levels of complement components 3 (C3; reference range 0.67–1.29 g/L) and 4 (C4; reference range 0.13–0.32 g/L) were determined by nephelometry.
Definitions of clinical and histopathological response
In line with the American College of Rheumatology response criteria for proliferative and membranous renal disease in SLE clinical trials,28 clinical responders (CR) were required to fulfil three conditions: (i) at least 50% reduction in proteinuria, (ii) normal or, if abnormal at baseline, improved renal function (≥25% increase in estimated glomerular filtration rate) and (iii) inactive urinary sediment (≤5 red blood cells/high power field, ≤5 white blood cells/high power field and no cellular casts).
Patients fulfilling these three criteria were additionally divided into clinical complete responders (CCR) and clinical partial responders (CPR), based on the follow-up proteinuria level. CCR should have levels <0.2 g/day, whereas levels between 0.2 and 2 g/day signified CPR.
Patients showing at least 50% improvement in AI were considered histopathological responders (HR). Lack of signs of active inflammation in the follow-up renal biopsy (ISN/RPS class I, II, III C or IV C) signified histopathological complete responders (HCR), while HR with remaining active lesions or a concurrent membranous pattern (ISN/RPS class III A, III A/C, IV A, IV A/C or V) were regarded as histopathological partial responders (HPR).
Statistics
Statistical analyses were performed with the IBM SPSS Statistics V.21 software (IBM Corp, Armonk, New York, USA). For comparisons between baseline and follow-up, the non-parametric Wilcoxon matched pairs test was used. The same test was used for comparisons between patients and controls, as they were individually matched. Comparisons between independent samples were made using the Mann–Whitney U test. A p value <0.05 was considered statistically significant. Correlation analyses were performed using Spearman's rank correlation coefficient. For autoantibody levels, data were bounded by the detection limits of the assays, being unable to measure levels below and above these limits. For analysis of such censored data, the values were set to half the lower limit or twice the upper limit, respectively.
To investigate the performance of BLyS and APRIL as predictors of response, receiver operating characteristic (ROC) curve analysis was used with baseline values as classifiers. By varying the cut-off threshold, a ROC curve was constructed to evaluate the candidate predictor and determine the optimal threshold value.
Ethics
Written informed consent was obtained prior to recruitment from all individuals participating in the study. The study protocol was reviewed and approved by the regional ethics committee at Karolinska Institutet, Stockholm, Sweden.
Results
Evaluation of renal biopsies
At baseline, 52 patients had PLN (ISN/RPS class III or IV), 10 of whom also showed a membranous pattern (class V), and 12 patients had pure membranous LN (MLN). After induction therapy, 17 patients showed improvement to class I or II, although one had a persisting MLN pattern, 26 had class III or IV, 15 had pure MLN, 4 showed patterns of both PLN and MLN, and 1 patient had a glomerural vasculitis pattern. Median AI at baseline and follow-up was 5 (range 0–13) and 2 (range 0–12), respectively, while median CI was 1 (range 0–6) at baseline and 2 (range 0–8) at follow-up. Changes in both AI and CI were statistically significant (p<0.001) (table 2).
Results of the study
Safety aspects
Adverse events following renal biopsies were minor and few. Of 127 renal biopsies, 4 (3.1%) led to ultrasound verified bleeding. One of these patients required transfusion with 2 units of packed red blood cells. In 11 cases (8.7%), patients experienced pain at the biopsy site. In these cases, the pain lasted a few hours and was responsive to either paracetamol or narcotic analgesia. No infections were noted (table 2).
Serum levels of BLyS and APRIL
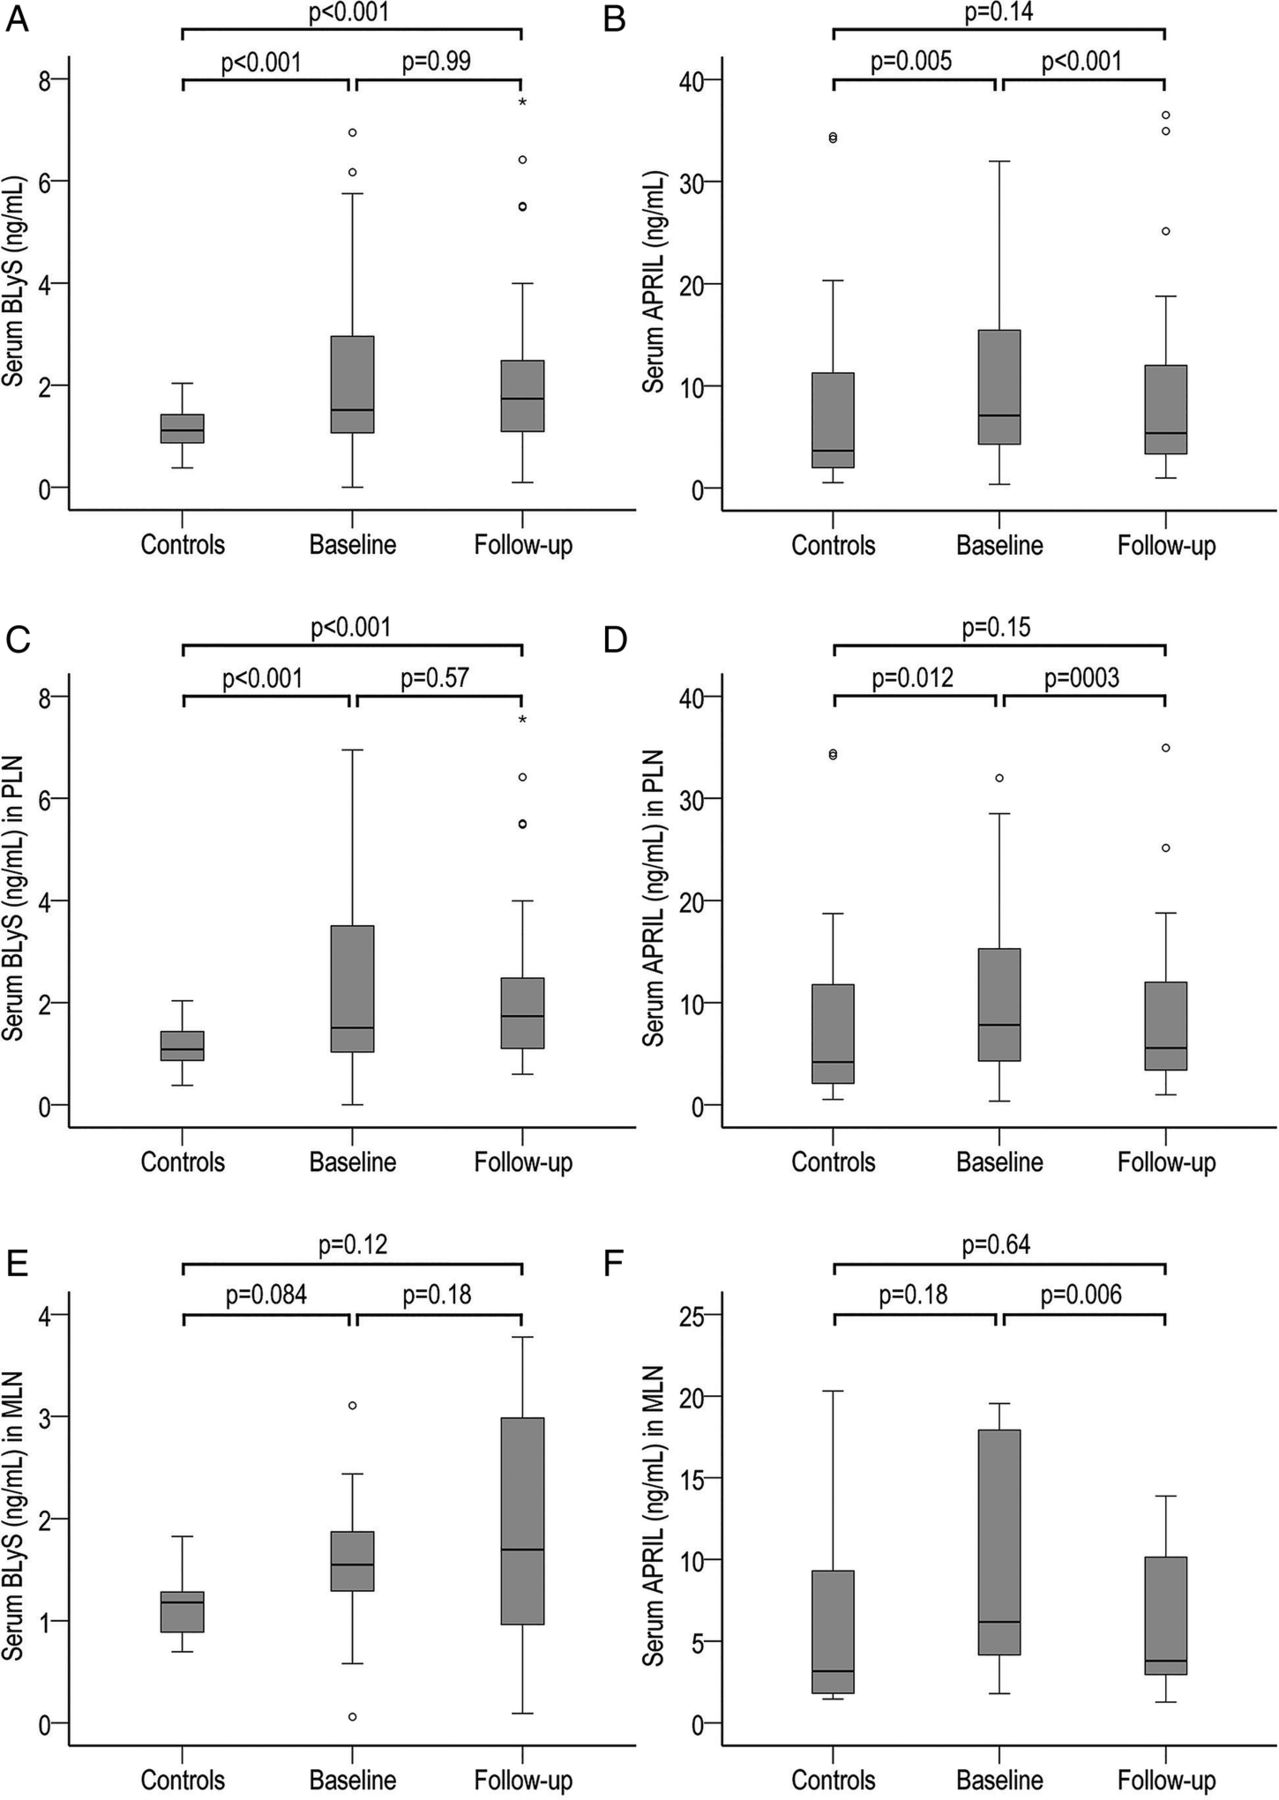
Median serum BLyS level was 1.5 ng/mL (range 0–6.9 ng/mL) at baseline and 1.7 ng/mL (range 0.1–7.6 ng/mL) at follow-up for patients, and 1.1 ng/mL (range 0.4–2 ng/mL) for controls. Similar median levels were seen in the PLN and MLN subgroups when analysed individually (table 2). Serum levels of BLyS were significantly higher in patients than in controls at both baseline (p<0.001) and follow-up (p<0.001) in the combined patient group and in the PLN subgroup. Patients with MLN did not differ significantly from corresponding controls. BLyS levels were unchanged following therapy within all patient groups (figure 1).

Box plots demonstrating serum levels of B lymphocyte stimulator (BLyS, ng/mL) and a proliferation inducing ligand (APRIL, ng/mL) in patients at baseline and follow-up, as well as in individually matched controls. (A) BLyS levels in the entire study cohort (n=64). (B) APRIL levels in the entire study cohort (n=64). (C) BLyS levels in the proliferative lupus nephritis (PLN) subgroup (n=52). (D) APRIL levels in the PLN subgroup (n=52). (E) BLyS levels in the membranous lupus nephritis (MLN) subgroup (n=12). (F) APRIL levels in the MLN subgroup (n=12). Extreme high values in APRIL box plots are not shown. The p values of comparisons are shown in the respective chart.
Median serum APRIL level was 7.1 ng/mL (range 0.4–434 ng/mL) at baseline and 5.4 ng/mL (range 1–287 ng/mL) at follow-up for patients, and 3.6 ng/mL (range 0.5–18 589 ng/mL) for controls (table 2). Serum levels of APRIL were significantly higher in patients compared with controls at baseline (p=0.005), but not at follow-up (p=0.14). Similar results were found in the PLN subgroup (p=0.012 at baseline, p=0.15 at follow-up), while patients with pure MLN at baseline displayed no significant differences compared with corresponding controls at either baseline or follow-up. After induction therapy, significant reductions in APRIL levels were observed within the combined patient group (p<0.001), as well as in the PLN (p=0.003) and MLN (p=0.006) subgroups (figure 1).
No correlation was found between BLyS or APRIL levels and renal disease activity, as assessed by AI, global disease activity as assessed by SLEDAI-2K, changes in SLEDAI-2K, 24 h urinary albumin, plasma creatinine, C3 or C4 levels, prednisone dosage, age or sex at either baseline or follow-up. No correlation was found between BLyS and APRIL levels at either baseline or follow-up (data not shown).
Analyses with regard to response
Analyses were performed for each response subgroup individually, as well as for the combined CR (CCR and CPR) and HR (HCR and HPR) groups. Due to the low number of patients with pure MLN at baseline, only the combined CR and HR groups were analysed in this patient subgroup.
Clinical response
In total, there were 48 CR (26 CCR, 22 CPR) and 16 clinical non-responders (CNR). In the PLN subgroup, 41 patients were regarded as CR (25 CCR, 16 CPR) and 11 as CNR. In the MLN subgroup, 7 patients were CR and 5 CNR.
In the combined patient group and in the PLN subgroup, serum levels of BLyS remained unchanged in all response groups. In the MLN subgroup, a significant increase was seen among CR (p=0.028) (table 3).
Comparisons between baseline and follow-up data
Serum levels of APRIL decreased significantly in both CR (p=0.002) and CNR (p=0.017). The same pattern was seen in the MLN subgroup (p=0.043 for CR, p=0.043 for CNR). In the PLN subgroup, the decrease in APRIL levels were significant in CR (p=0.009) but not in CNR (table 3).
Histopathological response
In the combined patient group, there were 49 HR (25 HCR, 24 HPR) and 14 histopathological non-responders (HNR). Among PLN patients, there were 43 HR (23 HCR, 20 HPR) and 9 HNR. In the MLN subgroup, 6 patients were HR, 5 were HNR and 1 patient did not undergo follow-up biopsy.
BLyS levels remained unchanged following induction therapy in the combined patient group and in the PLN and MLN subgroups. This lack of change was seen regardless of histopathological outcome (table 3).
APRIL levels decreased significantly in HCR (p=0.010) as well as in HNR (p=0.016), while in HPR, the decrease did not reach significance (p=0.072). In PLN patients, significant decreases were found in HR (p=0.010) and HCR (p=0.018). In contrast, among MLN patients, only HNR showed a significant decrease (p=0.043) (table 3).
Comparison between clinical and histopathological response
Of a total of 26 complete responders according to clinical response, 14 were complete responders according to histopathology, 11 were HPR and 1 patient was a histopathological non-responder. Of 22 CPR, 9 patients were HCR, 9 were HPR and 4 did not respond according to histopathology. Of 16 CNR, 6 were HR (2 HCR and 4 HPR) (table 2).
BLyS and APRIL as predictors of treatment response
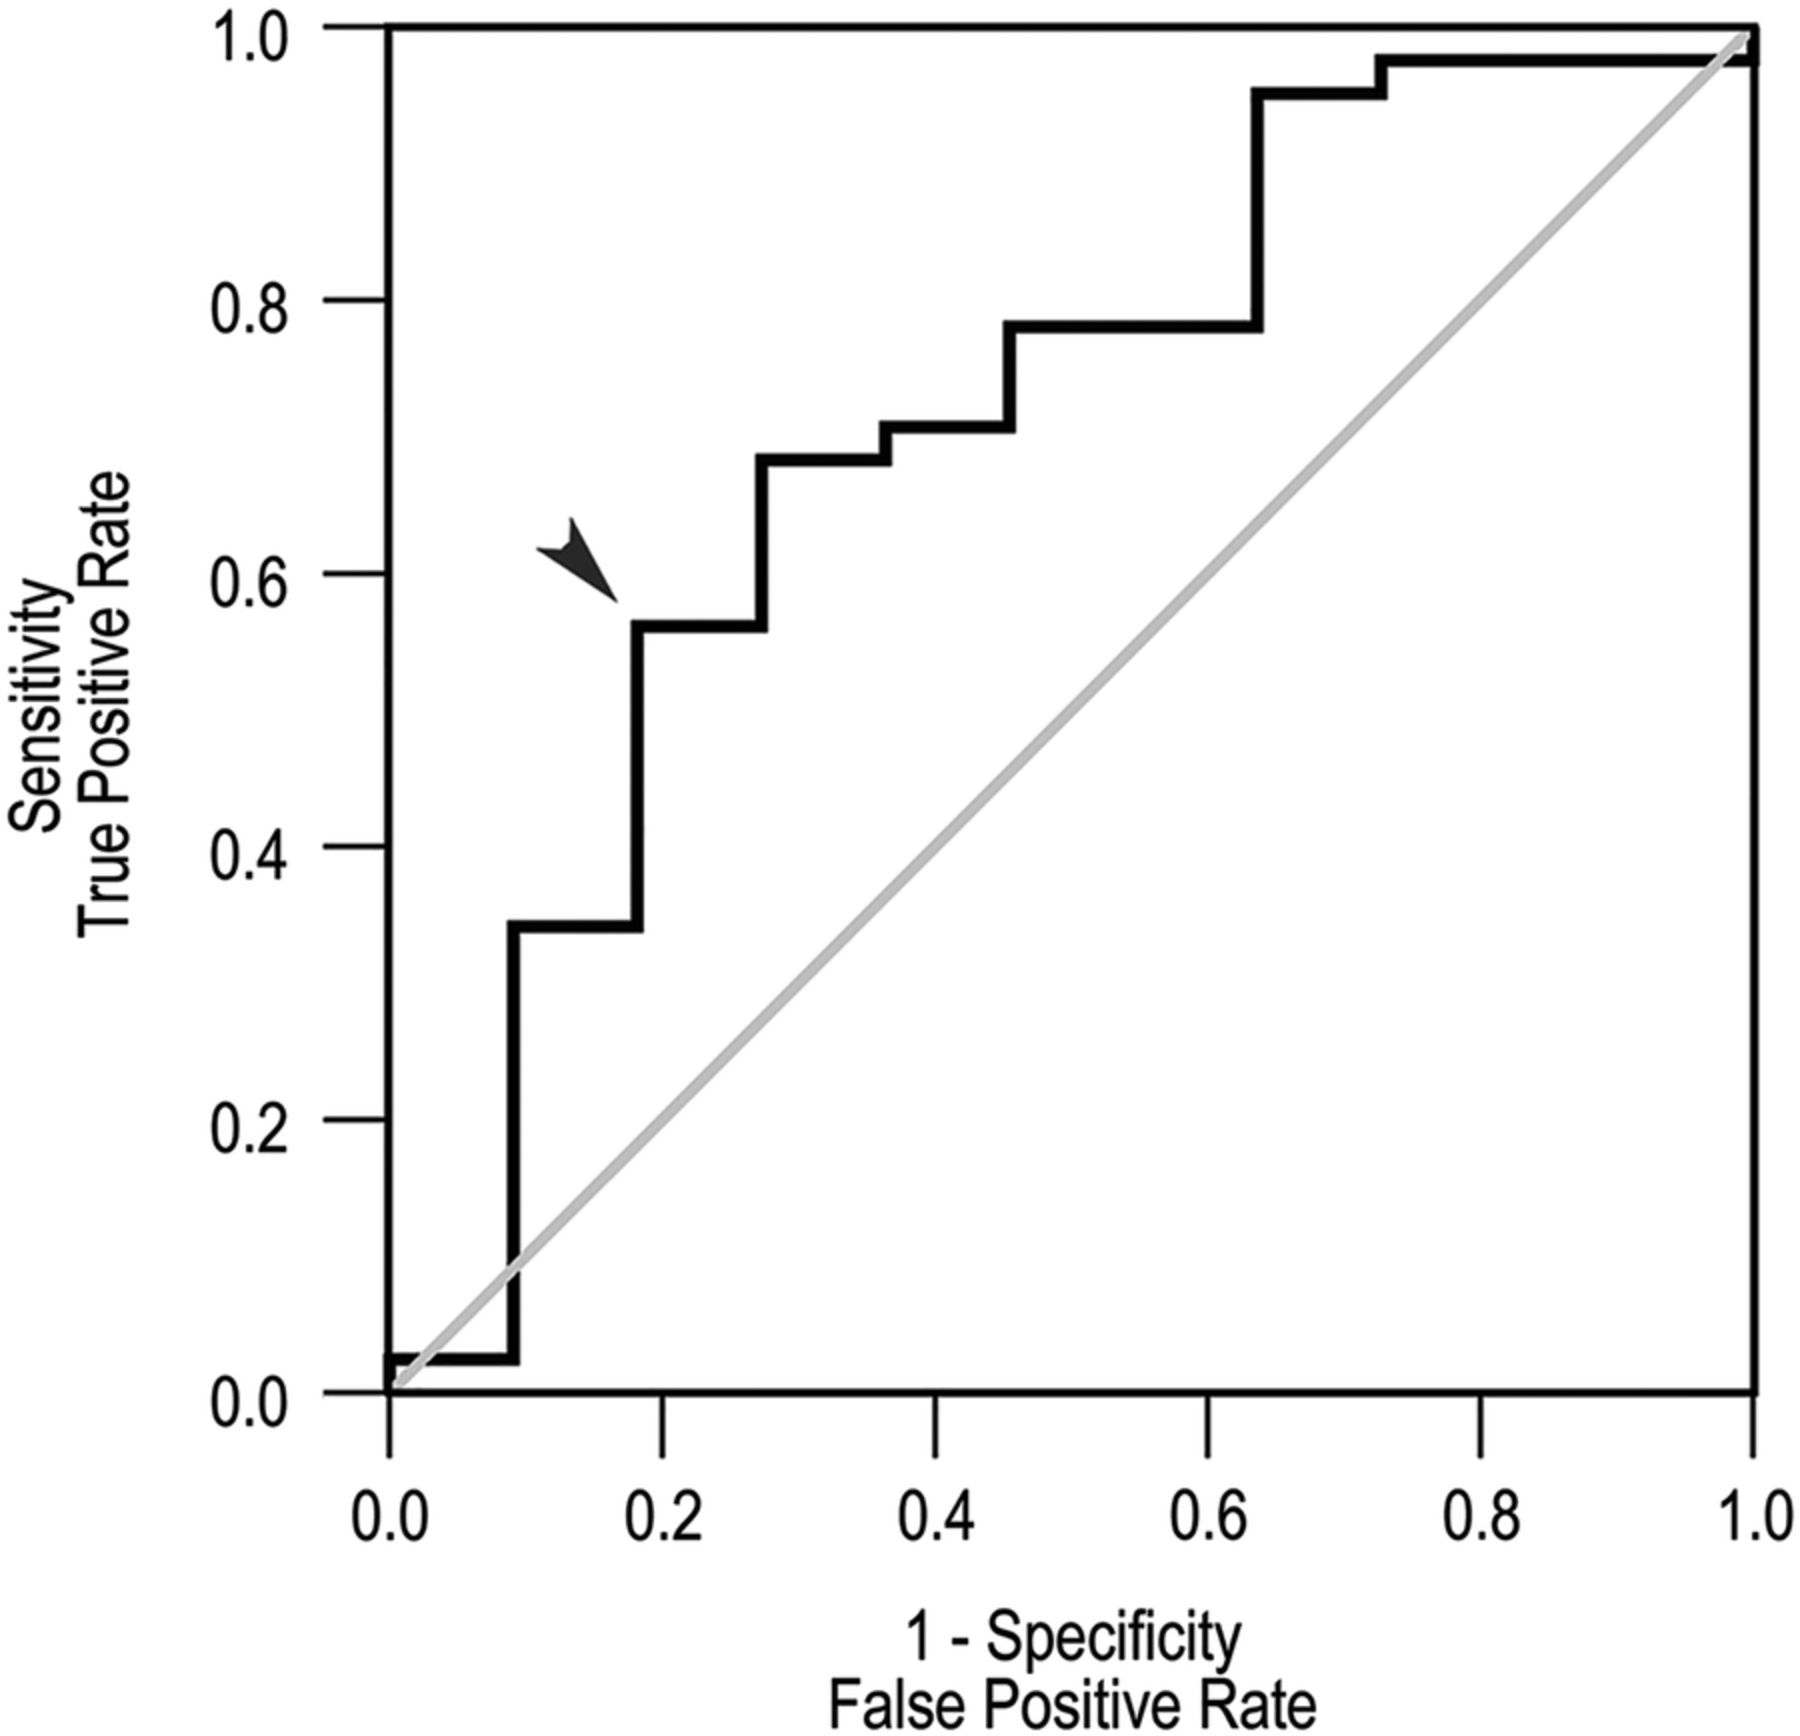
The ROC curve for baseline BLyS levels by response to treatment was performed and the area under the curve was 0.71. Further analysis showed that low baseline BLyS levels had high positive predictive value (PPV) for both clinical and histopathological response. Studying the ROC curve, the optimal threshold baseline BLyS value was found to be 1.5 ng/mL, where the curve was furthest from the no discrimination line. This value was similar to the median baseline serum concentration of BLyS among patients (table 2). In the entire patient group, baseline BLyS levels below this threshold value had 87% and 83% PPV for CR (n=30) and HR (n=29), respectively. In the PLN subgroup, the corresponding PPV was 92% for CR (n=25; figure 2) and 84% for HR (n=25). In contrast, baseline BLyS levels above 1.5 ng/mL showed no predictive value in either the entire patient cohort or in the PLN subgroup. Due to the small number of patients with pure MLN at baseline, no ROC curve analysis was performed for this subgroup.

Baseline serum B lymphocyte stimulator (BLyS) as a predictor of clinical response in proliferative lupus nephritis (PLN). Receiver operating characteristic (ROC) curve for baseline BLyS levels by response to treatment in the PLN subgroup (black line) and the no discrimination line (grey). The optimal threshold value, which was derived from the corresponding ROC curve for the entire patient cohort (not shown), is indicated by an arrow and corresponds to a BLyS level of 1.5 ng/mL. The positive predictive value for clinical response using this cut-off is 92%. Area under the curve=0.71.
ROC curve analysis for baseline serum levels of APRIL showed no power for APRIL to predict either treatment response or treatment failure. We found no predictive power for the BLyS/APRIL ratio regarding treatment outcome (data not shown).
Analyses with regard to treatment
Comparing baseline and follow-up BLyS levels in each treatment group individually, we found no significant changes in either the combined patient group or in the PLN subgroup. Among MLN patients, a significant increase in BLyS levels was observed in the CYC treated subgroup (p=0.043, n=5) but no change was seen in patients given MMF (p=0.18, n=2) or RTX (p=0.47, n=4) (table 3). Although significance was not reached, the mean BLyS level increased in CYC and RTX treated patients while it decreased in MMF treated patients. Combining the CYC and RTX subgroups, a significant difference was seen compared with the MMF subgroup at follow-up (p=0.02), while no difference was observed at baseline (p=0.90).
APRIL levels decreased significantly within CYC treated patients (p=0.006, n=45). This decrease did not reach significance in either the MMF (p=0.065, n=11) or RTX (n=0.063, n=7) treatment group. Among PLN patients, a significant decrease in APRIL levels was found in the CYC treated group (p=0.015, n=40). A tendency towards a decrease was seen in MMF treated patients (p=0.051, n=9) while no change was noted in RTX treated patients (p=0.59, n=3). Among patients with pure MLN at baseline, APRIL levels remained stable following therapy in all treatment groups (table 3).
Correlations with autoantibodies
At baseline, 59 patients (94%) were positive for anti-dsDNA and 46 (73%) for anti-C1q. At follow-up, 48 patients (79%) remained positive for anti-dsDNA and 30 (47%) for anti-C1q. The autoantibody status of patients in the different nephritis subgroups is presented in detail in table 2.
Comparing baseline with follow-up in all patients, a significant decrease in both anti-dsDNA (p<0.001) and anti-C1q (p<0.001) was observed. Significant decreases were observed in all response groups (data not shown). The overall decrease was maintained when looking at the PLN patient subgroup (p<0.001 for anti-dsDNA, p<0.001 for anti-C1q) (table 2). In the MLN subgroup, significant decreases were seen only among CR (p=0.028 for both anti-dsDNA and anti-C1q).
Analysing both the entire cohort and the PLN and MLN patient subgroups individually, no correlation was found between BLyS or APRIL levels and anti-dsDNA or anti-C1q titres at either baseline or follow-up (data not shown).
Longitudinal observation of a single patient
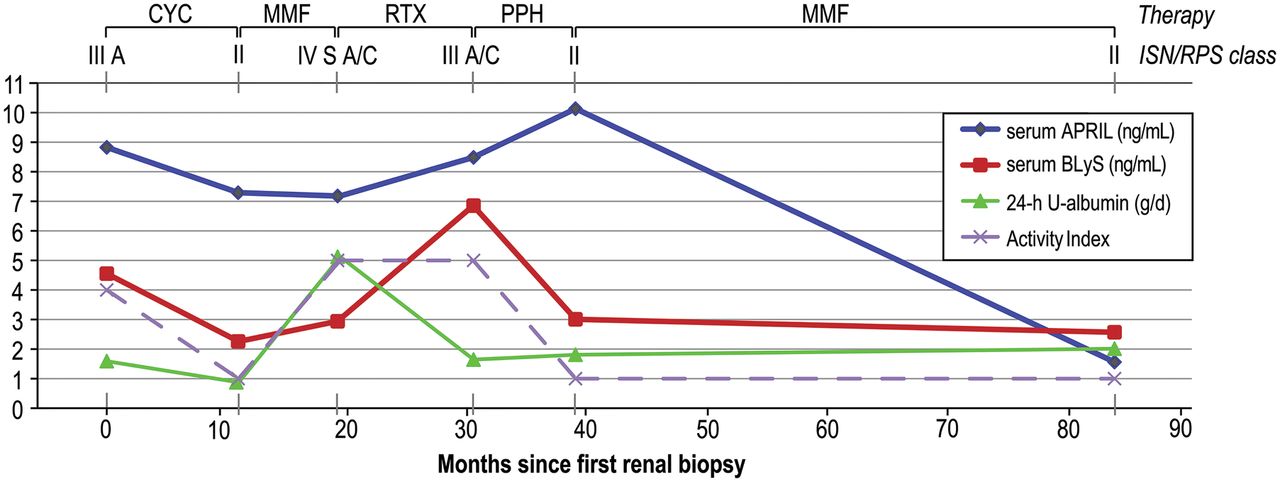
One patient was followed longitudinally over a 7 year period starting from the first biopsy ascertained LN. Results from the biopsy evaluations, proteinuria values, as well as serum levels of BLyS and APRIL, are demonstrated in figure 3.
Graphic representation of a 7 year follow-up of a woman with renal lupus from the first biopsy ascertained lupus nephritis. Renal biopsies were performed at six different occasions. Serum levels of B lymphocyte stimulator (BLyS, ng/mL) and a proliferation inducing ligand (APRIL, ng/mL), as well as proteinuria (24 h urinary albumin; g/day), were estimated on all biopsy occasions. The renal biopsies were assessed according to the International Society of Nephrology/Renal Pathology Society (ISN/RPS) classification24 and scored for Activity Index.25 CYC, cyclophosphamide; MMF, mycophenolate mofetil; PPH, plasmapheresis; RTX, rituximab.
BLyS levels and renal disease activity showed similar patterns; BLyS levels were increased when AI was high and decreased on renal biopsy occasions with signs of histopathological remission (ISN/RPS class II).
APRIL levels followed neither AI nor ISN/RPS class. Following remission maintenance therapy with MMF, serum APRIL decreased from its highest to its lowest value, while all other observed parameters, including renal histology, remained stable.
Discussion
Serum levels of both BLyS and APRIL were higher in patients with active LN compared with controls at baseline but were affected differently by immunosuppressive therapy. BLyS concentrations remained unchanged following therapy while APRIL levels decreased. Low baseline BLyS levels predicted response to treatment, attaining a PPV of 92% for clinical response among patients with proliferative nephritis. Our observations suggest that LN patients with low BLyS levels may have a disease phenotype that predisposes to more favourable treatment outcomes.
Previous observations have shown that BLyS is overexpressed in patients with SLE and other rheumatic diseases.8–11 BLyS levels have also been demonstrated to correlate with SLE disease activity and anti-dsDNA titre.11 ,29 In other studies, anti-dsDNA has been found to correlate with SLE disease activity, especially in patients with renal involvement.30–34 In our study of LN, we found significantly higher levels of BLyS in patients compared with controls; however, no correlation with anti-dsDNA titres or global disease activity, as assessed by SLEDAI-2K, could be confirmed. As expected, decreases in both anti-dsDNA and anti-C1q were documented following immunosuppressive therapy, in particular in the PLN subgroup. However, these decreases were seen regardless of clinical or histopathological outcome. Thus the autoantibody titres did not reflect renal disease activity at follow-up, and the role of these autoantibodies as biomarkers of response in LN may therefore be questioned. Contrary to anti-dsDNA and anti-C1q, the overall BLyS levels were unchanged following immunosuppressive treatment. Despite this lack of change, low baseline BLyS levels predicted a favourable treatment outcome, pointing to BLyS as a candidate predictor of treatment response in LN.
BLyS is a well characterised B cell maturation and survival factor which can be produced by many different cell types, such as stromal cells, macrophages, dendritic cells, neutrophils, lymphocytes and plasmacytoid dendritic cells.35 In this study, it was not possible to deduce whether the distribution of BLyS producing cells differed in patients with low serum BLyS levels compared with patients with high levels. However, our data might inspire future studies in that direction. Since a type I interferon signature is often observed in SLE and this cytokine is known to trigger BLyS production, it is tempting to speculate that plasmacytoid dendritic cells could be involved.36 Patients with low BLyS levels may hence have a weaker type I interferon signature. The lack of a full ‘feedback loop’ in B cell dysregulation would hypothetically represent a patient subgroup that would be more sensitive and responsive to immunomodulatory treatment. In this context, it is of interest that BLyS blockade (belimumab) alters the numbers and distribution of B cell subsets.37
A longitudinal study of RTX treated patients with SLE found that BLyS levels increased during B cell depletion, followed by a gradual return to pretreatment levels towards B cell repopulation.18 A similar pattern was observed in RTX treated patients with rheumatoid arthritis38 and primary Sjögren's syndrome,39 suggesting a consequent increase in BLyS levels after B cell depletion. In the current study, BLyS levels were assessed on only two occasions, at the time of initiation and after completion of induction therapy, and with unknown status of B cell depletion. This is a possible explanation for the data being unable to demonstrate the expected variations in BLyS levels during induction therapy. However, it is interesting to note that patients treated with RTX or CYC, both B cell depleting therapies, showed significantly higher BLyS levels at follow-up compared with MMF treated patients in whom both B and T lymphocytes are expected to be downregulated, supporting the fact that these respective treatments affect serum BLyS differently.
The increased BLyS levels in the CYC treated MLN subgroup could be explained by the fact that CYC was administered as repeated intravenous infusions, implying a sustained B cell depletion and a reactive BLyS production. Furthermore, significant increases in BLyS levels were noted in MLN patients who attained a clinical response, indicating reactive BLyS production due to a more prominent B cell depletion in these patients compared with non-responding patients. However, BLyS levels remained stable following therapy within the PLN subgroup, regardless of treatment outcome and despite baseline BLyS levels being similar to those in MLN patients. The different pattern of BLyS changes in PLN compared with MLN patients suggests differences in cytokine regulation during immunosuppression in these two nephritis subgroups and merits further study. Moreover, it would be of interest to look at the changes in BLyS levels longitudinally, on several occasions during induction therapy.
Overall, BLyS levels were maintained at follow-up, supporting previous findings of BLyS being constitutively produced by stromal cells.40 ,41 Additionally, as previously suggested,42 ,43 the observed excess of BLyS in patients with SLE might have a contributive role in the survival of autoreactive B cells, which would otherwise undergo negative selection in the periphery. Moreover, BLyS has been shown to have a central role in the survival of plasmablasts and plasma cells, and plasma cell frequencies have been shown to correlate with SLE disease activity.44–47 Due to its effects on plasmablasts and plasma cells, the stable excess of BLyS in patients with LN might contribute to refractory disease or higher risk for flare. Indeed, a previous study demonstrated that high baseline BLyS levels in patients with refractory SLE, 18 of 25 having renal involvement, were associated with shorter time to flare after B cell depletion.48 However, in the current study, high baseline BLyS levels were not found to be a good indicator of treatment outcome.
Taken together with our observation that low baseline BLyS levels predicted treatment response, the association between high BLyS levels and refractory disease, exemplified by the longitudinally followed patient, supports previous suggestions18 ,38 that neutralisation of BLyS accompanying conventional immunosuppression might result in beneficial treatment outcome. In light of the approval of belimumab for treatment of SLE,49 studies of anti-BLyS therapy in LN are anticipated. A post hoc analysis from the phase III belimumab clinical trials favoured belimumab over placebo, showing numerically greater renal improvement and decreases in proteinuria. However, the results were inconclusive as statistical significance was not reached.50 RTX leads to a profound B cell depletion but is not expected to have immediate effects on mature plasma cells, the main source of circulating IgG, as they do not express CD20. It would therefore be of interest to study the synergistic clinical and immunological effects of RTX and anti-BLyS therapy in a combined therapeutic regimen.
Serum levels of APRIL have recently been demonstrated to correlate with renal disease activity in patients with LN, and high APRIL levels were shown to predict treatment failure, suggesting APRIL as a candidate biomarker for LN.51 In accordance with these findings, we observed initially high APRIL levels compared with controls, which then decreased following treatment. Interestingly, no decrease was seen in either clinical or histopathological non-responders within the PLN subgroup, pointing to APRIL as a candidate biomarker of renal disease activity in patients with PLN, and indicating that the regulation of APRIL might be of importance for treatment response in this patient subgroup. This pattern was not seen in MLN patients, suggesting different immunological mechanisms between PLN and MLN. The discrepancy in APRIL modulation between these two nephritis subtypes has been underlined in previous observations, showing prominent expression of APRIL protein in glomeruli with PLN, but not MLN.13 ROC curve analysis did not show any indications of serum levels of APRIL being able to predict treatment response and we were unable to demonstrate any correlation between APRIL and histopathological renal activity, also illustrated in our longitudinally studied patient with PLN.
The potential of APRIL activity modulation has recently been discussed,51 and atacicept, a receptor construct that inhibits both BLyS and APRIL, has been tried for LN. The trial was terminated prematurely, as three of the first four patients to receive atacicept developed hypogammaglobulinaemia and two of them severe pneumonia.52 However, concurrent administration of MMF and high dose corticosteroids may have contributed to the low serum IgG levels. Our data encourage further investigation of APRIL activity manipulation in patients with PLN.
The size of the patient cohort limited the power in statistical analyses, especially when analysing data in different subgroups. Patients were treated with different regimens, depending on individual decisions by the treating physicians. Different immunosuppressive medications prior to induction therapy may have contributed to different cytokine profiles, complicating the interpretation of the results. Another concern is that the degree of proteinuria might influence serum BLyS levels due to substantial urinary loss of BLyS in patients with high levels of proteinuria.53 However, we observed no correlation between BLyS levels and proteinuria, suggesting that our results are not significantly affected by possible urinary losses of BLyS protein.
Further and desirably larger studies are required to validate our observations. Nevertheless, this is one of the largest LN patient cohorts with follow-up renal biopsies, affording unique possibilities for determination of the histopathological outcome following immunosuppressive therapy and therefore a more reliable evaluation of treatment response. The importance of histology in response evaluation has recently been highlighted in a study showing apparent discrepancy between clinical and histopathological outcome,54 which is also confirmed in our cohort and illustrated in our patient studied longitudinally; following treatment with RTX, a profound decrease in proteinuria was seen, while AI remained unchanged.
Conclusions
BLyS and APRIL were affected differently by immunosuppression: BLyS levels remained unchanged following therapy while APRIL levels decreased. Further studies are needed in order to understand the background and mechanisms behind differences in BLyS and APRIL regulation in patients with LN.
Our data suggest APRIL as a candidate biomarker of renal disease activity in lupus patients with proliferative glomerulonephritis and point to low serum concentrations of BLyS predicting treatment response in LN, especially in PLN. The results warrant studies of agents targeting BLyS and/or APRIL as a supplement to conventional treatment regimens for lupus patients with renal involvement.
Acknowledgments
We express our gratitude to Louise Berg for help with the laboratory work, Birgitta Tavaststjerna for performing the assays for autoantibody quantifications and Eva Jemseby for managing the serum samples. We thank all participating patients and controls, as well as all contributing medical staff from the Rheumatology Unit of Karolinska University Hospital, Stockholm, Sweden.
References
Footnotes
-
Contributors IP participated in the study conception and design, acquisition of the data, statistical analyses and interpretation of the results, carried out the laboratory work for quantification of serum BLyS and APRIL, and drafted the manuscript. AZ participated in the study design, patient characterisation and acquisition of the data. BS assessed the renal biopsies and participated in the interpretation of the results. MA performed the statistical analyses, participated in the interpretation of the results and helped draft the manuscript. JG participated in the acquisition of the clinical data. ES participated in the recruitment of controls and acquisition of the data, and helped draft the manuscript. VM participated in the study design and interpretation of the results. IG conceived the study, and participated in the study design and coordination, data collection, selection of samples and interpretation of the results, as well as helped draft the manuscript. All authors revised the manuscript critically and read and approved the final version of the manuscript prior to submission.
-
Funding This study was supported by grants from the Swedish Research Council, Swedish Rheumatism Association, King Gustaf V's 80 year Foundation, Swedish Heart–Lung Foundation, Foundation in memory of Clas Groschinsky, Stockholm County Council and Karolinska Institutet Foundations.
-
Competing interests None.
-
Ethics approval The study protocol was reviewed and approved by the regional ethics committee at Karolinska Institutet, Stockholm, Sweden.
-
Provenance and peer review Not commissioned; externally peer reviewed.
-
Data sharing statement No additional data are available.