


A number of different assessment tools have been proposed over the past few decades to evaluate cognition in multiple sclerosis (MS).Reference Rao, Leo, Bernardin and Unverzagt 1 - Reference Langdon, Amato and Boringa 4 However, the most commonly accepted comprehensive battery of tests for neuropsychological evaluation in MS is the Minimal Assessment of Cognitive Function in MS (MACFIMS).Reference Benedict, Fischer and Archibald 5 This battery of tests was chosen via consensus by an expert panel of neuropsychologists and psychologists (with clinical and research expertise in MS) from the United States, Canada, United Kingdom, and Australia at a 2001 meeting sponsored by the Consortium of MS Centers (CMSC).Reference Benedict, Fischer and Archibald 5 Following a review of the pertinent literature, criteria were established with which to select appropriate measures. These criteria included: standardized stimulus materials and administration, normative data, adequate range, reliability, criterion validity, alternate forms and practicality.Reference Benedict, Fischer and Archibald 5 In addition, the measures chosen had to reflect the domains of cognition typically affected in MS: processing speed/working memory, language, visual perception/spatial processing, learning and memory, and executive function. The following measures were selected: the Paced Auditory Serial Addition Test (Rao version; PASAT);Reference Rao, Leo, Ellington, Nauertz, Bernardin and Unveragt 6 , Reference Gronwall 7 the oral Symbol Digit Modalities Test (Rao version; SDMT);Reference Rao, Leo, Ellington, Nauertz, Bernardin and Unveragt 6 , Reference Smith 8 the Controlled Oral Word Association Test;Reference Benton and Hamsher 9 the Judgment of Line Orientation Test (JLO);Reference Benton, Sivan, Hamsher, Varney and Spreen 10 the California Verbal Learning Test–II (CVLT–II);Reference Delis, Kramer, Kaplan and Ober 11 the Brief Visuospatial Memory Test–Revised (BVMT–R);Reference Benedict 12 and the Delis–Kaplan Executive Function System (D–KEFS) Sorting Test (Sorting).Reference Delis, Kaplan and Dramer 13 This battery has been well-validated in MS and is used in common practice by clinicians assessing cognition in MS.Reference Benedict, Cookfair and Gavett 14 Components of the MACFIMS battery (i.e., the BVMT–R) are more sensitive to impairment than other established batteriesReference Strober, Englert, Munschauer, Weinstock-Guttman, Rao and Benedict 15 and are predictive of health-related quality of life (i.e., the SDMT).Reference Hoogs, Kaur, Smerbeck, Weinstock-Guttman and Benedict 16 MACFIMS data are strongly related to the neuropsychiatric features of the disease, neuroimaging, and vocational outcomes.Reference Benedict and Zivadinov 17 - Reference Morrow, Drake, Zivadinov, Munschauer, Weinstock-Guttman and Benedict 19
When deciding whether or not a patient is cognitively impaired on the MACFIMS, clinicians typically consult normative data for each respective test. These data are provided in all published test manuals, allowing clinicians to compare patients’ performance relative to that of demographically similar healthy individuals. Typically, performance is considered impaired if a person scores at, or more than, 1.5 standard deviations below the normative mean. Given that age affects performance on most cognitive tasks,Reference van Gorp, Satz and Mitrushina 20 normative data are typically supplied in predetermined, and sometimes arbitrary, age groupings. Performance may also be affected by educational level and gender, and thus some normative data take these variables into account as well.Reference Heaton, Ryan and Grant 21 , Reference Vanderploeg, Axelrod, Sherer, Scott and Adams 22 Such discrete norms are typically used in common practice by clinicians.Reference Lezak, Howieson, Bigler and Tranel 23 - Reference Strauss, Sherman and Spreen 25
More recently, there is a movement toward regression-based or continuous norms.Reference Crawford and Howell 26 Data are derived from regression-based formulae in which numerous demographic variables can be included (e.g., age, education, sex, race, IQ, and physical health).Reference Testa, Winicki, Pearlson, Gordon and Schretlen 27 , Reference Bergman and Almkvist 28 Regression-based norms are not vulnerable to the same limitations plaguing discrete norms such as arbitrary cutoffs for the age/education groupings (which can affect interpretation depending on which age category a person is assigned to),Reference Oosterhuis, van der Ark and Sijtsma 29 small numbers of participants in individual subgroups, and the lack of correction for all relevant demographic information.Reference Berrigan, Fisk and Walker 30 In addition, typically smaller sample sizes are needed in regression-based normative data to obtain norms as precise as those provided by discrete methods.Reference Oosterhuis, van der Ark and Sijtsma 29
To the best of our knowledge, although several studies have presented control data on the MACFIMS when comparing a full control sample to an MS sample,Reference Benedict, Cookfair and Gavett 14 , Reference Eshaghi, Riyahi-Alam and Roostaei 31 , Reference Dusankova, Kalincik, Havrdova and Benedict 32 these data have not been presented in a manner that would allow their use for normative comparison in a clinical setting. Indeed, the control data are presented as a group, rather than broken down into age or other demographically relevant categories. Thus, there are no clinically relevant discrete norms available for the MACFIMS on a largely co-normed population. In other words, although discrete published normative data are available for all components of the MACFIMS, each particular test was normed on different populations. Although some researchers suggest that co-norming is not required for competent clinical practice,Reference Rohling, Miller, Axelrod, Wall, Lee and Kinikini 33 others stress that norms derived from different populations cannot be considered equivalent given differences in demographics between the various normative populations from which individual published tests were derived.Reference Russell, Russell and Hill 34 Without co-norming, there is room for error in interpretation given that the populations are not likely to be equivalent. Despite this, clinicians are increasingly relying on flexible batteries, so that in practice co-norming is not considered a priority.Reference Rohling, Miller, Axelrod, Wall, Lee and Kinikini 33 Nonetheless, given the psychometric advantage of co-norming, having such data available for the MACFIMS would be an asset.
In the area of cognitive assessment in MS, regression-based normative data are used with the National MS Society Consensus Neuropsychological Battery for Pediatric Multiple Sclerosis (NBPMS)Reference Smerbeck, Parrish and Yeh 35 , Reference Smerbeck, Parrish and Yeh 36 and have also been derived for the MACFIMS in an American sample.Reference Parmenter, Testa, Schretlen, Weinstock-Guttman and Benedict 37 The latter was demonstrated to yield higher rates of impairment than manualised norms for many of the MACFIMS measures when evaluating people with MS. Although members of our group have published regression-based normative data on the SDMT in a Canadian sampleReference Berrigan, Fisk and Walker 30 (and the Ottawa control data from that study are also included in the current paper), to the best of our knowledge, no such Canadian normative data are available on the full MACFIMS battery. There is a need for such data given that it has been demonstrated that Canadian adults attain higher raw scores than Americans on measures of general intellectual ability as evaluated by the Wechsler Adult Intelligence Scale (versions III and IV),Reference Miller, Weiss, Beal, Saklofske, Zhu and Holdnack 38 which has been attributed to variations in population composition due to social, economic, and educational differences between the two countries.Reference Harrison, Armstrong, Harrison, Lange and Iverson 39 When assessing a person with an acquired neurological condition, clinicians may conclude that the person is more significantly impaired when using Canadian norms relative to American ones.Reference Harrison, Armstrong, Harrison, Lange and Iverson 39 Others suggest that education level has a stronger relationship with IQ in American samples compared to Canadian ones.Reference Longman, Saklofske and Fung 40 Miller et al. (2015)Reference Miller, Weiss, Beal, Saklofske, Zhu and Holdnack 38 concluded that “choosing to use U.S. norms to interpret the test scores of a Canadian will increase the variance and subsequently increase the [confidence intervals] around the true score, making it more difficult to rely on the test scores for diagnosis” (P. 323–4). This highlights the need for Canadian MACFIMS normative data and is reflective of best practice recommendations.Reference Miller, Weiss, Beal, Saklofske, Zhu and Holdnack 38 MS researchers from other countries are also recognizing the need for culturally sensitive use of MS-focused testing batteries such as the MACFIMSReference Eshaghi, Riyahi-Alam and Roostaei 31 , Reference Dusankova, Kalincik, Havrdova and Benedict 32 and the Brief International Cognitive Assessment for MS (BICAMS).Reference Geidraitiene, Kizlatiene and Kaubrys 41 - Reference Spedo, Frndak and Marques 44
Our current objective was to establish both discrete and regression-based normative data for the MACFIMS based on a partially co-normed Canadian population.
Methods
The studies that contributed to this database were approved by appropriate institutional review boards, which included the Ottawa Health Science Network Research Ethics Board, the Sunnybrook Health Sciences Centre Research Ethics Board, and the Health Sciences Research Ethics Board (London).
Participants
Research participants were healthy controls from three medium to large Ontario cities (Ottawa, London, and Toronto). Participants were recruited from the community, through word of mouth, via posted advertisements, and using website advertisements. All participating subjects provided full informed consent. The data were collected in the course of four different studies (each with different original aims) evaluating various aspects of cognitive functioning in persons with multiple sclerosis (see Supplementary Table 1). Overall, 174 participants were obtained from studies conducted by Dr. Walker in Ottawa. The Toronto site enrolled six healthy controls. Lastly, there were 150 healthy controls from London who completed the SDMT and PASAT.Reference Morrow 45 Together, there was a grand total of 330 healthy control participants, although the number completing each individual MACFIMS test varied as indicated.
The inclusion criteria were consistent across the contributing studies. In order to be included, participants had to be healthy, between 18 and 65 years of age (18 and 59 for the London sample), and fluent in English (according to both participant self-assessment and examiner assessment). Participants were excluded if they had any neurological/medical/psychiatric conditions that might impede cognition, including prior head trauma, learning disability, attention-deficit disorder, mild cognitive impairment, dementia, or substance abuse. Other exclusion criteria included a history of seizures, uncorrected visual acuity problems, and current use of drugs (legal or illegal) that might have an impact on cognitive function.
Neuropsychological Measures
The MACFIMSReference Benedict, Fischer and Archibald 5 , Reference Benedict, Cookfair and Gavett 14 was administered across the four different studies by trained assistants and students under the supervision of either a neuropsychologist (LW), a neuropsychiatrist (AF), or a neurologist with expertise in cognition in MS (SM). The full MACFIMS [PASAT (3” and 2”), oral SDMT, verbal fluency (FAS and Animal Naming substituted for COWAT),Reference Tombaugh, Kozak and Rees 46 the JLO, CVLT–II, BVMT–R, and D–KEFS Sorting] was administered in the SUNSCREEN study. In the IPSIMS study, participants were administered all MACFIMS tests but the JLO and CVLT–II. In the BICAMS study, participants were administered all MACFIMS tests but D–KEFS Sorting and JLO. In addition, they received only the learning trials from the CVLT–II and the BVMT–R. The London participants completed only the SDMT and PASAT.
Data Analysis
Discrete normative data were established by first subdividing the sample according to three age groupings: 18-35, 36-50, and 51-65. Groupings were chosen to ensure the maximum number of participants in each cell, as well as to ensure that the data would be available for evaluating the performance of young, middle-aged, and older adults. Descriptive statistics (means and standard deviations) were calculated for each group on each measure.
For the regression-based norms, a series of linear regressions were calculated according to a procedure already well-established in the literature.Reference Duff and Ramezani 47 In most instances, just the summary score for the measure was employed, but for the CVLT–II and the BVMT–R, additional analyses were performed for relevant sub-scores. In each regression model, raw scores were the criterion variables, and age (in years), gender (coded as 1=male, 2=female), and education (in years) were the predictor variables entered as a single block (i.e., the “Enter” method). Given that multiple regression models were examined, a p value <0.01 was utilized throughout. As in Duff & Ramezani (2015),Reference Duff and Ramezani 47 for each regression model, the constant and non-standardized coefficients were used to generate normative formulae for ease of clinical use.
Results
See Table 1 for demographic information broken down by individual cognitive tests. In addition, for further reference, Supplementary Table 1 lists demographics for the full sample broken down by study/location. In the final sample of 330 participants, the mean age was 39.78 (11.78) years, most were female (74 vs. 26% male) given that they were selected to match the female-dominant MS populations in their respective studies, and the mean level of education was equivalent to a community college education (~15 years). Mean scores on the MACFIMS tasks fell generally within the average range when compared to published normative data for each test, suggesting that our sample was representative of the larger population.
Table 1 MACFIMS tests and associated sample sizes, age and education

Discrete Norms
See Table 2 for age-based discrete normative data.
Table 2 MACFIMS discrete norms for Canadian sample

* Must reverse direction of sign on resulting z score.
Regression-Based Norms
See Table 3 for individual regression-based formulae associated with each MACFIMS test. Demographic variables varied in their contribution to each MACFIMS test in the regression models, predicting 0-18% of the variance, with a mean of 7% of the variance in the MACFIMS test scores being explained by these demographic variables. The only regression equations that failed to reach statistical significance were for the FAS and Animal Fluency (although they approached significance) and the CVLT–II, primarily because in each of these equations demographics accounted for less than 4% of the variance (on the primary measures).
Table 3 MACFIMS regression-based norms for Canadian sample

Sex: 1=male, 2=female; age: enter age in years; educ: enter education in years.
* Must reverse direction of sign on resulting z score.
The following tests and subtests were more influenced by demographic variables as measured with standardized β weights (see Supplementary Table 2) greater than 0.20 (specific demographic variable listed in parentheses): SDMT (age); 2s PASAT (education); JLO (sex, age); CVLT–II Free Recall (education); CVLT–II List B Free Recall (education); CVLT–II Short Delay Free Recall (age, education); CVLT–II Long Delay Free Recall (age, education); CVLT–II Long Delay Cued Recall (age); CVLT–II, Total Intrusions (age, education); CVLT–II, Total Repetitions (age, education); BVMT–R Total Recall (age, education); BVMT–R Delay Recall (age); D–KEFS Confirmed Correct Sorts (sex); and D–KEFS Free Sort Description Score (sex).
Discussion
This project aimed to establish Canadian discrete and regression-based normative data for the MACFIMS battery within a partially co-normed framework. Although there were four studies contributing to the healthy control data derived here, and thus not completely co-normed, the majority of tests in the battery were completed by more than 100 participants. Although regression-based data are available for the MACFIMS derived from an American population, research has emphasized the inadvisability of using American normative data to interpret cognitive test findings from Canadian patients, at least in part due to the social, economic, and educational differences between the two countries.Reference Harrison, Armstrong, Harrison, Lange and Iverson 39 Thus, the current data will allow clinicians to make direct comparisons between scores on individual tests of the MACFIMS in reference to a more consistent and demographically relevant population of healthy controls than that afforded by previously available norms and by published test norms (which, again, are largely American). A case example of the application of regression-based normative data is presented in Text Box 1. Age, education, and sex predicted 0 to 18% of the variance in MACFIMS scores, with a mean of 7%. Age and education had the most frequent impact. The impact of demographics is small but relatively consistent with that noted in other regression-based normative data. The American regression-based MACFIMS normative study found that age, education, and sex predicted 7-28% of the variance, with age having the most frequent impact.Reference Parmenter, Testa, Schretlen, Weinstock-Guttman and Benedict 37 Similar data for the Repeatable Battery for the Assessment of Neuropsychological Status (RBANS) in older adults revealed that age, education, sex, and race predicted 5-28% of the variance in scores.Reference Duff and Ramezani 47 Demographics explained from about 10 to 30% of the variance in scores on the Halstead–Reitan battery. 48 , Reference Moses, Pritchard and Adams 49 Thus, the minimal but variable range in demographic influence observed currently is consistent with past literature.
Text Box 1 Case example of the application of regression-based normative data
Presume that one has assessed a 43-year-old woman with secondary-progressive MS who has 14 years of education. She has obtained a raw score of 21 on the BVMT–R Total Recall index. Normative data from the published BVMT–R manual yields a z score of –0.82. Using the current discrete norms for the 36 to 50 age group, her z score would be –1.39. Using the regression equation in Table 3, her demographically corrected predicted score would be 26.49 (i.e., 29.21 – [sex × 0.30] – [age × 0.16] + [educ× 0.34]=29.21 – [2 × 0.30] – [43 × 0.16] + [14 x 0.34]=26.49). The predicted score is subtracted from the observed score, and the result is divided by the standard error of the estimate for that subtest (i.e., [21 – 26.49]/5.54). This yields a z score of –0.99. As expected, given findings with the Wechsler scales,Reference Harrison, Armstrong, Harrison, Lange and Iverson
39
Canadian raw scores on the BVMT–R are generally slightly higher than American normative data. Thus, when using the current Canadian normative data to calculate a standard score, this patient is more severely impaired than the American data would suggest. Although whether the current discrete or regression-based norms are harsher depends on the task, both forms of the Canadian norms suggest more impaired functioning for this particular individual on other tasks as well (e.g., SDMT: published z=–2.05; discrete z=–2.61; regression z=–4.19; FAS: published z=–2.0; discrete z=–2.10; regression z=–3.94). 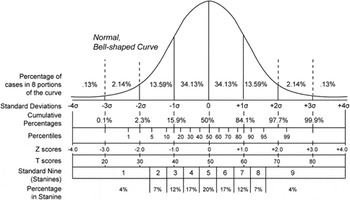 http://psychology.wikia.com/wiki/Bell_curve_grading
As can be expected, the influence of particular demographic variables varied between MACFIMS tests. Tasks measuring processing speed and working memory were affected to varying degrees by demographics. SDMT performance was influenced mostly by age, whereas PASAT performance was more significantly impacted by education. The age effect on SDMT performance has been demonstrated in the literature,Reference Selnes, Jacobson and Machado 50 and the lack of age effect on the PASAT is not unexpected given that the literature demonstrates a more inconsistent influence of age.Reference Tombaugh 51 Education has been demonstrated to impact PASAT performance in healthy individuals (traditional scoring)Reference Gonzalez, Grant and Miller 52 and in people with MS (as mediated by mathematical ability).Reference Sandry, Paxton and Sumowski 53 The latter is contributing to the growing literature demonstrating that the PASAT is not likely an appropriate instrument for monitoring cognition in MS despite the entrenchment of this measurement tool in the MS literature.Reference Sonder, Burggraaff, Knol, Polman and Uitdehaag 54 , Reference Walker, Cheng, Berard, Berrigan, Rees and Freedman 55 The lack of demographic influence on the COWAT is somewhat surprising, given that the literature demonstrates a general decline in performance with age and better scores in more highly educated individuals.Reference Strauss, Sherman and Spreen 25 The lack of age effects in our 18-to-65-year-old sample may be due to the fact that the greatest influence of age is seen at the extremes (i.e., childhood and old age).Reference Strauss, Sherman and Spreen 25 The lack of influence of education in our sample is likely due to the fact that the vast majority of our subjects had a high school education or above. The JLO was most influenced by age and sex, as has also been demonstrated in the literature.Reference Benton, Sivan, Hamsher, Varney and Spreen 10 The verbal memory test (CVLT–II) was most influenced by age and education, consistent with the findings of the test authors.Reference Delis, Kramer, Kaplan and Ober 11 Nonetheless, the current results did not yield the female advantage noted by the test authors,Reference Delis, Kramer, Kaplan and Ober 11 perhaps due to the fact that the current gender distribution was biased toward females. Performance on the nonverbal memory test (BVMT–R) was similar to that on the verbal task, with age and education being most contributory. The test author reported that age is moderately correlated with performance, whereas the relationship of performance to education is generally weak.Reference Benedict, Schretlen, Groninger, Dobraski and Shpritz 56 Finally, the Sorting Test was influenced most significantly by sex. Little information is available on demographic influences on the D–KEFS measures, with the manual reporting only age effects,Reference Delis, Kaplan and Dramer 13 so that it is unclear whether sex is also a variable that typically influences performance.
One limitation of our study is that some of the tasks (i.e., the CVLT–II and JLO) had small sample sizes (n=57) in the regression-based formulae. This value falls below the 100 participants recommended to obtain precise classifications of performance for individuals using regression-based normative data and suggests that, for these tasks in particular, caution must be used when interpreting the performance of individuals who fall at the extremes of the demographic variables of interest.Reference Berrigan, Fisk and Walker 30 Indeed, it has been suggested that when numbers are smaller the norms can lead to higher rates of false negatives (or missed diagnoses), particularly in older adults and those with lower levels of education.Reference Fastenau 57 Sample size was even smaller for these same tasks in the discrete norms (e.g., as low as 16 participants in the 36-50 age group), so that, again, caution must be applied when interpreting performance. In particular, the current findings should not be utilized in individuals over the age of 65. Similarly, care should be taken when interpreting the performance of those with less than a high school education, as all but two individuals in this database had a high school education or greater. Notably, the Conference Board of Canada reports that, as of March of 2013, 88% of working-age Canadians have graduated from high school. As such, the educational background of the current sample is fairly representative of the general population. Further limitations include a lack of ethnicity data for the full sample and a lack of information on the percentage of bilingual or multilingual speakers. Although some may consider the larger proportion of females represented in this sample as a limitation, it is important to note that the data will largely be used to interpret the performance of individuals with MS. Given that the majority of people living with MS are female, the current demographic distribution is considered appropriate.
In conclusion, provision of these Canadian regression-based formulae will allow for more accurate interpretation of MACFIMS scores by allowing clinicians to correct for relevant demographic variables simultaneously, leading to improved clinical decision making for Canadian individuals with multiple sclerosis. The provision of both discrete and regression-based options allows clinicians the freedom to choose the scoring method best suited to their own practice. Our group plans to follow up on this preliminary work by more thoroughly evaluating the utility of these Canadian regression-based normative data compared to the American data in interpreting the performance of Canadian individuals with MS.
Acknowledgements
The authors wish to thank all of the research participants who graciously gave of their time and effort to complete the various studies that made up this normative database. The authors would also like to thank the funding agencies that generously provided support for these studies, including the Multiple Sclerosis Society of Canada (Drs. Walker and Feinstein), the University of Ottawa Brain and Mind Research Institute (Drs. Walker and Cousineau), and Novartis Canada (Dr. Morrow).
Statement of Authorship
Dr. Lisa Walker: study conception, Ottawa data collection, data compilation between sites, supervision of data management, data analysis/interpretation, and manuscript preparation.
Dr. David Marino: data management, data analysis/interpretation, and manuscript editing.
Jason Berard: data management, data analysis/interpretation, and manuscript editing.
Dr. Anthony Feinstein: Toronto data collection and manuscript editing.
Dr. Sarah Morrow: London data collection and manuscript editing.
Dr. Denis Cousineau: data analysis/interpretation and manuscript editing.
Disclosures
Lisa Walker reports grants from the Multiple Sclerosis Society of Canada, grants from the University of Ottawa Brain and Mind Research Institute, and grants from Novartis Canada, during the conduct of the study; other from Serono Canada and other from Novartis Canada, outside the submitted work.
Anthony Feinstein reports grants from the MS Society of Canada, personal fees from Biogen, personal fees from Novartis, personal fees from Merck–Serono, personal fees from Sanofi–Genzyme, personal fees from Roche, and personal fees from Teva, outside the submitted work.
Sarah Morrow has received honoraria for speaking, consulting, and advisory board participation from Biogen Idec, EMD Serono, Genzyme, Novartis, and Teva Neuroscience. She has acted as site principal investigator for clinical trials for Biogen Idec. She has also received investigator-initiated study funds from Biogen Idec, Genzyme, and Novartis.
David Marino, Jason Berard, and Denis Cousineau hereby declare that they have nothing to disclose.
Supplementary Material
To view supplementary materials for this article, please visit https://doi.org/10.1017/cjn.2017.199


