Article Text

Abstract
Objective: To study the effects of different disease-modifying antirheumatic drugs (DMARD) on different events mediated by IL-15-activated lymphocytes.
Methods: Peripheral blood lymphocytes (PBL) were isolated from healthy donors and activated with IL-15 after exposure to different DMARD: leflunomide, cyclosporin A, methotrexate, mycophenolic acid, FK-506, sulphasalazine and sodium aurothiomalate. The expression of different surface molecules on the PBL was then determined by flow cytometry. Cells were also co-cultured with the monocytic cell line THP-1 and the tumour necrosis factor (TNF) concentration in the supernatant was measured after 24 h using an immunoenzyme assay. The effect of the aforementioned drugs on IL-17 production by IL-15-activated PBL was also studied.
Results: Treatment of PBL with leflunomide, cyclosporin A and FK-506 inhibited the IL-15-induced expression of both CD54 and CD69 by PBL, as well as TNF production in co-cultures of activated PBL and THP-1 cells. The downregulation of CD54 and CD69 in PBL was correlated with the inhibition of TNF production. Likewise, leflunomide, cyclosporin A and FK-506 all inhibited IL-17 production in IL-15-activated PBL. Interestingly, the effect of leflunomide was not reverted by the presence of uridine in the medium. In addition, leflunomide inhibited the phosphorylation of STAT6 in vitro.
Conclusion: Inhibition of the JAK/STAT pathway may represent an additional effect of leflunomide in chronic polyarthritis because it impairs certain events that control proinflammatory TNF and IL-17 cytokine production.
Statistics from Altmetric.com
Research on the pathogenesis of rheumatoid arthritis (RA) has led to the development of agents that target specific regulators of key events in the perpetuation of rheumatoid synovitis. Despite the therapeutic impact of these new biological agents in the rheumatology community, standard disease-modifying antirheumatic drugs (DMARD) are still successfully prescribed to many patients. In contrast to biological therapies, the identification of DMARD effective in RA was serendipitous, and the mechanisms through which many of these act are not yet fully understood.1 As it is now more common to prescribe combined therapies to RA patients, involving either different DMARD or the combination of biological therapies and DMARD, it is becoming more important to understand the mode of action of these drugs.
One area of particular interest in RA research is the proinflammatory loop that may be established through the interactions between fibroblasts/macrophages and activated lymphocytes.2 3 4 5 6 7 Indeed, peripheral blood lymphocytes (PBL) activated with IL-15 can induce tumour necrosis factor (TNF) production in macrophagic cells.5 8 It is notable that higher concentrations of IL-15 can be found in the synovial fluid and serum from RA patients than patients with other inflammatory arthropathies.5 9 10 11 Therefore, we have addressed the effect of several DMARD on the IL-15-mediated activation of PBL and on the induction of TNF production by macrophages under these conditions. Our results suggest that some DMARD may exert their beneficial effect in RA patients by inhibiting events induced by IL-15 in lymphocytes. Furthermore, leflunomide appears to mediate this effect by interfering with the JAK/STAT pathway.
Material and methods
Antibodies and reagents
The anti-CD18 (Lia 3/2) and anti-CD69 (TP1/55) monoclonal antibodies (mAb) have been described previously.12 The anti-CD54 (Hu5/3) mAb was kindly provided by Dr Luscinskas (Harvard Medical School, Boston, Massachusetts, USA). The MAB002 IgG1 negative control was purchased from R&D Systems (Minneapolis, MN) and the anti-CD154 (24–31) mAb was from Alexis Biochemicals (San Diego, California, USA).
Recombinant human IL-15 was supplied by PeproTech EC (London, UK). Cyclosporin A, mycophenolic acid, FK-506, methotrexate and the specific inhibitor of JAK3, 4-(4′-hydroxyphenyl)amino-6,7-dimethoxyquinazoline were provided by Calbiochem (La Jolla, California, USA). Sulphasalazine, uridine and guanosine were purchased from Sigma-Aldrich (Steinheim, Germany). Sodium aurothiomalate (gold salts) was supplied by Laboratorios Rubio (Madrid, Spain). The active metabolite of leflunomide, A77-1726, was kindly provided by Dr ML Herrmann (Aventis Pharma, Frankfurt, Germany).
Cells, cell stimulation and DMARD treatment
PBL were isolated from venous blood samples from healthy donors by Histopaque-1077 density-gradient centrifugation (Sigma Diagnostics, St Louis, Missouri, USA). Monocytes were removed by adhesion to Petri dishes (Costar, Cambridge, Massachusetts, USA). The human monocytic leukemia cell line THP-1 was maintained in RPMI 1640 medium (Flow Laboratories, Irvine, UK) supplemented with 10% fetal calf serum (Boehringer Mannheim, Germany), penicillin (50 U/ml) and streptomycin (50 μg/ml; Bio Whitaker, Walkersville, Maryland, USA).
PBL were incubated for 30 minutes in medium alone or with the following DMARD: A77-1726 (3-100 μmol); cyclosporin A (0.1–10 μg/ml); methotrexate (0.5–50 μg/ml); mycophenolic acid (0.01–1 μmol); FK-506 (0.01–1 μg/ml); sulphasalazine (100–1000 μg/ml) and gold salts (0.01–1 μg/ml). Subsequently, PBL were activated with IL-15 (50 ng/ml) for 24 h in the presence or absence of the DMARD. Cell viability after treatment was assessed by propidium iodide (Sigma-Aldrich) uptake (see supplementary table 1 available online only).
Inhibitory effect of A77-1726 and cyclosporin A on the expression of CD54 and CD69 induced by IL-15 in PBL
After 24 h of incubation with IL-15 and DMARD, PBL were washed three times with 10 ml of RPMI 1640 without supplementation with fetal calf serum or antibiotics. Then, the cellular pellets were resuspended in complete RPMI to be co-cultured with THP-1 cells at a final concentration of 106 PBL and 105 THP-1 cells (10 : 1 ratio) by each millilitre of medium.After co-culturing for 24 h, the supernatants were harvested and stored at −30°C. In each assay, we included a control in which the activated lymphocytes and monocytic cells were separated by a 0.4 μm pore membrane in a transwell.
Flow cytometry
After treatments, PBL were incubated with mAb against CD18, CD54, CD69, CD154 or a negative control mAb at 4°C for 30 minutes. Then, the cells were labelled with FITC goat anti-mouse immunoglobulin (Dako, Salstrup, Denmark) at 4°C for 30 minutes. At least 5 × 10³ cells were then analysed using a FACScan flow cytometer (Becton Dickinson Biosciences, San Jose, California, USA) and the data were collected using both a logarithmic and a linear scale. Data were normalised and expressed as the relative mean fluorescence intensity (rMFI) as follows:
rMFI = [(MFIMolecule − MFINegative control)/(MFIMolecule IL-15 −MFINegative control IL-15)] × 100
In some figures the data are shown as the percentage of the inhibitory effect of DMARD:
Inhibition (%) = 100 − [(MFIIL-15 + DMARD − MFIIL-15+medium) ×100/(MFIIL-15+medium)]
Quantification of cytokine concentration
The TNF concentration in the supernatants was measured using a sandwich enzyme immunoassay (EIA). The capturing antibody was the anti-TNF MAB610 (R&D Systems Europe Ltd, Abingdon, UK) used at a concentration of 8 μg/ml and the detection antibody was biotinylated anti-TNF mAb, BAF210 (R&D Systems) used at 200 ng/ml. As TNF production varied widely depending on the lymphocyte donor, in some figures it was normalised to the percentage inhibition of TNF production provoked by DMARD as follows:
Inhibition of TNF production = 100 − [(TNFDMARD − TNFTw)/(TNFmedium − TNFTw)]
To measure IL-17 concentrations in supernatants of IL-15-activated PBL the capturing antibody was the anti-IL17 mAb MAB317 (R&D Systems) used at a concentration of 4 μg/ml and the secondary antiserum was a biotinylated polyclonal anti-IL-17, BAF317, used at 100 ng/ml (R&D Systems). As IL-17 production varied depending on the lymphocyte donor, it was normalised considering 100% the IL-17 production of lymphocytes stimulated with IL-15 in the absence of DMARD:
IL-17 production = (IL-17DMARD*100)/IL-17medium)
In all cases cytokine values were calculated from the standard curves and the samples that generated values higher than the highest standard were diluted (1 : 1) in diluent buffer and assayed again.
STAT6 Western blot analysis
PBL were incubated for 30 minutes in medium alone or in the presence of A77-1726 at different concentrations (1–100 μmol), and subsequently lymphocytes were activated with IL-15 (50 ng/ml) for 5 minutes. The cells were then lysed in Laemmli buffer with 5% β-mercapto-ethanol, sonicated twice for 30 s at 4°C and boiled for 5 minutes at 100°C. All cell extracts were separated on 10% sodium dodecylsulphate–polyacrylamide gel electrophoresis gels and transferred to nitrocellulose membranes (Bio-Rad Laboratories; Hercules, California, USA). The nitrocellulose was blocked in 5% non-fat dry milk in TBST (50 mmol Tris base, 150 mmol NaCl, 0.1% Tween 20) for 15 minutes followed by 5 minutes wash in TBST. The membranes were then incubated overnight with an anti-human STAT6, phospho-specific (Tyr641) mAb diluted 1 : 1000 (clone 16E12; Calbiochem), and after three washes with TBST, they were exposed to a goat anti-mouse IgG horseradish peroxidase-labelled antibody (Pierce Biotechnology; Rockford, Illinois, USA) diluted 1 : 2000 in TBST for 45 minutes. After six washes in TBST, the membranes were developed by chemiluminescence with SuperSignal West Femto maximum sensitivity substrate (Pierce Biotechnology) and analysed with Image Gauge 3.4 software (Fuji Photo Film, Tokyo, Japan). To reprobe the blot and measure the loading control, the membranes were stripped with Restore Western blot stripping buffer (Pierce Biotechnology) at 42°C for 30 minutes. After blocking again, the membranes were incubated with the anti-human tubulin mAb DM1A (Sigma-Aldrich) at room temperature for 1 h, washed and developed as described above. Band intensity was determined by scanning the images with Image Gauge 3.4 software and the results were normalised considering the STAT6 phosphorylation when PBL were activated by IL-15 without previous exposure to A77-1726 at 100%.
Statistics
The statistical analysis was performed using Stata 9.2 for Windows. Variables with non-Gaussian distribution were analysed using the Kruskall–Wallis test and each treatment was compared with the data from the cells exposed to medium alone using a Mann–Whitney test with Bonferroni correction. Normal distributed variables were analysed by analysis of variance test. Accordingly, data were presented as median and interquartile range when non-parametric tests were applied or as mean (SEM) in normally distributed variables.
Results
Effect of different DMARD on the IL-15-mediated upregulation of CD69 and CD54 expression in peripheral blood lymphocytes
Different cell surface receptors, such as CD18, CD54, CD69 or CD154 have been involved in the activating interactions between lymphocytes and macrophages.3 5 6 7 Whereas the expression of CD69 and CD54 was induced by IL-15, CD18 and CD154 expression was not affected by this cytokine (data not shown). Therefore, we tested the effect of different drugs on the ability of IL-15 to upregulate CD69 and CD54 expression in PBL.
The active metabolite of leflunomide, A77-1726, cyclosporin A and FK-506 all inhibited the upregulation of CD69 and CD54 induced by IL-15 in PBL in a dose-dependent manner (fig 1A, table 1). In contrast, methotrexate, sulphasalazine, mycophenolic acid and gold salts did not exert any effect on the expression of these molecules (fig 1A).

Effect of different disease-modifying antirheumatic drugs (DMARD) on the upregulation of CD69 induced by IL-15 in peripheral blood lymphocytes (PBL) and on tumour necrosis factor (TNF) production by THP-1 cells induced by IL-15-activated PBL. PBL were exposed to A77-1726 (the active metabolite of leflunomide; 100 μmol), cyclosporin A (10 μg/ml), methotrexate (50 μg/ml), mycophenolic acid (1 μmol), FK-506 (1 μg/ml), sulphasalazine (1000 μg/ml) or sodium aurothiomalate (1 μg/ml) for 30 minutes. The cells were then stimulated with IL-15 (50 μg/ml) for 24 h and afterwards they were used in different assays: (A) The expression of CD69 was assessed by flow cytometry. Data are shown as the median (top of histogram) and interquartile range (IQR; the 25th and 75th percentiles being the lower and upper ends of the bar, respectively) of the relative mean fluorescence intensity (rMFI) from 10 independent experiments. (B) The IL-15-stimulated PBL were washed and co-cultured with THP-1 cells for an additional 24 h. In some experiments, the PBL and THP-1 cells were separated with a 0.4 μm pore transwell to define the effects that were independent of cell–cell contact (Tw). TNF release was measured in cell-free supernatants by enzyme immunoassay. The data are shown as the median and IQR of TNF production (pg/ml) from 15 independent experiments. The statistical significance in these multiple experiments (A and B panels) was determined using the Kruskall–Wallis test, followed by comparison of each treatment with respect to the medium alone using a Mann–Whitney test with Bonferroni correction (significance level considered if p<0.01). (C) Effect of the combination of cyclosporin A and A77-1726 on TNF production. Cells were treated as described above, except in the combined condition in which the lymphocytes were incubated with cyclosporin A (0.1 μg/ml) and A77-1726 (3 μmol) for 10 minutes before IL-15 stimulation. The data are shown as the median and IQR of TNF production (pg/ml) from five independent experiments. (D and E) Correlation between the inhibitory effects of DMARD on lymphocyte CD69 (D) and CD54 (E) expression and TNF production. The data are the mean ± SEM of the percentage inhibition of CD69 or CD54 expression or TNF production, from eight independent experiments. Medium represents cells stimulated with IL-15 in the absence of DMARD. Statistical analysis was performed by using Spearman correlation test. CyA, cyclosporin A; GS, gold salts; MA, mycophenolic acid; MTX, methotrexate; SSZ, sulphasalazine.
Effect of different DMARD on TNF production by macrophagic cells induced by IL-15-activated PBL
We next assessed the effect of DMARD in a model of TNF production when IL-15-activated PBL were co-cultured with THP-1. When PBL were activated with IL-15 in the presence of A77-1726, FK-506 or cyclosporin A, TNF production in the co-cultures with THP-1 cells was inhibited by 38% (SEM 7), 56% (SEM 16) and 52% (SEM 9), respectively (fig 1B). In contrast, the incubation of PBL with methotrexate, sulphasalazine, gold salts or mycophenolic acid did not induce any significant effect on TNF production under these conditions (fig 1B). The effect of A77-1726 and cyclosporin A was dose-dependent, and in combination they inhibited TNF production to a similar extent to that induced by each individual drug at a concentration 10-fold higher (fig 1C).
We then studied whether the effect of DMARD on the expression of CD69 and CD54 by IL-15-activated PBL was correlated with the inhibitory effect on the production of TNF in co-cultures of PBL and THP-1 cells. The inhibition of TNF production by THP-1 cells was closely correlated with the level of CD69 expression on IL-15-activated lymphocytes following exposure to DMARD (r = 0.63, p<0.001; fig 1D). However, the inhibition of CD54 expression by DMARD was more weakly correlated with the inhibition of TNF production (r = 0.42, p = 0.009; fig 1E).
Effect of different DMARD on the production of IL-17 induced by IL-15 in PBL
It has been shown that IL-15 triggers IL-17 production “in vitro” through a cyclosporin A-sensitive mechanism.13 We thus tested whether the aforementioned DMARD affected the IL-15-mediated production of IL-17 by PBL. The synthesis of IL-17 was time dependent and it was optimal after 72 h of IL-15 stimulation (data not shown). Therefore, we first treated PBL with DMARD and then stimulated them with IL-15 (50 ng/ml) for 72 h. The treatment of PBL with A77-1726, FK-506 and cyclosporin A significantly decreased IL-17 production (fig 2A) and, surprisingly, mycophenolic acid also provoked a significant inhibition of IL-17 synthesis (fig 2A). As this assay required 72 h of culture “in vitro” and mycophenolic acid and A77-1726 block guanosine and uridine synthesis, respectively, we assessed the effect of supplementing the culture medium with either guanosine (100 μmol) or uridine (100 μmol). While in the presence of guanosine the effect of mycophenolic acid on IL-17 production was completely reverted, the presence of uridine (100 μmol) did not prevent the inhibitory effect of A77-1726 on the production of IL-17 induced by IL-15 (fig 2B).
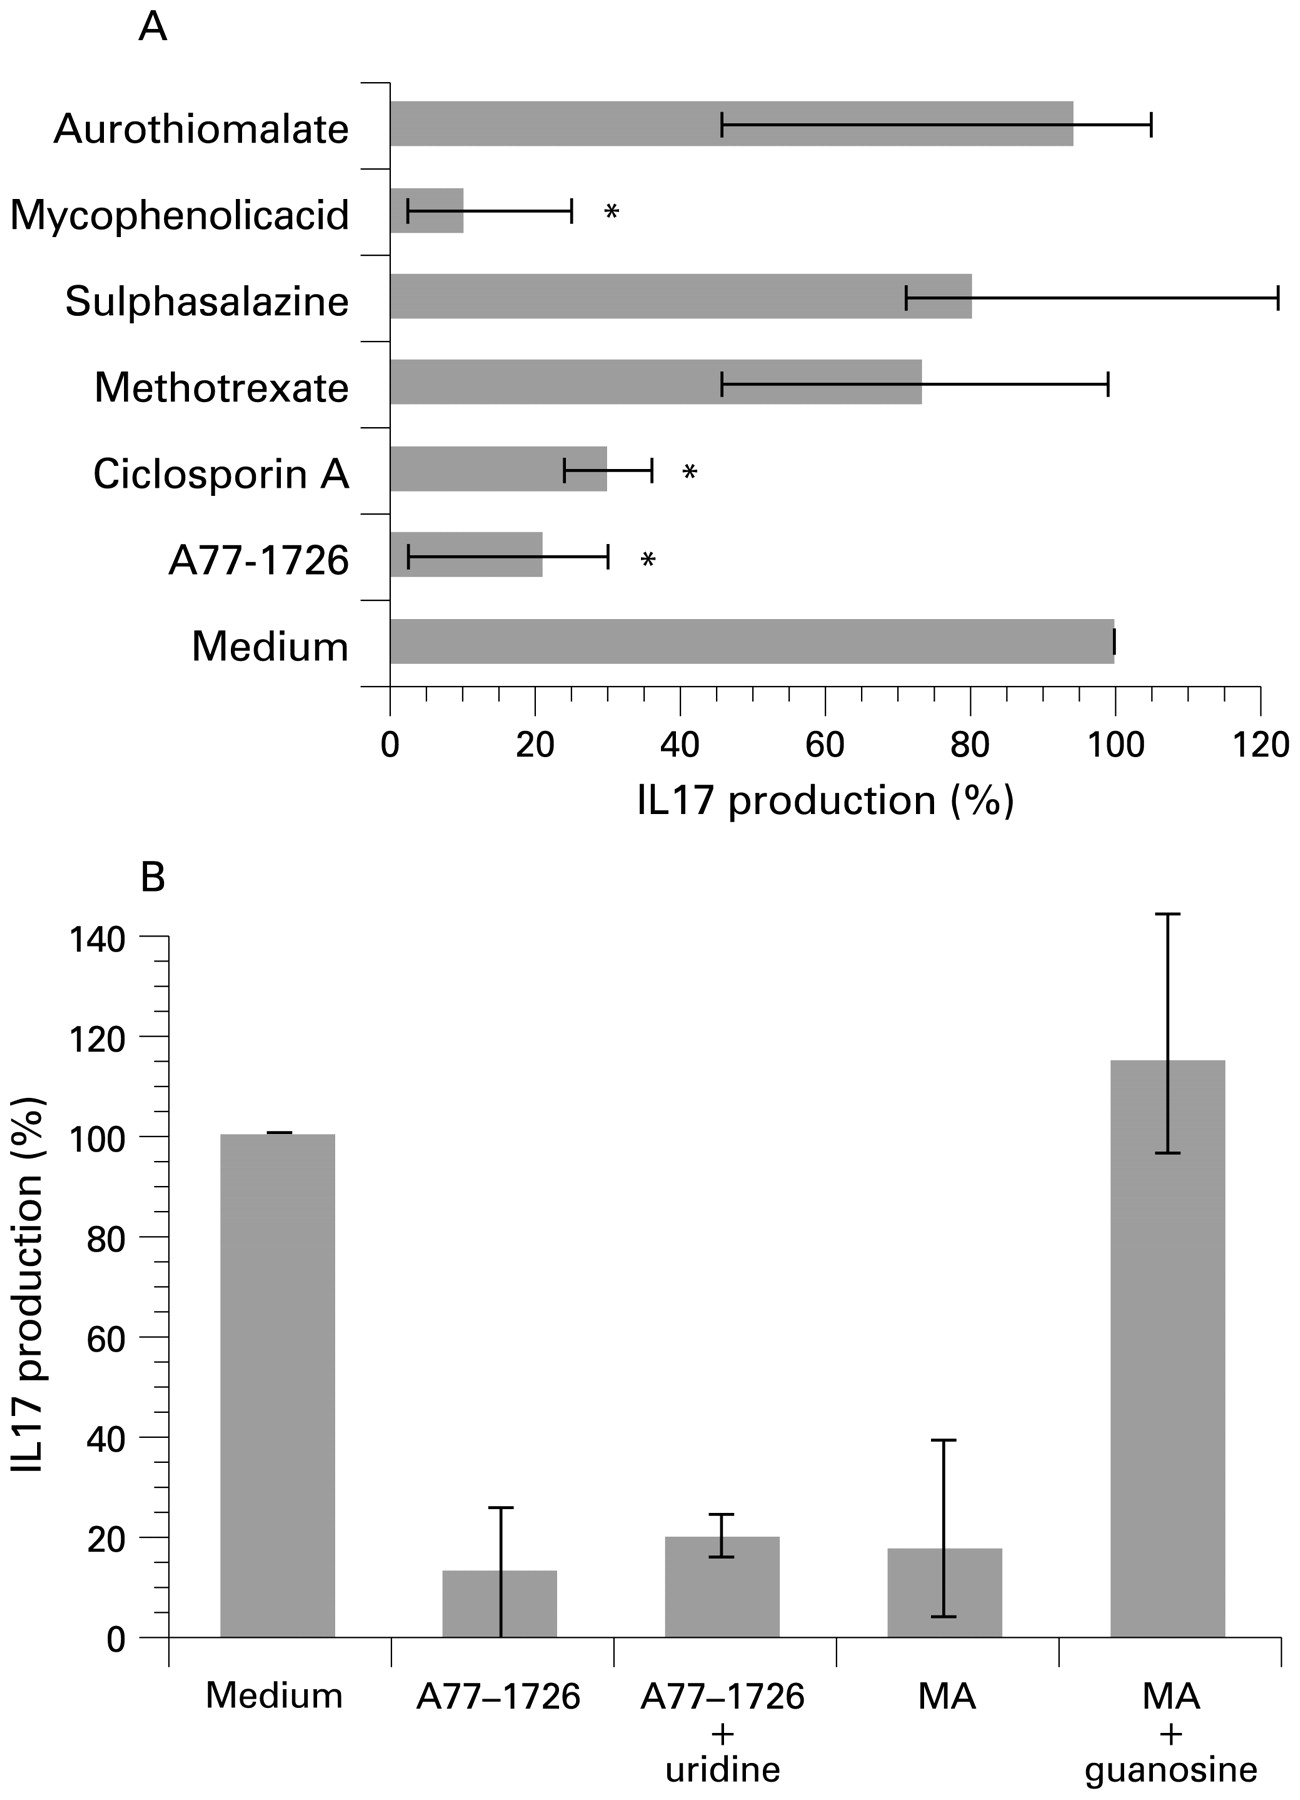
The effect of disease-modifying antirheumatic drugs (DMARD) on IL-17 production induced by IL-15 in peripheral blood lymphocytes (PBL). (A) PBL were pre-treated with A77-1726 (100 μmol), cyclosporin A (10 μg/ml), methotrexate (50 μg/ml), mycophenolic acid (MA); 1 μmol), FK-506 (1 μg/ml), sulphasalazine (1000 μg/ml) and sodium aurothiomalate (1 μg/ml) for 30 minutes and then stimulated with IL-15 (50 μg/ml) for 72 h. The supernatants were then harvested and IL-17 release was measured in cell-free supernatants by enzyme immunoassay (EIA). Data are shown as the median (top of histogram) and interquartile range (IQR; the 25th and 75th percentiles being the lower and upper ends of the bar, respectively) of the percentage of IL-17 production from 11 independent experiments. IL-17 production in the condition without DMARD treatment was considered 100% and it corresponds to a median concentration of IL-17 of 216 pg/ml (IQR 144–233). The statistical significance (*) in these multiple condition experiments was determined using the Kruskall–Wallis test followed by comparison of each treatment with the results obtained with medium alone using the Mann–Whitney test with Bonferroni correction (significance level p<0.01). (B) PBL were pre-treated with A77-1726 (30 μmol) in the presence or absence of uridine (100 μmol), as well as with mycophenolic acid (1 μmol) in the presence or absence of guanosine (100 μmol) for 30 minutes and they were then stimulated with IL-15 (50 μg/ml) for 72 h. The supernatants were harvested and IL-17 release was measured in cell-free supernatants by EIA. The data are shown as the median and IQR of the percentage of IL-17 production from six independent experiments. IL-17 production in the condition without DMARD treatment was considered 100% and it corresponds to a median concentration of IL-17 of 382 pg/ml (IQR 249–624).
Leflunomide inhibits the phosphorylation of STAT6
In light of the results presented above, we also tested the effect of A77-1726 upon CD69 and CD54 expression in the presence of uridine (100 μmol). Under these conditions, uridine did not prevent either the inhibitory effect of A77-1726 (30 μmol) on the upregulation of CD69 induced by IL-15 (fig 3A, left and middle panels), or the effect of A77-1726 on the IL-15-induced expression of CD54 (data not shown).

The inhibitory effect of A77-1726 on lymphocyte CD69 upregulation induced by IL-15 is mediated through the JAK/STAT pathway. (A) Peripheral blood lymphocytes (PBL) were treated with A77-1726 (30 μmol) for 30 minutes and then stimulated with IL-15 (50 μg/ml) for 24 h, in the absence (left panel) or presence (middle panel) of uridine (100 μmol). The effect of the JAK-3 inhibitor, 4-(4′-hydroxyphenyl)amino-6,7-dimethoxyquinazoline (10 μg/ml), is represented in the right panel. One representative experiment of four is shown and, in each panel, the following histograms are represented: negative control (dotted line), CD69 basal expression (green solid line), CD69 expression after IL-15 stimulation (black solid line), CD69 expression in PBL treated with A77-1726 or JAK-3 inhibitor and stimulated with IL-15 (red solid line). (B) PBL were pretreated with A77-1726 at different doses (1, 3, 10, 30 and 100 μmol) or with medium alone for 30 minutes, and they were then stimulated with IL-15 (50 ng/ml) for 5 minutes. The cells were lysed and the lysates processed to detect the phosphorylated form of STAT6 (upper line) or tubulin (lower line) as described in the Materials and methods section. The figure represents one of five independent experiments. (C) Band intensities were quantified from the nitrocellulose membranes using Image Gauge 3.4 software. Values were normalised considering 100% the intensity of the band obtained with lysates from PBL stimulated with IL-15 in absence of leflunomide pretreatment. Data are shown as the mean ± SEM of five independent experiments and the statistical significance was determined with an analysis of variance with the Bonferroni correction.
It has been suggested that A77-1726 can interfere with signal transduction, probably by inhibiting tyrosine kinases.14 In this regard, JAK3 is known to be involved in the signalling of the IL-15 receptor.15 Interestingly, a specific inhibitor of JAK3 produced a similar effect to that of A77-1726 on IL-15-induced CD69 expression in PBL (fig 3A, right panel), raising the possibility that leflunomide inhibits IL-15 signalling. We therefore studied the ability of this drug to inhibit STAT6 phosphorylation in PBL after IL-15 stimulation, and indeed A77-1726 caused a dose-dependent inhibition of STAT6 phosphorylation at doses similar to those used above (fig 3B and C). Similar results were obtained when we studied STAT3 phosphorylation (data not shown).
Discussion
Cell–cell interactions significantly contribute to synovial inflammation in RA.16 In the model of TNF production in co-cultures of IL-15-activated lymphocytes and monocytic THP-1 cells, our data confirm the relevance of CD54 and CD69 previously established.3 5 Therefore, we show that the DMARD that are able to inhibit the IL-15-mediated upregulation of CD54 and CD69 interfere with TNF production in this model. The data regarding CD69 are of particular interest because the elusive nature of its ligand has prevented its role in autoimmune disorders from being mechanistically characterised. Our data show a clear dose-dependent relationship between the expression of CD69 on lymphocytes and the production of TNF by macrophagic cells, suggesting that CD69 upregulation in lymphocytes could be more relevant than that of CD54 in this model.
Our finding that cyclosporin A, FK-506 and leflunomide inhibit key events in the perpetuation of TNF and IL-17 production may further explain the effectiveness of these compounds in the treatment of RA. Indeed, IL-17 acts synergistically with TNF and IL-1 to induce RANKL synthesis and therefore mediates metalloprotease synthesis by synoviocytes and osteoclast formation.17 The inhibition of both TNF and IL-17 production when lymphocytes are exposed to cyclosporin A and leflunomide could thus explain the prevention of radiological progression in RA patients undergoing treatment with these drugs.18 19
Regarding the mechanism by which cyclosporin A, FK-506 and leflunomide influence the IL-15-mediated synthesis of CD69 and IL-17, cyclosporin A-sensitive sequences have been identified in the promoter of CD69,20 and IL-17 production induced by IL-15 was previously reported to be inhibited by cyclosporin A.13 It is conceivable that FK-506 exerts its inhibitory effect in a similar way because both cyclosporin A and FK-506 inhibit calmodulin and FK-506 has been shown to inhibit the upregulation of CD69.21 22 The mechanism by which leflunomide acts is thought to involve the inhibition of “de novo” pyrimidine nucleotide biosynthesis. However, we found that uridine could not overcome the inhibition of IL-15-mediated events. IL-15 receptor signalling involves, in part, JAK1 and JAK3 kinases, which mediate the phosphorylation of STAT3, STAT5 and STAT6.15 Indeed, leflunomide can inhibit tyrosine kinases and especially JAK3 kinase.23 24 Interestingly, we found that a specific inhibitor of JAK3 inhibits both the upregulation of CD69 and the synthesis of IL-17 induced in PBL by IL-15 to a similar extent as A77-1726 (the active metabolite of leflunomide). Moreover, we have demonstrated that A77-1726 inhibited the phosphorylation of STAT6 and STAT3 induced by IL-15.
However, A77-1726 is a more potent inhibitor of dihydroorotate dehydrogenase than of JAK3 kinase in murine models.23 Whether this also occurs in humans was not clear. Here, we demonstrated the inhibition of STAT6 phosphorylation in human PBL at low A77-1726 concentrations, similar to those detected in the serum of patients treated with leflunomide.25 A toxic effect can also be ruled out because other authors have shown that lymphocytes exposed to A77-1726 at 100 μmol are viable and they upregulate their CD69 expression when they are exposed to phytohaemagglutinin plus phorbol myristate acetate.26 In addition, it has also been described that leflunomide can induce other anti-inflammatory events that can not be explained by the inhibition of dihydroorotate dehydrogenase.27 28 All these findings suggest that inhibition of tyrosine kinases may contribute to the antirheumatic effects of leflunomide.
With respect to the clinical application of these findings, combined therapies seem to offer strategies to improve disease activity, disability and to prevent radiological progression.29 30 31 Here, we provide information regarding the effect of cyclosporin A and leflunomide on lymphocyte-mediated mechanisms involved in the perpetuation of synovial inflammation. Conversely, other DMARD such as methotrexate or sulphasalazine have been shown directly to inhibit monocytic cells and synoviocytes.32 33 Therefore, to combine DMARD with different mechanisms of action, in order to interact with a wider range of pathogenic pathways involved in chronic synovitis, should result in a better control of inflammation.
REFERENCES
Supplementary materials
Web only appendix for 68;10:1644
Files in this Data Supplement:
Footnotes
Funding This work was funded by grants FIS 04/2009, 05/2041 and G03/152 from the Instituto de Salud Carlos III to IG-A.
Competing interests Declared. IG-A has received unrestricted grants from Abbott Laboratories and Bristol-Myers Squibb. CD-J was supported by grants from Sanofi-Aventis and Fundación Española de Reumatología. AA-B was supported by a DIB-SER grant from the Fundación Española de Reumatología.
Ethics approval Ethics approval was obtained.
▸ Additional supplementary table 1 is published online only at http://ard.bmj.com/content/vol68/issue10