Article Text

Abstract
Objective Many autoantibodies are known to be associated with SLE, although their role in clinical practice is limited because of low sensitivity and weak associations with clinical manifestations. There has been great interest in the discovery of new autoantibodies to use in clinical practice. In this study, we investigated 57 new and known antibodies and their potential for diagnostics or risk stratification.
Methods Between 2014 and 2017, residual sera of all anti-dsDNA tests in the UMC Utrecht were stored in a biobank. This included sera of patients with SLE, patients with a diagnosis of another immune-mediated inflammatory disease (IMID), patients with low (non-IMID) or medium levels of clinical suspicion of SLE but no IMID diagnosis (Rest), and self-reported healthy blood bank donors. Diagnosis and (presence of) symptoms at each blood draw were retrospectively assessed in the patient records with the Utrecht Patient-Oriented Database using a newly developed text mining algorithm. Sera of patients were analysed for the presence of 57 autoantibodies with a custom-made immunofluorescent microarray. Signal intensity cut-offs for all antigens on the microarray were set to the 95th percentile of the non-IMID control group. Differences in prevalence of autoantibodies between patients with SLE and control groups were assessed.
Results Autoantibody profiles of 483 patients with SLE were compared with autoantibody profiles of 1397 patients from 4 different control groups. Anti-dsDNA was the most distinguishing feature between patients with SLE and other patients, followed by antibodies against Cytosine-phosphate-Guanine (anti-CpG) DNA motifs (p<0.0001). Antibodies against CMV (cytomegalovirus) and ASCA (anti-Saccharomyces cerevisiae antibodies) were more prevalent in patients with SLE with (a history of) lupus nephritis than patients with SLE without nephritis.
Conclusion Antibodies against CpG DNA motifs are prevalent in patients with SLE. Anti-CMV antibodies are associated with lupus nephritis.
- autoantibodies
- lupus erythematosus
- systemic
- autoimmune diseases
Data availability statement
Data are available on reasonable request. The data underlying this article cannot be shared publicly for privacy reasons. The data will be shared on reasonable request to the corresponding author.
This is an open access article distributed in accordance with the Creative Commons Attribution Non Commercial (CC BY-NC 4.0) license, which permits others to distribute, remix, adapt, build upon this work non-commercially, and license their derivative works on different terms, provided the original work is properly cited, appropriate credit is given, any changes made indicated, and the use is non-commercial. See: http://creativecommons.org/licenses/by-nc/4.0/.
Statistics from Altmetric.com
Key messages
What is already known about this subject?
Many different autoantibodies have been investigated in SLE, although only a limited number of autoantibodies are being used in clinical practice.
What does this study add?
This study describes a high prevalence of anti-CpG antibodies in patients with SLE and a correlation of anti-CMV antibodies with lupus nephritis.
How might this impact on clinical practice or future developments?
Further research into anti-CpG autoantibodies might open up new diagnostic possibilities and provide new insights into the complex pathophysiology of SLE.
Introduction
SLE is a systemic immune-mediated inflammatory disease (IMID) with a wide variety of associated symptoms and immunological manifestations.1 2 This heterogeneity in symptoms and lack of diagnostic criteria make SLE difficult to diagnose as there is no single laboratory test that can reliably confirm or exclude its presence.
Autoantibodies are a common immunological feature in patients with SLE and are known to be involved in its pathogenesis. Autoantibodies can bind antigen, so to form immune complexes, which can deposit in the skin or small vessels of the kidney and together with complement factors can cause inflammation.3 Historically, autoantibodies have always been a component of classification criteria for SLE, although not necessarily required for classification.4 5 However, in the new EULAR/ACR classification criteria, ANAs are now required to be present in order to classify a patient as having SLE.1 Out of all ANAs, autoantibodies against double-stranded DNA (anti-dsDNA) have the strongest association with SLE and are present in up to 75% of all patients with SLE.6 In clinical practice, suspicion of SLE is the only reason for testing for anti-dsDNA antibodies, as tests for anti-dsDNA antibodies are known to have a high diagnostic specificity for SLE, although sensitivity varies.7 Other common SLE-associated autoantibodies include antibodies against phospholipids (anti-cardiolipin, anti-beta2GP1), anti-Smith (anti-Sm), anti-C1q and anti-Ro/La antibodies. Some of these autoantibodies have also been reported to be associated with organ-specific manifestations, for example anti-C1q with renal involvement.8
Although many different autoantibodies have been investigated in SLE, only a limited number of autoantibodies are being used in clinical practice. Due to these limitations, there has been great interest in the discovery of new autoantibodies that can be used in clinical practice. In this study, we used a new microarray containing 57 autoantigens, some of which have never been explored in large cohorts, to analyse over 1500 serum samples of patients who were suspected of having SLE to explore their potential role in the diagnostic process and their association with symptoms of SLE.
Patients and methods
Patients
This study was performed in the University Medical Center Utrecht (UMC Utrecht), a tertiary care university hospital in the Netherlands. Between 2014 and 2017, residual material of all blood samples that were tested for the presence of anti-dsDNA in the UMC Utrecht were collected in a biobank and stored at −80°C. Additional serum samples from self-reported healthy blood bank donors (BBD) were provided by Thermo Fisher Scientific.
Clinical data
Clinical data of all patients from whom these samples were collected, were retrospectively gathered from the electronic health records (EHR) to assess the diagnosis and symptoms at the time each sample was taken. Since blood draw does not always happen on the same day as the visit to the clinician, all available data from the EHR up to 14 days after blood draw date were evaluated. All collected data were pseudonymised for privacy reasons.
Clinical data were extracted from the EHR through the Utrecht Patient Oriented Database (UPOD). UPOD is an infrastructure of relational databases comprising logistic and medical data for all patients treated at the UMC Utrecht since 2004.9 A text mining algorithm was designed to extract the diagnosis and symptoms of patients automatically from the data of the EHR. To this end, the algorithm evaluated all physician’s notes and letters of physicians to other physicians. Text mining has several advantages over manual extraction, it has excellent traceability and reproducibility, and is very well suited for large populations and more flexible than manual extraction as additional research questions can be formulated.
Details of the text mining algorithm used in this study have been described in detail.10 In short, the text mining algorithm searches for pre-defined key words indicating the presence of a certain diagnosis or symptom in the written documents. Multiple diagnoses could be assigned to a single patient at the same time. Patients who did not get assigned any of these diagnoses were recorded as a ‘non-diagnosis’ group. The diagnoses assigned by the text mining algorithm do not necessarily comply with classification criteria for SLE and other IMIDs since these are mainly used to define a homogeneous population for research. Although most patients with a clinical diagnosis fulfil these criteria, in some cases classification criteria can be too restrictive for clinical practice. In this study, we assessed the clinical diagnoses in the EHR, rather than defining all patients according to classification criteria. It is noteworthy that, due to the working mechanism of the text mining algorithm, the recorded symptoms should be interpreted as having ever been present, rather than present at the moment of sample collection.
Patient groups
To assess the diagnostic value of the autoantibodies, we compared the presence of the autoantibodies in patients with SLE with four different control groups: In the first group, we included patients with a clinical diagnosis of an IMID other than SLE, as recorded by the treating physician in the EHR. This group was named the IMID control group. Patients without an IMID diagnosis recorded in the EHR were split into two different groups: in the second group, we selected patients most closely resembling healthy patients in our cohort as a primary control group, called the ‘non-IMID’ control group. These patients were seen at the outpatient clinic for manifestations associated with SLE, but were consequently not diagnosed with SLE or another IMID. Patients with either arthritis, nephritis or pleuritis, or two or more SLE-related symptoms were excluded from this group and recorded as the third group, called ‘Rest’. These patients had more symptoms associated with and were clinically more suspect of having an IMID, although not enough for the physician to diagnose them as such. It should be noted that all patients included in the biobank had visited the outpatient clinic, which indicates that these patients are not true healthy controls. However, these patients resemble the non-disease population in clinical practice the most. In the fourth group, we included serum samples from self-reported healthy BBD, supplied by Thermo Fisher Scientific.
The outcome of the text mining algorithm was evaluated to select samples for further serological evaluation. Due to the large number of patients in the non-diagnosis group, a proportion of these samples was randomly selected for further serological evaluation. All available samples from patients with a diagnosis recorded by the algorithm were included for serological evaluation. If patients had multiple serum samples stored in the biobank, the first and last sample were analysed for the presence of autoantibodies.
Serological data
A custom-made chip-based microarray (Thermo Fisher Scientific, Uppsala Sweden) was used to analyse the serum samples for the presence of 57 IgG autoantibodies. The microarray contained nine control spots for calibration. Each antigen on the microarray was deposited in triplicate. An overview of the antigens included in this study is presented in online supplemental table 1. These antigens were selected by literature research prior to this study and by expert opinion. The antigens used in the microarray are all commercially available or in-house antigens supplied by Thermo Fisher Scientific. The correlation between the antigens on the microarray and their commercially available counterparts was assessed previous to this study and was found to be generally high (Spearman’s correlation coefficients 0.58–0.88). Reproducibility of the microarray was studied extensively during development. An analysis of 72 slides, including all printed markers except guide spots, resulted in an overall coefficient of variance of approximately 5%. A full description of the microarray technology has been published previously.11
Supplemental material
All selected samples were thawed prior to analysis. These samples were diluted 1:40 in dilution buffer, after which 30 µL was added to the reaction wells of the microarray. Samples were incubated for 2 hours at room temperature in a humidity chamber, after which the slides were washed and 30 µL of polyclonal Fluorescence DyLight550 labelled rabbit F(ab′)2-anti-human IgG was added to the reaction sites. After 30 min of incubating, the slides were washed again and the fluorescence intensity was measured by a Tecan LS Reloaded laser scanner. Each assay contained 96 samples and 12 control samples. Fluorescence intensities of all individual spots, as well as lock background intensity, were recorded and processed with the GenePix Pro Microarray Analysis software. This software evaluates the homogeneity within individual spots and between spots coated with the same antigen following pre-established quality criteria. All samples were processed by the same scanner and handled by the same laboratory technician.
Statistical analysis
The first available sample of each patient was used to compare the prevalence of autoantibodies between groups. Cut-offs of levels of immunofluorescent intensity to determine positive and negative results for all antigens on the microarray chips were set to the 95th percentile of the non-IMID controls. This cut-off was chosen, rather than a cut-off using the 95th percentile of the BBD patients, because the methods of sample collection and storage for the non-IMID group were identical to the rest of the cohort, but slightly different for the BBD, and because the non-IMID patients better represent the non-diseased patients seen in the hospital than the BBD. Categorical analysis was performed with the χ2 test. Correction for multiple testing was done by Bonferroni correction. Statistical analysis was performed using SPSS (V.25.0.0.2).
Results
Demographics
Blood samples of 2038 patients were collected in the biobank, with a total of 4607 collected samples. An overview of the baseline characteristics at the time of first sample collection per diagnosis is presented in table 1A. Patients with multiple diagnoses are represented in multiple rows. At the time of their first sample collection, a total of 1123 diagnoses were assigned to a total of 836 patients; 484 of these patients were assigned the diagnosis SLE. Also, 1202 patients were not assigned any diagnosis. The average age of the patients at the time the first sample was collected was 44.9 years (SD 16,9); 63.4% were female. Multiple samples were available in the biobank for 550 patients, and follow-up samples were not included in this analysis. A mean of 5.3 samples were collected for patients with SLE (range 1–26); for all other patients, this was a mean of 1.2 samples (range 1–14).
Demographics
In the present study, a total of 1880 serum samples were analysed, including 483 samples of patients with SLE, 346 patients with another IMID, 690 patients with no diagnosis and 361 self-reported healthy BBD (figure 1). Seven samples of patients with SLE or another IMID were not analysed on the microarray: one sample was missing from the biobank; six samples were mistakenly not selected, because they were not assigned an IMID diagnosis during the selection of samples to analyse on the microarray, which was done using a pre-final iteration of the text-mining algorithm. Demographics of all groups are shown in table 1B.

Flowchart of samples analysed on microarray per patient group. Overview of number of samples analysed on microarray for all patient groups. Samples of 1 patient with SLE and 6 patients with a diagnosis of another IMID were not analysed on the microarray system:1 sample was missing from the biobank; 6 samples were mistakenly not selected.
Overlapping diagnoses
It is known that different IMIDs often overlap with regard to diagnosis and symptoms. In our cohort, 248 out of 836 (29.7%) patients were assigned more than one diagnosis, indicating that overlap of multiple diseases was common in our cohort. An overview of all overlapping diagnoses is presented in online supplemental table 2. Moreover, 40.5% of all patients with SLE had overlap with at least one other diagnosis, 13.2% of all patients with SLE had secondary APS, whereas 4.1% had secondary Sjogren’s syndrome. Overlap of SLE with cutaneous lupus erythematosus (CLE), lupus-like disease (LLD, also referred to as incomplete lupus or iSLE), rheumatoid arthritis (RA) and mixed connective tissue disease (MCTD) was also recorded frequently.
Supplemental material
Symptoms of patients with SLE
Fatigue was the most common symptom with a prevalence of 60.3%. Lupus nephritis, pericarditis and pleuritis were assigned to 33.3%, 12.8% and 14.0% of all patients with SLE, respectively. Psychosis was rare as a manifestation of SLE, with a prevalence of 4.2%. A small number of patients (2.3%) had no symptoms at the time of their first visit according to the text mining algorithm. An overview of all symptoms is presented in table 2.
Prevalence of features of SLE at the time of the first sample and at the time of the latest follow-up sample
Analysis of autoantibodies
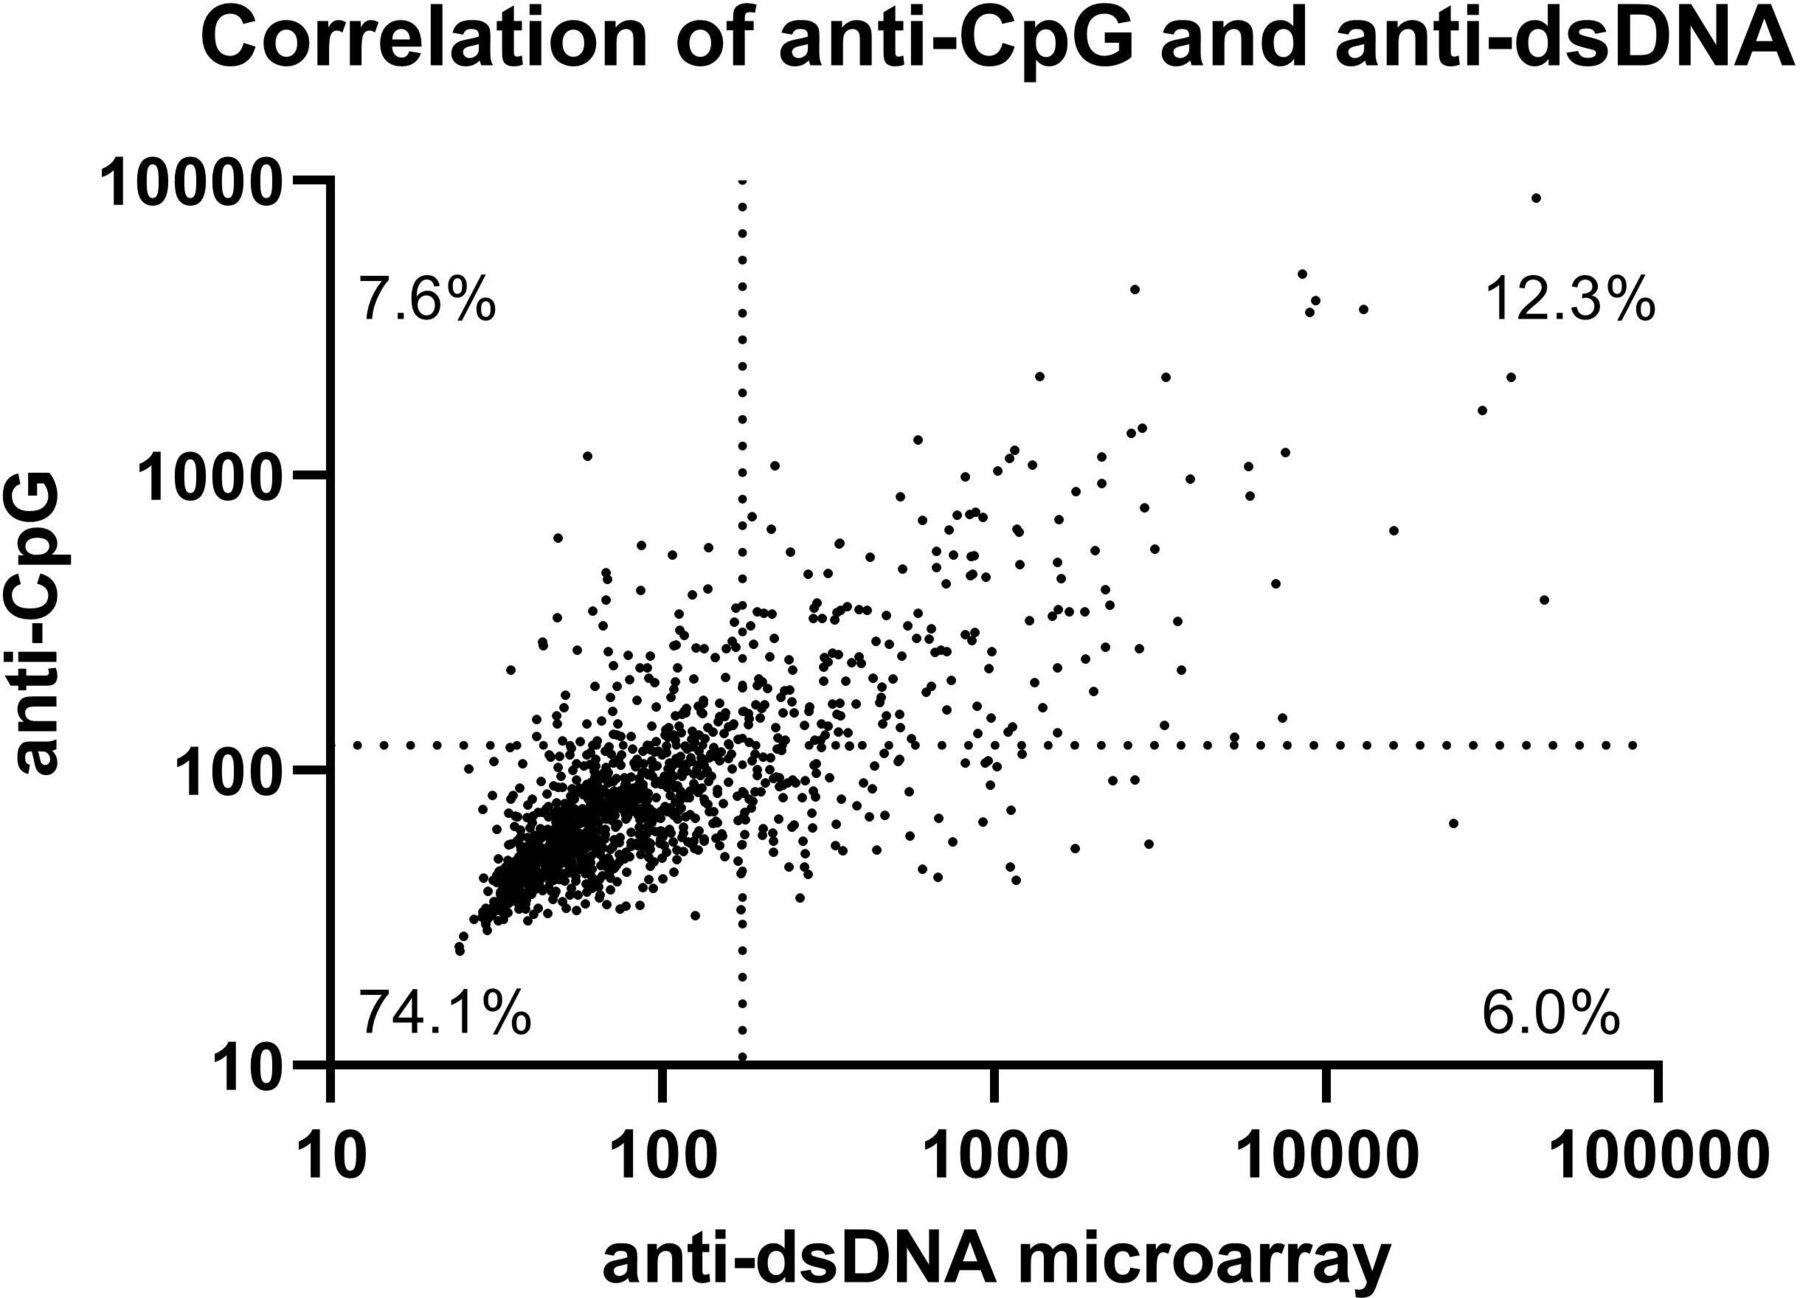
Measurements of anti-dsDNA antibodies from the regular laboratory measurement and the microarray correlated moderately (Spearman’s ρ 0.578). Using the cut-offs as defined in the methods, the prevalence of multiple autoantibodies was significantly higher in patients with SLE, compared with non-IMID controls (table 3, see online supplemental file 3 for ROC curves and AUC values). Antibodies against dsDNA were the most common antibody found in patients with SLE, with a prevalence of 41.2%, followed by antibodies against single-stranded Cytosine-phosphate-Guanine (CpG) oligodinucleotides (CpG ODN 2216), with a prevalence of 40.2%. Antibodies against dsDNA and CpG were also the most distinguishing feature between patients with SLE and the rest group, the BBD and all other patients with another IMID (figure 2). Antibodies against dsDNA and CpG correlated moderately (Spearman’s ρ 0.749, figure 3). Of all patients, 7.4% was positive for anti-CpG antibodies and negative for anti-dsDNA antibodies. In patients with SLE, 8.9% of patients was positive for anti-CpG antibodies and negative for anti-dsDNA antibodies. Also, 15.1% of patients with SLE negative for anti-dsDNA were positive for anti-CpG antibodies, as well as 12.7% of patients with SLE with no anti-dsDNA and/or lowered complement factors (online supplemental file 3).
Supplemental material
Prevalence of autoantibodies in patients with SLE, non-IMID controls, rest group, BBD controls and patients with other IMIDs, and prevalence of autoantibodies in patients with SLE with nephritis

Levels of immunofluorescent intensity. The 5th–95th percentile of immunofluorescent intensity is presented for (A) anti-dsDNA, (B) anti-CpG, (C) anti-Ro60 antibodies for patients with SLE (n=483), non-IMID controls (n=218), the ‘rest’ group (n=472), blood bank donors (n=361) and patients with other AID (n=346). The 5th–95th percentile of immunofluorescent intensity is presented for (D) anti-dsDNA, (E) anti-ASCA, (F) anti-CMV antibodies for patients with SLE with and without nephritis. The dotted lines represent the cut-off between negative and positive results. *p<0001, #p=0001, ns=not significant. Prevalence of autoantibodies in the respective groups vs SLE, based on cut-offs (A–C). For comparisons between other groups, see online supplemental file 3.
Correlation of anti-dsDNA and anti-CpG antibodies. Scatterplot of anti-dsDNA and anti-CpG antibodies in all patients, immunofluorescent intensity measured using the microarray. Spearman’s ρ=0.749. The dotted lines represent the cut-off between negative and positive results.
Prevalence of most autoantibodies was similar in the non-IMID and BBD control groups, although the autoantibodies anti-Ro52/60 and anti-La were more prevalent in the non-IMID group and (nearly) absent in the BBD group (table 3). These differences suggest that patients who come to the outpatient clinic have a different serological profile than healthy blood donors, even without the patient being labelled as having a specific diagnosis. Prevalence of the antibodies most prevalent in patients with SLE, such as antibodies against RipP1, SmBB and histones, was slightly higher in the rest group compared with the non-IMID group. This indicates that, although these patients are not diagnosed with an IMID, they do not only display more SLE-related symptoms than the non-IMID group, but their serological profile is also a little bit closer to that of patients with SLE. The overall prevalence of autoantibodies in patients with other IMIDs than SLE is markedly higher than the prevalence in the non-IMID group, although many autoantibodies known to be associated with SLE are still significantly more prevalent in patients with SLE (table 3).
Associations with nephritis
Antibodies against CpG, SmBB, Histones, Nucleosomes, Mi2, CMV (cytomegalovirus) and ASCA (anti-Saccharomyces cerevisiae antibody) were more prevalent in patients with SLE with nephritis compared with patients without nephritis, although only differences in antibodies against CMV (31.7% vs 17.8%) and ASCA (8.1% vs 1.6%) remained significant after Bonferroni correction for multiple testing.
Discussion
Our study focused on exploring the potential role of a number of autoantibodies, both well-known and lesser-known, in the diagnostic process and their associations with symptoms of SLE. We evaluated serum samples from more than 1500 patients for the presence of 57 autoantigens using a new microarray. We show a moderate association of anti-CMV and anti-ASCA antibodies with lupus nephritis and identified antibodies against CpG DNA motifs to be strongly associated with SLE.
In this study, we show that autoantibodies against CpG were highly discriminatory between patients with SLE and non-IMID controls and patients with other IMIDs. As an individual marker, the diagnostic potential of anti-CpG antibodies for SLE appears to be better than most other autoantibodies currently used in clinical practice, only secondary to anti-dsDNA. Furthermore, although this difference is not significant after Bonferroni correction, we show an increased prevalence of anti-CpG antibodies in patients with SLE with nephritis, compared with patients without nephritis, potentially further increasing their diagnostic applicability (table 3). CpG motifs are unmethylated cytosine-phosphate-guanine oligodinucleotides, DNA patterns that are 20 times more prevalent in bacterial DNA than in mammalian DNA. CpG is recognised by the innate immune system as a pathogen-associated molecular pattern and can induce an interferon response by stimulating intracellular toll-like receptor 9 (TLR9).12 13 In patients with SLE, an interferon signature is seen in 60%–80% of patients, as well as an increase in the number of neutrophil extracellular traps (NETs), which both can be induced by stimulation of TLR9.14–16 Mitochondrial DNA (mtDNA) is known to contain relatively high amounts of CpG motifs, compared with nuclear DNA, likely due to the bacterial evolutionary origin of the organelle.17 18 mtDNA is also expelled from the cell in the process of NETosis, possibly providing a source of antigen for anti-CpG antibodies.19 Recently, Becker et al suggested that the Farr assay commonly used for detection of dsDNA also detects antibodies against CpG-rich mtDNA. Furthermore, they speculate about the existence of antibodies preferentially binding to mtDNA rather than genomic DNA.20 Our results suggest that antibodies against CpG motifs might fill this role.
Antibodies specific against CpG have only been described in one human study in which patients were injected with CpG as standalone treatment or as adjuvant for NY-ESO-1-specific cancer vaccines. Also, 21 out of 37 patients developed antibodies against CpG; no correlations with anti-dsDNA, antinuclear antibodies or autoimmune manifestations were seen.21 Previous studies have described that some anti-dsDNA antibodies preferentially bind to CpG-containing dsDNA and that immune complexes of DNA and anti-DNA antibodies are relatively rich of immunostimulatory CpG motifs, but did not describe specific anti-CpG antibodies.22 23 As our study was not designed to determine the exact specificities of antibodies, we cannot rule out that the results for anti-CpG antibodies in our study can at least partially be explained by cross-reactivity of anti-dsDNA antibodies with the CpG motifs on the microarray. In our study, we do find a correlation between anti-CpG and anti-dsDNA antibodies; however, the CpG antigen used in this study was single-stranded DNA, making cross-reactivity of anti-dsDNA antibodies less likely. Furthermore, we show that anti-CpG antibodies are present in 15.1% of patients with SLE who do not have anti-dsDNA antibodies, indicating potential additional value in the diagnostic process of SLE.
Our study also shows that IgG anti-CMV antibodies are more prevalent in patients with SLE (22.4%), particularly in patients who have experienced lupus nephritis (31.7%). CMV is a known cause of opportunistic infections in patients with SLE who are being treated with immunosuppressive medication, and an aetiological role of CMV in the onset of SLE has been suggested.24 Zhang et al showed that 5.3% of patients with lupus nephritis had a CMV infection or reactivation, measured by CMV pp65 antigenemia, during hospitalisation.25 Furthermore, Su et al showed that almost all patients with SLE have IgG anti-CMV antibodies, but that patients who were also positive for IgM anti-CMV antibodies had the highest titres of anti-CMV IgG and had higher SLEDAI scores.26 Unfortunately, in our study we only have data of IgG anti-CMV antibodies, making it impossible to distinguish active from past infection, but this finding contributes to the expanding evidence of the relation between CMV and SLE.
We also found significant differences in the prevalence of ASCA antibodies in patients with and without lupus nephritis, although the prevalence of these autoantibodies is probably too low to be of clinical relevance. Although ASCA antibodies are most commonly associated with Crohn’s disease, they have also been found in serum of patients with SLE. Interestingly, we did not find associations between anti-dsDNA or anti-C1q and nephritis, which have previously been described in literature.27 28 We speculate that this might be because the patients with lupus nephritis in our cohort often do not necessarily have active lupus nephritis, but rather a history of lupus nephritis, and these antibodies are most strongly associated with active nephritis.
Our study is unique in the number of patients with SLE included and in the use of multiple relevant control groups. Whereas most studies investigate differences in biomarkers between diseased and healthy controls, our study contains healthy controls as well as all three groups of patients visiting the outpatient clinic: patients with SLE, patients with another IMID and patients with signs and symptoms, but who cannot be diagnosed with a circumscriptive diagnosis. Although these patients do not receive a diagnosis, we show that there are clear differences in their serological profile compared with healthy blood donors, most clearly exemplified by the differences in presence of anti-Ro and anti-La antibodies. We argue that in studies investigating the diagnostic characteristics of autoantibodies, it would be most helpful to compare patients with SLE with patients who visit the outpatient clinic but do not receive a diagnosis, rather than from healthy controls, because this will provide more insight into the clinical relevancy.
Our study has several strengths: We used a dedicated custom microarray system to study the presence of autoantibodies in a large cohort of patients with SLE, which we compared with multiple relevant control groups. All autoantibodies included on this microarray system have been reported to be present in serum of patients with SLE in one or more studies (see online supplemental table 1). Furthermore, intra-observer and inter-observer variability are known to occur in review of medical records in patients with SLE.29 In our study, we removed this variability by assessing all relevant information in an automatised and therefore uniform manner.
Our study also has some limitations. Although we previously showed that the text mining algorithm performs well in recognising patients with SLE, the text mining algorithm is not infallible, resulting in misclassification of a small number of patients. However, our text mining algorithm performs very well with a very high sensitivity and specificity in detecting patients with SLE (>90%), which should be adequate in a large cohort like this.10 Ideally, the results of this study should be validated in patients meeting the classification criteria for SLE, rather than patients with a clinical diagnosis of SLE. Our study did not include the use of immunosuppressive medication in the analysis, although some types of medication, such as belimumab and rituximab, are known to be able to influence levels of autoantibodies. Since patients with SLE, particularly with severe symptoms, are more likely to receive these types of medication, this could introduce a bias, resulting in a lower prevalence of autoantibodies in this group.
In conclusion, autoantibodies against CpG were shown to be strongly associated with SLE and can possibly help physicians in diagnosing SLE whenever a patient does not have anti-dsDNA antibodies. Our study presents insight into correlations of autoantibodies and symptoms of SLE, which in the future might be used in patient stratification. Our finding of a high prevalence of anti-CpG antibodies raises questions about their potential role in pathophysiology. Cross-reactivity of anti-CpG and anti-dsDNA antibodies, the preferred source of anti-CpG DNA, as well as the relation of anti-CpG antibodies with NETosis and CpG-rich mitochondrial DNA should be investigated. Further research into anti-CpG autoantibodies can possibly provide new insights into the complex pathophysiology of this disease, leading to advances towards a reliable risk stratification and new treatment strategies.
Data availability statement
Data are available on reasonable request. The data underlying this article cannot be shared publicly for privacy reasons. The data will be shared on reasonable request to the corresponding author.
Ethics statements
Patient consent for publication
Ethics approval
The requirement for informed consent was waived by the biobank committee of the UMC Utrecht. This study was conducted in accordance with the Helsinki Declaration of 1975 as revised in 2014 and approved by the biobank committee of the UMC Utrecht (Toetsingscommissie Biobanken UMC Utrecht, TCBio protocol no. 16-824).
References
Supplementary materials
Supplementary Data
This web only file has been produced by the BMJ Publishing Group from an electronic file supplied by the author(s) and has not been edited for content.
Footnotes
Contributors HO, JMvL, ML, LM-A and JD contributed to the conceptualisation and design of the study. IH and SH extracted relevant information from the Electronic Health Records. RM prepared and performed the serological analysis of the microarrays. TB performed data analysis and data visualisation. All authors contributed to data interpretation. TB wrote the manuscript. All authors critically reviewed the manuscript. HO acts as guarantor for this study.
Funding This work was supported by Thermo Fisher Scientific (Uppsala, Sweden).
Competing interests LM-A and JD are employed by Thermo Fisher Scientific. JL reports grants from Astra Zeneca, MSD, Thermo Fisher Scientific.
Provenance and peer review Not commissioned; externally peer reviewed.
Supplemental material This content has been supplied by the author(s). It has not been vetted by BMJ Publishing Group Limited (BMJ) and may not have been peer-reviewed. Any opinions or recommendations discussed are solely those of the author(s) and are not endorsed by BMJ. BMJ disclaims all liability and responsibility arising from any reliance placed on the content. Where the content includes any translated material, BMJ does not warrant the accuracy and reliability of the translations (including but not limited to local regulations, clinical guidelines, terminology, drug names and drug dosages), and is not responsible for any error and/or omissions arising from translation and adaptation or otherwise.