Article Text

Abstract
Objective Patients with SLE frequently have debilitating fatigue and reduced physical activity. Intermuscular adipose tissue (IMAT) accumulation is associated with reduced physical exercise capacity. We hypothesised that IMAT is increased in patients with SLE and associated with increased fatigue, reduced physical activity and increased inflammation.
Methods In a cross-sectional study, 23 patients with SLE and 28 control participants were evaluated. IMAT was measured in the calf muscles using sequential T1-weighted MRI. Patient-reported physical activity and fatigue were measured and a multiplex proteomic assay was used to measure markers and mediators of inflammation.
Results IMAT accumulation (percentage of IMAT area to muscle area) was significantly higher in SLE versus control participants (7.92%, 4.51%–13.39% vs 2.65%, 1.15%–4.61%, median, IQR, p<0.001) and remained significant after adjustment for age, sex, race and body mass index (p<0.001). In patients with SLE, IMAT accumulation did not differ significantly among corticosteroid users and non-users (p=0.48). In the study cohort (patients and controls), IMAT was positively correlated with self-reported fatigue score (rho=0.52, p<0.001) and inversely correlated with self-reported walking distance (rho=−0.60, p<0.001). Several markers of inflammation were associated with IMAT accumulation in patients with SLE, and gene ontology analysis showed significant enrichment for pathways associated with macrophage migration and activation in relation to IMAT.
Conclusion Patients with SLE have greater IMAT accumulation than controls in the calf muscles. Increased IMAT is associated with greater fatigue and lower physical activity. Future studies should evaluate the effectiveness of interventions that improve muscle quality to alleviate fatigue in patients with SLE.
- systemic lupus erythematosus
- inflammation
- lipids
Data availability statement
Data are available on reasonable request. All data relevant to the study are included in the article or uploaded as supplementary information.
This is an open access article distributed in accordance with the Creative Commons Attribution Non Commercial (CC BY-NC 4.0) license, which permits others to distribute, remix, adapt, build upon this work non-commercially, and license their derivative works on different terms, provided the original work is properly cited, appropriate credit is given, any changes made indicated, and the use is non-commercial. See: http://creativecommons.org/licenses/by-nc/4.0/.
Statistics from Altmetric.com
WHAT IS ALREADY KNOWN ON THIS TOPIC
Patients with SLE have a high prevalence of fatigue and reduced physical activity.
Adipose tissue accumulation in the muscle compartment, known as intermuscular adipose tissue (IMAT), is associated with reduced muscle performance and physical activity and may be a source of inflammation.
WHAT THIS STUDY ADDS
IMAT is increased in patients with SLE.
IMAT is associated with plasma markers of inflammation in patients with SLE.
IMAT is associated with reduced self-reported physical activity and fatigue.
HOW THIS STUDY MIGHT AFFECT RESEARCH, PRACTICE OR POLICY
Assessment of IMAT is important to understand the muscle function in SLE and may provide the opportunity to develop new therapeutic interventions to reduce inflammation and fatigue in patients with SLE.
Introduction
SLE is an inflammatory autoimmune disease with multiple manifestations including renal, cerebral and pulmonary complications that may result in critical illness. However, other manifestations, such as fatigue and reduced physical activity, are common and debilitating symptoms.
Fatigue is one of the most disabling symptoms and affects 53%–80% of patients with SLE.1 Fatigue in SLE is associated with decreased quality of life, sleep disturbance, depression and physical inactivity; however, the aetiology of this fatigue is unknown. Factors such as low-grade inflammation and reduced physical activity may play a role.2 Indeed, high type 1 interferon α and interferon-γ levels and reduced physical activity are commonly found in SLE and are related to fatigue.3 4
SLE is characterised by abnormal body composition and increased visceral fat.5 6 In conditions other than SLE, fat accumulation in the muscle compartment, also known as intermuscular adipose tissue (IMAT), increases with age,7 presence of diabetes,8 insulin resistance,9 renal disease10 and with reduced physical activity.11 IMAT may be a source of inflammation as a result of increased secretion of pro-inflammatory molecules and immune cell infiltration.12 13
IMAT has not been previously characterised in patients with SLE, although it may have a role in muscle-related symptoms. In this study, IMAT was evaluated using MRI, an important tool to quantifiy the distribution of ectopic adipose tissue. We hypothesised that IMAT is increased in patients with SLE compared with controls and it is associated with markers of inflammation. In a hypothesis-generating aim, we also evaluated the association between IMAT and decreased physical activity/increased fatigue in our cohort of patients.
Methods
Participants
Participants were recruited from Vanderbilt University Medical Center Clinics and the Greater Nashville area in a cross-sectional study that included two groups: (a) control participants without a history of SLE or autoimmune diseases and (b) patients with SLE, who met the 2017 American College of Rheumatology revised classification criteria for SLE.14 All participants were 18 years or older. Participants with any contraindication for MRI were excluded from the study.
Study protocol
Participants underwent a standardised interview, review of medical records, physical examination, fasting blood sample draws for clinical and specialised laboratory testing and MRI to quantify intermuscular adipose tissue.
Clinical characteristics
In patients with lupus, disease activity was evaluated using the SLE Disease Activity Index (SLEDAI)15 and disease damage was evaluated using the Systemic Lupus Collaborating Clinics/American College of Rheumatology Damage Index (SLICC) score.16 The modified Health Assessment Questionnaire was used to evaluate functional status. Self-reported fatigue was assessed by a 0–100 mm visual analogue scale (VAS). Self-reported comfortable walking distance was obtained, as previously described.17 Participants were asked, “how far can you walk comfortably?” in either yards, blocks or miles and the distance reported was then converted to miles. Glomerular filtration rate was estimated from creatinine using the Chronic Disease Epidemiology Collaboration formula.18 Hypertension was defined by the use of antihypertensive medications or office blood pressure ≥140/90 mm Hg (‘stage 2’ hypertension).19 The degree of insulin resistance was measured by the homeostatic model assessment for insulin resistance (HOMA-IR), calculated as (fasting glucose (mmol/L)×fasting insulin (μU/mL))/22.5.20
Intermuscular adipose tissue
IMAT, defined as the fat beneath the deep fascia of the muscle and between muscle groups, was calculated using five consecutive cross-sectional images of the calf region. Participants underwent imaging on a 3.0 T MRI scanner (Phillips Healthcare, Amsterdam, The Netherlands). Participants were positioned supine to image the calf at the mid-gastrocnemius muscle. The MRI exam consisted of T1-weighted imaging in the transverse plane. T1-weighted imaging parameters include: turbo-spin echo, TR (repetition time)=4000 ms, TE (time to echo)=30 ms, flip angle=90 degrees, matrix size=192×192, in-plane spatial resolution=1×1 mm2, 5 slices each 6 mm thick, number signal acquisitions=2, acquisition time=2.53 min. Manual image segmentation was performed on T1-weighted images in the gastrocnemius and soleus muscles from five consecutive cross-sectional images using a Matlab (R2018a, Mathwworks, Natick, Massachusetts, USA) program, as previously described.10 21 IMAT accumulation was quantified by calculating the ratio between IMAT to muscle areas and converting it to percentage. Subcutaneous adipose tissue (SAT), defined as adipose tissue between the skin and the deep fascia of the muscles, and whole-leg cross-sectional areas were also manually segmented. SAT accumulation was quantified by calculating the ratio between SAT to whole-leg cross-sectional area and expressed as a percentage.
24-Hour ambulatory blood pressure
In a subset of participants, ambulatory blood pressure was monitored for 24 hours using a Card(X)plore blood pressure monitor (Meditech, Budapest, Hungary) at 15 min intervals during the day and 30 min intervals between 22:00 and 06:00 hours as we have previously described.22 Exclusion criteria for the 24-hour monitoring were inability to operate the blood pressure device, use of anticoagulants or the presence of a condition that could be exacerbated by blood pressure cuff inflation (eg, lymphoedema). Participants with at least 50% of the readings available for both day (ie, ≥32 readings) and night (ie, ≥8 readings) were included. Sleeping and awake blood pressure measures were categorised according to each patient’s reported sleep period. Twenty-four-hour systolic blood pressure (SBP) was the average of all SBP measurements over the entire monitoring period. Sleep and awake SBP were the average SBP measurements during those times, respectively.
Inflammatory marker panel
Inflammatory markers were measured in plasma samples by Olink Bioscience (Uppsala, Sweden) using the inflammation panel, which is a multiplex immunoassay panel that measures 92 cytokines and other inflammation-related markers. Analytes were excluded from analysis if concentrations were below the limit of detection for >25% of the participants.
Lipoprotein profile
Nuclear magnetic resonance (NMR) was used to measure lipid profile and lipoprotein composition. For this purpose, plasma (110 µL) was transferred to a tube and mixed with 110 µL plasma buffer (Bruker, USA). After mixing well, the total 220 µL solution was transferred to an NMR tube (Wilmad-labGlass), which contained sodium trimethyl-silylpropane-sulfonate as an internal standard. Proton NMR (or 1H NMR) spectra were collected on a 600 MHz Bruker NMR spectrometer with a cryoprobe. Bruker In Vitro Diagnostics Research shimming protocol optimised for the water presaturation was applied before data collection; 96K data points were collected on the sweep width of 30 ppm, with a relaxation delay of 4 s. The lipoprotein profile was further deconvoluted and analysed by Bruker Lipoprotein Subclass Analysis, with normalisation to the internal standard.23
Gene ontology enrichment analysis
Gene ontology enrichment analysis was used to characterise the relationship between the inflammatory markers and IMAT. Gene ontology enrichment indicates the molecular pathways and biological processes that were over-represented in the inflammatory markers significantly associated with IMAT compared with the entire Olink Inflammation Panel. Analysis was performed using The Gene Ontology Consortium’s online tool (http://www.geneontology.org).
Statistical analysis
Participants’ characteristics were expressed as median and IQRs for continuous variables or number and percentage for categorical variables. Mann-Whitney U test for continuous variables and χ2 test for categorical variables were used for comparisons between groups. Spearman’s correlations were used to evaluate the association between continuous variables. Enhanced heatmaps with hierarchical clustering represented by dendrograms were constructed with IMAT accumulation and clinical and inflammatory marker data using Spearman’s rho correlation coefficients. The threshold for statistical significance was set at p values <0.05. Analyses were performed and figures were developed using SPSS V.27, R V.4.0.2 and GraphPad Prism V.9.0.0. Sensitivity analysis within patients with SLE was performed to evaluate differences in IMAT and SAT between current and non-current corticosteroid users.
Results
Demographics
Patients with SLE (n=23) and controls (n=28) were similar in terms of age, sex, race, BMI and renal function (table 1). Median SLE disease activity measured by SLEDAI score was 4 (IQR 2, 6) and ranged from 0 to 12. Among patients with SLE, none had a history of active myositis, 45% had a history of renal involvement and 14% had current proteinuria or active urine sediment. Creatinine levels and estimated glomerular filtration rate were similar in patients with SLE and controls. Fifty-seven per cent of SLE and 4% of control participants were taking corticosteroids at the time of the study. No patient with SLE and 11% of control participants were taking statins. There was no obvious muscle weakness or abnormal reflexes in any of the study participants. More patients with SLE had hypertension compared with control participants (35% vs 7%, p=0.02). One patient with SLE had a diagnosis of diabetes that was treated only with diet. Glucose, insulin and insulin resistance measured by HOMA-IR were not different between patients with SLE and controls (all p>0.05). Patients with SLE had lower total cholesterol, low-density lipoprotein cholesterol and high-density lipoprotein cholesterol concentrations compared with controls (all p<0.05).
Participant characteristics
Intermuscular and subcutaneous adipose tissue in patients with SLE and controls
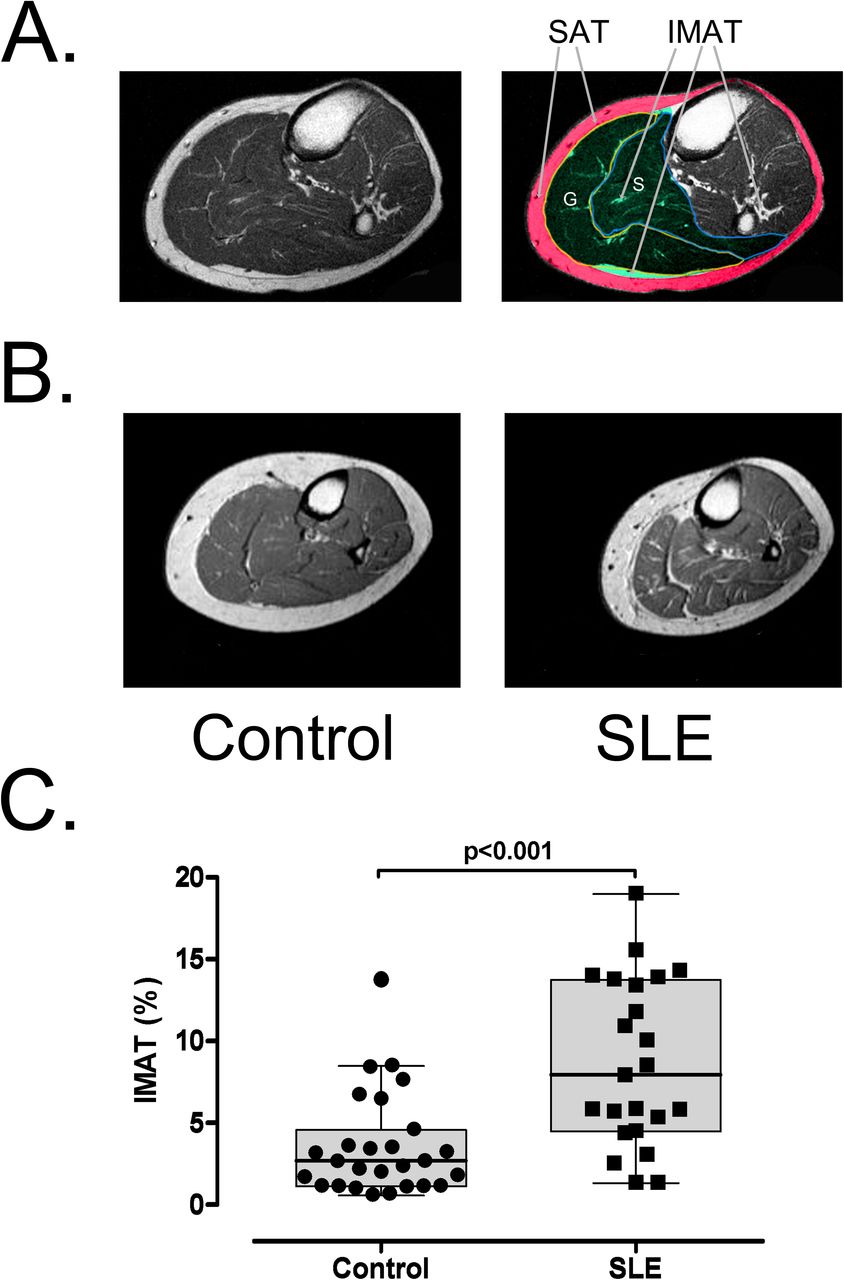
IMAT accumulation, expressed as the percentage of IMAT area to muscle area, was significantly higher in patients with SLE than in controls (7.92% (4.51%–13.39%) vs 2.65% (1.15%–4.61%), median, IQR, p<0.001, figure 1). There was no difference in the cross-sectional area of the muscles between the groups (p=0.6). These differences remained significant after adjustment for age, sex, race and BMI (p<0.001). The percentage of SAT normalised to the cross-sectional area of the leg was also higher in patients with SLE (32.95% (27.96%–41.60%)) vs controls (27.06% (22.97%–30.91%), p=0.02); however, it was not significant after adjustment by age, sex, race and BMI (p=0.1).

(A) Segmented MRI image of the calf showing the subcutaneous adipose tissue (SAT) in red and the studied muscle compartment in green. IMAT was evaluated in the soleus (S) and gastrocnemius (G) muscles. (B) Representative T1-weighted MRI of the leg showing increased intermuscular adipose tissue (IMAT) in a control individual and a patient with SLE. (C) IMAT accumulation (percentage of IMAT to muscle area) in the leg muscles was higher in patients with SLE (n=23) than in the control group (n=24).
IMAT and SLE disease activity, damage and corticosteroid use
Among patients with SLE, IMAT accumulation was associated with neither disease activity by the SLEDAI score (rho=−0.13, p=0.57) nor damage by the SLICC score (rho=0.15, p=0.52). Although corticosteroid use may influence the redistribution of fat, among patients with SLE, there was no difference in IMAT comparing current corticosteroid users (8.5% (5.3%–13.9%) and non-current corticosteroid users (6.9% (4.5%–10.9%), p=0.48). In addition, there was no difference in the percentage of SAT among patients with SLE between current corticosteroid users (32.3% (28.9%–41.9%) and non-current corticosteroid users (33.1% (26.1%–41.3%), p=0.98).
IMAT and self-reported fatigue and physical activity
Compared with controls, patients with SLE had significantly higher self-reported fatigue compared with controls (49 mm (28, 63 mm) vs 2 mm (0, 5 mm) on a 100 mm scale, p<0.001) and significantly lower comfortable walking distance compared with controls (1.1 miles (0.2, 2.0 miles) vs 5.0 miles (3.0, 5.3 miles), p<0.001) (table 1). Among all participants (SLE and controls), IMAT accumulation was positively correlated with self-reported fatigue (rho=0.52, p<0.001, figure 2A) and inversely correlated with comfortable walking distance (rho=−0.60, p<0.001, figure 2B). However, there was no significant association between self-reported outcomes and IMAT when evaluated separately within the SLE or control groups. Participants in the study were then divided according to their ability to walk more or less than the reported median distance. Overall, participants who could walk greater than the median comfortable walking distance had lower IMAT accumulation (figure 2C). Physical activity may affect IMAT accumulation, however, the difference in IMAT accumulation between controls and patients with SLE remained significant after adjusting for the reported walking distance (p=0.02).

Visual analogue scale (VAS) of fatigue (A) and patient-reported (PR) walking distance (B) was significantly associated with intermuscular adipose tissue (IMAT) in controls and patients with SLE (n=47). Study participants were stratified into higher or lower than median PR walking distance. Participants with a reported walking distance higher than the median had lower IMAT accumulation (C).
IMAT is associated with systolic blood pressure and renal function
IMAT accumulation was significantly associated with office SBP in patients with SLE (rho=0.49, p=0.02). In a subgroup of patients with SLE (n=15) who had 24-hour blood pressure monitoring, IMAT accumulation was significantly associated with 24-hour SBP (rho=0.56, p=0.03), however, the association was strongest with sleeping SBP (rho=0.69, p=0.005, table 2). There was no significant association between SBP and IMAT accumulation in controls (p=0.63). Among patients with SLE, IMAT accumulation was inversely associated with the estimated glomerular filtration rate (rho=−0.67, p=0.001) (table 2).
Association of IMAT with SBP, and clinical laboratory measurements in patients with SLE
Metabolic parameters and IMAT
In univariate analysis, IMAT accumulation was significantly associated with fasting glucose levels in controls (ρ=0.43, p=0.03) but not in patients with SLE. There was no significant association between IMAT accumulation and insulin levels or insulin resistance, as measured by the HOMA-IR, either in controls or in patients with SLE (table 2). There was also no significant correlation between IMAT accumulation and plasma lipid profile parameters.
Inflammatory markers and IMAT
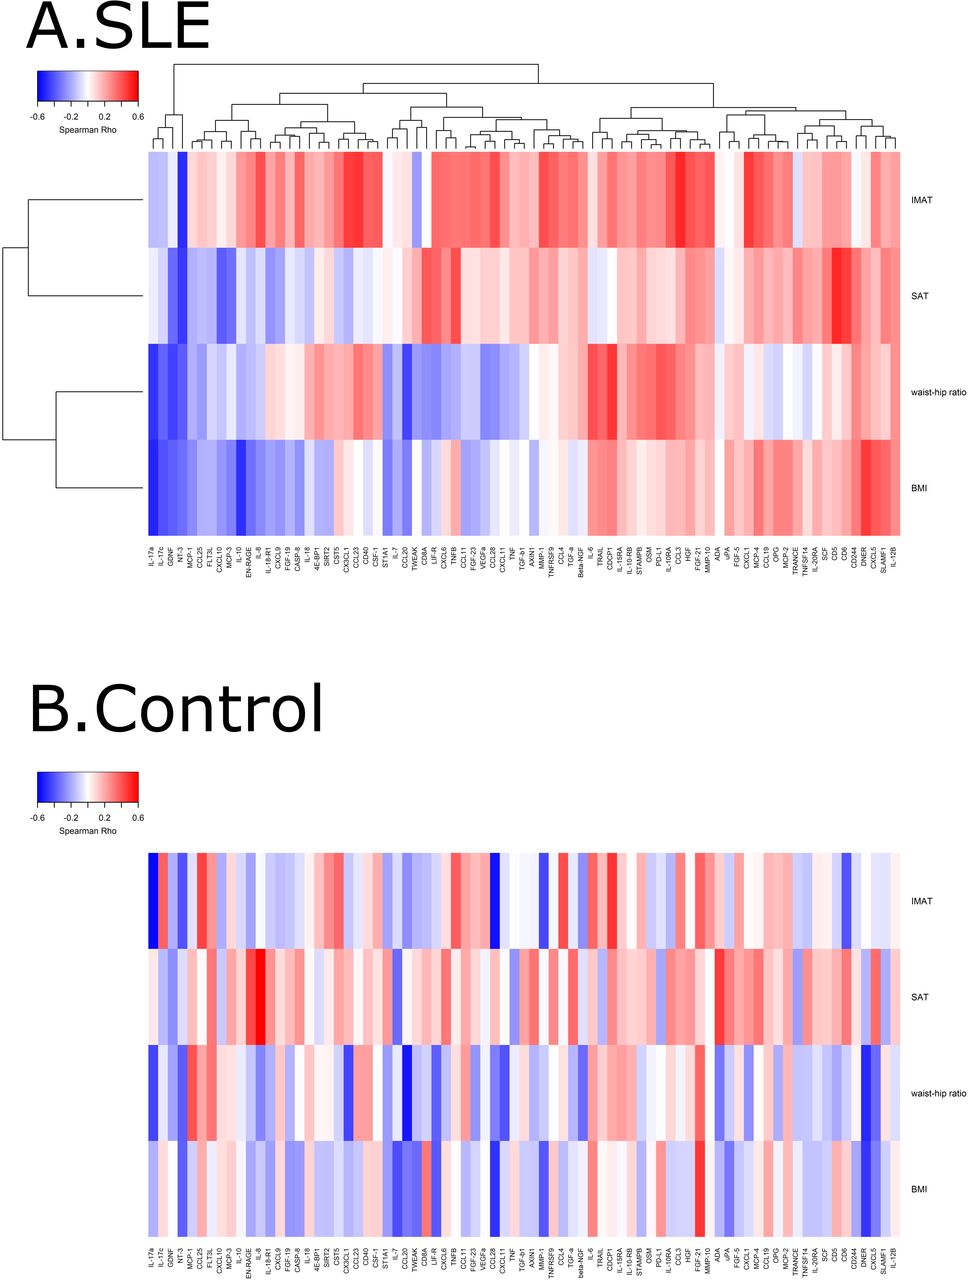
As an exploratory analysis, the association between IMAT accumulation and markers of inflammation in plasma was evaluated using the Olink proteomic panel. A total of 77 of the 92 markers of inflammation were above the limit of detection in >25% of the participants and were used for further analysis. The heatmap with hierarchical cluster analysis revealed that most of the inflammatory markers tended to correlate positively with IMAT accumulation in patients with SLE but not in controls (figure 3).

Heatmap with hierarchical clustering of intermuscular adipose tissue (IMAT) and plasma inflammatory markers among controls (A) and patients with SLE (B). The heatmaps were generated using Spearman’s correlation, where red indicates positive association values and blue indicates negative association. Not all of these associations were statistically significant. BMI, body mass index; SAT, subcutaneous adipose tissue.
The markers which were significantly positively associated with IMAT among patients with SLE were C-C motif chemokine ligand 3, C-C motif chemokine ligand 23, C-X-C motif chemokine ligand 1 and C-X3-C motif chemokine ligand 1 (all rho >0.45, all p<0.05); neurotrophin-3 (NT3) was significantly negatively associated with IMAT accumulation (rho=−0.49, p=0.02) among patients with SLE.
The markers which were significantly positively associated with IMAT accumulation among control participants were CUB domain-containing protein 1, C-C motif chemokine ligand 25, C-C motif chemokine ligand 4/macrophage inflammatory protein-1β (all rho >0.42, all p<0.05); markers negatively associated with IMAT accumulation among control participants were interleukin-17A, CCL28, matrix metallopeptidase 1, NT3 and CD6 (all rho <−0.4, all p<0.05).
After identifying the cytokines associated with IMAT accumulation in patients with SLE and controls, we use gene ontology enrichment analysis to identify their associated molecular pathways and biological processes. The top 15 gene ontology terms based on molecular function and sorted by fold enrichment in patients with SLE are shown in figure 4. The top-ranked pathways associated with IMAT accumulation in SLE were related to macrophage activation and migration. The full list of gene ontology terms associated with IMAT accumulation in patients with SLE and control participants is shown in online supplemental figure 1.
Supplemental material

Gene Ontology (GO) enrichment analysis showing the top 15 ranked pathways associated with intermuscular adipose tissue accumulation in patients with SLE.
Discussion
The results of the study showed that IMAT accumulation is increased in patients with SLE in calf muscles compared with controls. In patients with SLE, IMAT accumulation was associated with higher blood pressure and increased markers of inflammation and macrophage infiltration. In a hypothesis-generating aim, we found that IMAT accumulation is associated with higher self-reported fatigue and lower self-reported walking distance. Previous studies have described the relationship between IMAT accumulation and metabolic syndrome; however, in patients with SLE, IMAT accumulation was not associated with insulin resistance or lipid profile.
Fat accumulation in the muscle is associated with reduced physical performance and activity in other study populations.24–27 The exact mechanism is still unknown, but it has been attributed to IMAT-induced changes in skeletal muscle fibre type.7 Little is known about the fibre type proportions in patients with SLE but fibre type II atrophy has been described.28 Type II fibres are responsible for fast contraction and type II fibre atrophy is associated with reduced strength and physical performance; however, whether IMAT contributes to changes in fibre type in patients with SLE is unknown. In contrsast to our findings, a previous study did not find any difference in the fat accumulation in the soleus muscle in patients with SLE.29 The explanation may be that we measured fat accumulation in a larger muscle compartment that accounts for fat between fascicles and between muscles. (eg, between soleus and gastrocnemius).
IMAT may also affect physical function by secreting adipokines and inflammatory cytokines. The latter is due to the inflammatory cells, such as lymphocytes and monocytes, that infiltrate IMAT.13 Increased inflammation is associated with poorer physical performance and muscle strength in older individuals.30 Thus, the pro-inflammatory microenvironment induced by IMAT may also explain the increased fatigue,31 which commonly occurs in patients with SLE.
In patients with cancer and myalgic encephalomyelitis, fatigue is highly associated with increased levels of plasma pro-inflammatory cytokines.32 33 In patients with SLE, however, the association between cytokines and fatigue has not been determined.34 Circulatory, as well as locally produced pro-inflammatory cytokines, may impact muscle function and cause muscle wasting. Thus, increased IMAT may act as a pro-inflammatory milieu that would affect fatigue in a paracrine manner. Further studies should evaluate if changes in IMAT affect fatigue and inflammation in patients with SLE.
The Gene Ontology enrichment analysis showed that cytokines associated with IMAT were related to macrophage activation and migration in patients with SLE. Macrophages have been previously found in IMAT biopsies obtained from patients with obesity, and they polarise into pro-inflammatory phenotypes.13 35 The presence or absence of macrophages in IMAT and their polarity in patients with SLE is not known; however, in this study plasma markers of macrophage activation and infiltration were associated with IMAT accumulation. Increased migration and activation of macrophages in IMAT in patients with SLE may be associated with increased fatigue and muscle pain in this population.
IMAT has been associated with insulin resistance in several studies.8 9 36 The rationale is that IMAT may affect local glucose utilisation since skeletal muscle is responsible for approximately 80% of glucose disposal. IMAT may affect insulin sensitivity through the source of free fatty acid or a pro-inflammatory milieu.37 Interestingly, there was no association between insulin resistance and IMAT in patients with SLE. This may be due to the small sample size and less insulin resistance than expected in this cohort.
IMAT has also been associated with cardiovascular disease and hypertension.38 39 There was a strong correlation between IMAT and hypertension in controls and patients with SLE. Increased inflammation and oxidative stress induced by IMAT in the muscle compartment may be the mechanism to explain the association between IMAT and hypertension. It is also possible that IMAT is associated with increased muscle sodium content. In a previous study, we have shown increased sodium content in skeletal muscles in patients with SLE, which is also associated with hypertension.40 The relationship between IMAT and sodium content in skeletal muscle deserves further investigation.
This study has some limitations. The cross-sectional study design only allows us to evaluate associations but no causation. We only collected patient-reported outcomes for fatigue and physical activity using the VAS questionnaire, and more objective measures would provide a more precise estimate. However, the VAS questionnaire has been validated in different populations and extensively used in patients with SLE.41 Thus, these data should be used for hypothesis generation; confirmatory studies using measurements such as accelerometry will be useful. Additionally, the sample size was relatively small and the majority of patients with SLE had low disease activity.
In conclusion, this study showed that IMAT accumulation is increased in patients with SLE, and it is associated with reduced physical activity, fatigue, inflammation and hypertension. Further studies should evaluate whether interventions that reduce IMAT may also impact symptomatology, such as fatigue, in patients with SLE.
Data availability statement
Data are available on reasonable request. All data relevant to the study are included in the article or uploaded as supplementary information.
Ethics statements
Patient consent for publication
Ethics approval
This study was approved by Vanderbilt Institutional Review Board (IRB# 110365). All participants provided written informed consent.
Acknowledgments
We would like to thank all the study coordinators and participants for their dedication to the study.
References
Footnotes
Twitter @JLGamboa_Velez
Contributors MO and CMS designed the study. CMS, MO and CPC oversaw patient recruitment. DC-L and AO contributed to patient recruitment. JLG, RC, MP, DP and AO contributed to data collection and performed data analysis. JLG and MO wrote the first draft of the manuscript. All authors contributed to the writing of the manuscript. All authors approved the final version of the manuscript. JLG (guarantor) assumes overall responsibility for the content and finished work.
Funding This study is supported in part by grants from the Lupus Research Alliance, the National Institutes of Health (NIH) R01HL140145 (NHLBI), Veterans Health Administration Office of Research and Development CDA (IK2CX001269) and Merit Award (I01CX002356); grants for NMR instrumentation from the NSF (0922862), NIH (S10 RR025677) and Vanderbilt University matching funds; and NIH grants DK059637 and DK020593 that support the Hormone Assay and Analytical Services Core. The study was supported by CTSA award (UL1 TR002243) from the National Center for Advancing Translational Sciences.
Competing interests None declared.
Patient and public involvement Patients and/or the public were not involved in the design, or conduct, or reporting, or dissemination plans of this research.
Provenance and peer review Not commissioned; externally peer reviewed.
Supplemental material This content has been supplied by the author(s). It has not been vetted by BMJ Publishing Group Limited (BMJ) and may not have been peer-reviewed. Any opinions or recommendations discussed are solely those of the author(s) and are not endorsed by BMJ. BMJ disclaims all liability and responsibility arising from any reliance placed on the content. Where the content includes any translated material, BMJ does not warrant the accuracy and reliability of the translations (including but not limited to local regulations, clinical guidelines, terminology, drug names and drug dosages), and is not responsible for any error and/or omissions arising from translation and adaptation or otherwise.