Article Text

Abstract
Objective SLE is an autoimmune disease characterised by persistent inflammation and autoantibody production. Genetic predisposition and environmental factors such as a high-fat diet (HFD) may contribute to lupus development. However, the immune cell profile and gender difference in response to HFD in lupus have not been reported. Here we investigated the impact of HFD on lupus pathogenesis and autoimmunity using lupus-prone mice.
Methods Thirty male and 30 female MRL/lymphoproliferation (lpr) mice were fed with regular diet (RD) or HFD. Body weights were recorded weekly. SLE progression was monitored by skin lesion, urine protein, titres of antidouble-strand DNA (dsDNA) and ANA. At week 14, kidney and skin tissue sections were stained with H&E and periodic acid–Schiff to detect histological kidney index and skin score. Splenocytes were identified by immunofluorescence staining and flow cytometry.
Results HFD significantly increased body weight and lipid levels compared with RD (p<0.01). Skin lesions were observed in 55.6% of the HFD group compared with 11.1% of the RD group, with greater histopathological skin scores in the female HFD group (p<0.01). Although both male and female mice had higher serum IgG in the HFD group than in the RD group, only the male HFD group showed an increased trend in anti-dsDNA Ab and ANA titres. Kidney pathological changes in the HFD group were more severe in male mice than in female mice (p<0.05), detected by proteinuria, kidney index and glomerular cell proliferation. Significant increases of germinal centre B cells and T follicular helper cells were observed in the spleens of HFD mice (p<0.05).
Conclusion HFD induced an accelerated and exacerbated lupus development and autoimmunity in MRL/lpr mice. Our results parallel many known clinical lupus phenotypes and sexual dimorphism in which male patients are likelier to have a severe disease (nephritis) than female lupus patients who may have a broader range of lupus symptoms.
- Lupus Erythematosus, Systemic
- Autoimmunity
- T-Lymphocytes, Helper-Inducer
- B-Lymphocytes
Data availability statement
Data are available upon reasonable request. Data may be obtained from a third party and are not publicly available. All data relevant to the study are included in the article or uploaded as supplementary information.
This is an open access article distributed in accordance with the Creative Commons Attribution Non Commercial (CC BY-NC 4.0) license, which permits others to distribute, remix, adapt, build upon this work non-commercially, and license their derivative works on different terms, provided the original work is properly cited, appropriate credit is given, any changes made indicated, and the use is non-commercial. See: http://creativecommons.org/licenses/by-nc/4.0/.
Statistics from Altmetric.com
WHAT IS ALREADY KNOWN ON THIS TOPIC
SLE pathogenesis derives from genetic, environmental, hormonal and epigenetic factors. Environmental factors, particularly dietary habits, profoundly impact intestinal immunological haemostasis. Epidemiological evidence supports the concept that a high-fat diet (HFD) underpins the rise in chronic inflammatory diseases such as lupus. However, a complete understanding of the role of HFD in SLE pathogenesis and autoimmunity remains unclear.
WHAT THIS STUDY ADDS
This study showed that HFD accelerated and exacerbated lupus development and autoimmunity in lupus prone mice. SLE progression is sexually dimorphic in response to HFD. Skin rash showed up as early as week 6 in the female HFD group with a greater histopathological skin score. Splenomegaly, proteinuria and antidouble-strand DNA level were increased only in the male HFD group. Kidney pathological changes were more severe in male HFD mice with a significant increase in kidney index. Furthermore, the frequencies of T follicular helper (Tfh) cells, GC-B cells and plasma cells in spleen are significantly increased in the HFD group compared with the regular diet group.
HOW MIGHT THIS STUDY AFFECT RESEARCH, PRACTICE OR POLICY
Further studies on gut microbiota changes are needed since the exacerbated lupus development and autoimmunity induced by HFD may be caused by the shifting of gut microbiota components. Our results parallel many known clinical lupus phenotypes and sexual dimorphism in which male patients are more likely to have severe disease (such as nephritis) than female patients with lupus who may have a broader range of lupus symptoms. Interventions of healthy diet or interference of Tfh–GC-B cell interaction may improve both lupus symptoms and outcomes in genetically predisposed individuals with SLE.
Introduction
SLE is a chronic debilitating autoimmune disease characterised by inflammation and production of autoantibodies directly against cell components, forming immune complex deposits in multiple organs and resulting in cutaneous lesions, and potentially life-threatening renal and central nervous system disease.1 SLE pathogenesis derives from genetic, environmental, hormonal and epigenetic factors. Environmental factors, particularly dietary habits, profoundly impact intestinal immunological haemostasis. Epidemiological evidence supports the concept that a high-fat diet (HFD) underpins the rise in chronic inflammatory diseases such as diabetes, lupus, gout and inflammatory bowel disease.2 Multiple studies have suggested a link between obesity, metabolic syndrome and autoimmune diseases, including SLE.3 4 The incidence of obesity was 33% in SLE with an average body mass index (BMI) of 34.4 compared with 18% in the general population with an average BMI of 26.1.5 Increased BMI was also correlated with earlier development and longer disease duration in lupus.6
Regarding obesity and autoimmunity, previous reports largely focused on the role of inflammatory responses during obesity. Young patients with early-onset SLE often present with obesity or obesity-related metabolic syndrome with high levels of inflammatory cytokines,7 such as tumour necrosis factor, interleukin (IL)-6, IL-1β, adipokines and adiponectin produced by white adipose tissue.8 Not only do these proinflammatory cytokines exacerbate a pathological state, but also fatty acids released from adipose tissue may initiate inflammatory signalling cascades in infiltrating cells. In addition, macrophages and dendritic cells may also play a role by recognising fatty acids through scavenger and toll-like receptors, resulting in the secretion of more inflammatory cytokines and chemokines and potentially aggravating vascular inflammation and autoimmunity status.9 Although obesity and lipid homeostasis have been associated with lupus, little is known about the exact pathogenesis and the pathophysiology of autoimmunity induced by an HFD or obesity.
Subgroups of T lymphocytes, such as T follicular helper (Tfh) cells, have recently emerged as a critical link in autoantibody production, inflammation and hyperlipidaemia-associated autoimmune disease, such as SLE.10 11 Tfh cells comprise a T-cell subset originally located in the secondary follicle and promote germinal centre B (GC-B) cells to differentiate into antibody-producing plasma cells.12 Data from murine lupus models and our previous studies show that circulating Tfh cells are significantly increased in patients with lupus and correlated with their disease activity and serum autoantibody level.13 14 It has also been suggested that Tfh cells play a role in developing atherosclerosis, as shown by the beneficial depletion of Tfh cells in atherogenic mice.15 On the other hand, regulatory T cells (Tregs) are another key player in the pathogenesis of obesity and autoimmunity. Circulating Treg was reduced in obesity, facilitating obesity and insulin resistance via a blimp-1/IL-10 axis.16 The previous report showed that imbalanced lipid metabolism affected T-cell homeostasis and autoimmunity in humans and mice.17 18 However, it is controversial if the obesity status or the lipid species positively regulates Tfh cell or Treg differentiation.
Given the increased risk of obesity and metabolic imbalance in patients with SLE and the fact that T cells are implicated in SLE development, we hypothesise that T cells might be the link between obesity and SLE. Our study aimed to evaluate the impact of HFD on lupus development and to investigate further the role of T-cell subsets in relation to HFD in MRL/lymphoproliferation (lpr) mice.
Methods
Animals
MRL/lpr mice were purchased from Jackson Laboratory (Bar Harbour, Maine, USA) and housed under specific pathogen-free conditions in an AAALAC—accredited animal facility at Ochsner Clinic Foundation. All mice (30 male and 30 female) were randomly divided into a regular diet (RD) (10% calories composed of fat) or an HFD group (60% calories composed of fat) with an equal number of female and male mice and fed for 14 weeks. Body weights and skin lesions were recorded weekly. Urine was collected weekly. Tail blood was collected monthly. Blood, skin, urine, kidneys and spleen were harvested for further analysis when mice were euthanised at week 14. All animal studies were conducted under approved guidelines of the Institutional Animal Care and Use Committee (IACUC) and in accordance with animal research guidelines.
Assessment of dermatitis
The dorsal hair of MRL/lpr mice was removed by Nair hair remover (Church & Dwight) to expose the skin lesion. Incidence of inflammatory skin lesions on the forehead, ears and dorsum of the neck was recorded and scored on a scale of 0–3 (0, no visible skin changes; 1, minimal hair loss with redness and a few scattered lesions; 2, redness, scabbing and hair loss with a small area of involvement; and 3, ulcerations with an extensive area of involvement).19 In addition, all sections from paraffin-embedded skin tissue were stained with H&E and quantified as histological skin scores for severity of skin inflammation on a scale of 0–4 (0, normal; 1, hyperplasia of the epidermis; and 2–4, increasing numbers of infiltrating inflammatory cells in the skin).
Assessment of proteinuria
Urine samples were collected every week and stored at –80°C. Urine albumin was measured using the Bradford assay (Bio-Rad Laboratories, Hercules, California, USA).20
Assessment of serology by ELISA
ANA, antidouble-strand DNA (dsDNA), and IgG in the plasma were detected using ELISA kits according to the manufacturer’s instructions (MyBioSource, San Diego, California, USA). In addition, serum levels of mouse IL-6 and monocyte chemoattractant protein-1 (MCP-1) were examined using ELISA kits according to the manufacturer’s instruction (Thermo Fisher Scientific Inc, Waltham, Massachusetts, USA).
Assessment of nephritis
Histopathological examination of kidney sections included H&E, periodic acid–Schiff (PAS) and Masson’s trichrome staining and were scored for the active and chronic kidney histological lesions (glomerular proliferation, leucocyte exudation, karyorrhexis and fibrinoid necrosis, cellular crescents, hyaline deposits for active index; interstitial inflammation, glomerulosclerosis, fibrous crescents, tubular atrophy, interstitial fibrosis for chronic index).21 Every slide was scored from 0 to 3 according to the involved area (0: normal, 1: less than 25% of glomeruli involved, 2: 25% to 50% involvement, 3: greater than 50% involvement). The examples of standard scores are presented in online supplemental figure S1.
Supplemental material

Percentage of body weight increased in the RD group and the HFD group. MRL/lpr mice were grouped and fed with RD (n=30, 15 male and 15 female) and HFD (n=30, 15 male and 15 female) for 14 weeks. Body weight gain over time in each mouse is presented as percentage of gain from baseline. Percentage of body weight increased in the whole study population (A) in female mice (B) and in male mice (C). Serum level of TC and TG were examined and compared between the RD and HFD groups (D). Values are presented as mean±SD. Significant differences between the RD and HFD groups were analysed by Student t-test. *P<0.05, **P<0.01, ***P<0.001. HFD, high-fat diet; lpr, lymphoproliferation; RD, regular diet; TC, total cholesterol; TG, total triglyceride.
Histological and immunofluorescent analysis of cell profile in murine spleen
For histological evaluation, mouse spleen sections were used for H&E and immunofluorescence staining. For immunofluorescence staining, we used OPAL 4-colour multiplex staining kit according to the manufacturer’s instructions (Akoya Biosciences, Menlo Park, California, USA). Briefly, tissue sections were deparaffinised, rehydrated, and blocked for endogenous peroxidase activity. After high-temperature antigen retrieval in 0.01 M sodium citrate solution (pH 6.0), sections were blocked and stained with primary antibody (Ab) (indicated in the figure legends) 1 hour at room temperature. After washing, polymer HRP Ms+Rb were applied to the slides and incubate for 10 min followed by Opal 520 fluorophore solution. After washing, the antigen retrieval and blocking process were redone. After incubating with Ab against the second marker (indicated in figure legends) and washing, the slides were incubated with polymer HRP Ms+Rb solution for 10 min following with Opal 570 fluorophore solution. Then the slides were counterstained with ProLong antifade mountant DAPI (Thermo Fisher Scientific Inc.). All images of the stained slides were captured with a deconvoluting microscope using the SlideBook software (Intelligent Imaging Innovations, Denver, Colorado, USA).
Flow cytometry assay and analysis
Fluorescence-activated cell sorting (FACS) analysis was used to analyse murine spleens’ immune cell profiles. Briefly, murine spleen cells were isolated and stained with fluorescent conjugated monoclonal antibodies (indicated in figure legends) for 20 min at 4°C, washed and fixed with 1% paraformaldehyde. Appropriate isotype controls were used. All antibodies were purchased from BD Biosciences unless indicated. FACSCalibur read cells and analysed data using FlowJo V.10.7.2 software (BD Biosciences, Ashland, Oregon, USA).
Statistics
Statistical analysis and graphic presentation were carried out with GraphPad Prism V.8.0 (GraphPad Software, San Diego, California, USA). Results are presented as mean±SD. If appropriate, statistical significance was determined by the Student t-test or two-way analysis of variance. A p value of <0.05 was considered statistically significant.
Results
Obesity was achieved with significant increase in body weight in HFD mice
MRL/lpr mice with an MRL background develop an autoimmune disease resembling SLE due to an lpr spontaneous mutation (Faslpr) that promotes survival of self-reactive lymphocytes, thus predisposing the mouse to develop the autoimmune disease SLE. It is known that both sexes develop lupus, although it is accelerated and more severe in female mice. As shown in figure 1A, HFD mice developed significant bodyweight gain compared with RD mice starting at week 5 and continuing until week 14. Of note, the weight gain was not due to differences in food consumption between the cohorts since the quantification of food intake was similar (data not shown). In addition, the bodyweight increase associated with HFD was more substantial in female mice (figure 1B) than in male mice (figure 1C). During the 14 weeks of feeding, RD resulted in a similar bodyweight gain in female mice (191.88%) and male mice (192.98%), whereas HFD induced a 241.74% weight gain in female mice and a 193.33% weight gain in male mice. The increase in body weight between RD and HFD mice was only significant in male mice at weeks 8–10 (p<0.05). Notably, body weight in female mice with HFD increased faster and more significantly than in male mice with HFD, indicating that female mice gain more weight than male mice on HFD. Our results suggest that obesity occurred in both male and female HFD mice. However, sex-related differences were observed regarding the percentage of bodyweight increase and the weight gain speed.
In addition, the total cholesterol (TC) and triglyceride (TG) levels in the serum of the HFD and RD groups were examined. As shown in figure 1D, the serum levels of TC (p<0.001) and TG (p<0.01) were significantly elevated in the HFD group mice compared with the RD group mice. Thus, body weights and serum TC and TG increased in HFD.
HFD mice demonstrated exacerbation of lupus characteristics
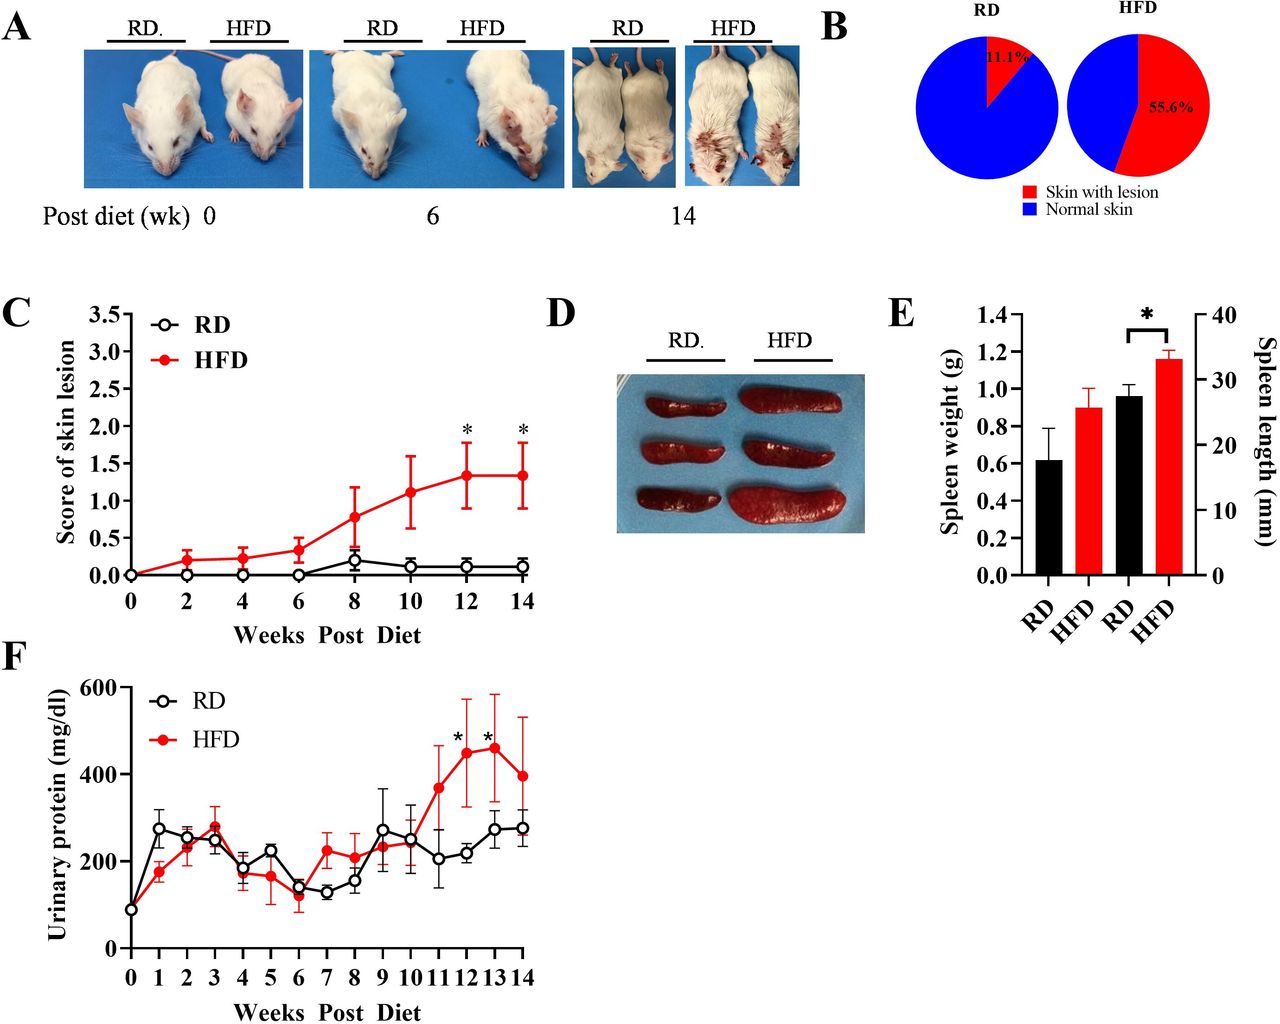
To determine whether obesity affects SLE development, we examined features of lupus in HFD and RD mice. We found that mice on HFD developed more severe lupus signs than those on RD, with an increased frequency of skin lesions, splenomegaly and proteinuria. As shown in figure 2A, HFD mice presented red and scaly rashes on the face, ears and dorsum of the neck and back as early as week 6, which became severe at week 14, whereas the skin lesions in RD mice occurred later and with reduced severity. Skin lesions occurred in 55.6% of the HFD group vs 11.1% of the RD group at week 14 (figure 2B). In addition, as shown in figure 2C, the score for the severity of skin lesions in HFD mice was significantly higher than that in RD mice, reaching statistical significance at weeks 12–14 (p<0.05), particularly in male mice (online supplemental figure S2A). This result indicates accelerated onset and increased severity of skin lesions in HFD mice.
Supplemental material

Skin lesions, splenomegaly and proteinuria were exacerbated in HFD mice. (A) Representative spontaneous skin lesions on the forehead, ears and dorsum of the neck in RD and HFD mice. (B) Frequencies of skin lesion appearance in RD and HFD groups. (C) Severity of inflammatory skin lesions in RD and HFD groups was recorded and scored as described in the Methods section (n=10 in each group). (D) Representative spleens in RD and HFD mice. (E) Weight and length of spleens in RD and HFD mice at week 14 (n=20 in each group). (F) Biweekly changes of urinary protein levels in RD and HFD mice (n=20 in each group). Results are shown as mean±SD, *P<0.05 by Student t-test. HFD, high-fat diet; lpr, lymphoproliferation; RD, regular diet.
Since splenomegaly can indicate lupus severity, we measured splenic size and weight. As shown in figure 2D,E, HFD mice showed marked splenomegaly compared with RD mice. Of note, splenomegaly is more substantial in male mice compared with female mice (online supplemental figure S2B).
Next, we assessed proteinuria as an indicator of glomerulonephritis in lupus. As shown in figure 2F, urine protein level was significantly increased (2.83-fold) by week 11 and continued to increase after that in HFD male mice. However, there was no difference in urinary protein levels in female mice comparing the HFD and RD groups (online supplemental figure S2C).
HFD mice showed exacerbated histological characteristics of SLE
Histological evaluation was performed using skin and kidney tissue sections to validate lupus development further. First, we sampled dermatitis using H&E staining and determined the skin lesion severity using a microscopical score for cellular infiltration, epidermal hyperplasia and epidermal ulcerations (figure 3A). HFD mice had significantly higher histology scores compared with RD mice, as characterised by thickened basement membranes, increased density and depth of cellular infiltration, especially in female mice (p<0.05 and p<0.01) (figure 3B and online supplemental figure S3A). Notably, male mice in the RD group had significantly higher histological scores when compared with female mice in the RD group.
Supplemental material

HFD ameliorates lupus dermatitis and nephritis. Representative skin sections stained with H&E and kidney sections stained with H&E, PAS and Masson’s trichrome. (A) At week 14, semiquantitative histology scoring results according to H&E, PAS and Masson’s trichrome staining showed increased skin (A) and glomerular changes by active and chronic index (B), and glomerular cell proliferation (C) in RD and HFD mice (n=20 in each group). Online supplemental figure 1 shows the standard of histological score for kidney. Results are shown as mean±SD. *P<0.05 by Student t-test. HFD, high-fat diet; lpr, lymphoproliferation; PAS, periodic acid–Schiff; RD, regular diet.
To determine the severity of lupus nephritis, kidney sections were stained with H&E and PAS for the active kidney lesions (such as glomerular proliferation, leucocyte exudation, karyorrhexis and fibrinoid necrosis, cellular crescents and hyaline deposits) and Masson’s trichrome staining for the chronic changes in the kidney (such as glomerular fibrosis, glomerulosclerosis, fibrous crescents and tubular atrophy) (figure 3A). As shown in figure 3C, both active and chronic indices of the kidney tended to be higher in HFD mice compared with the RD mice. However, the two groups did not differ in glomerular cellular proliferation (figure 3D). Notably, the pathological kidney changes induced by HFD were more severe in male mice than in female mice (online supplemental figures S3B–D). Our data demonstrate that HFD leads to severe general and histological characteristics of lupus in MRL/lpr mice.
HFD mice had a higher IgG level and increased anti-dsDNA antibody titre in their plasma
ANA is a diagnostic and anti-dsDNA activity marker in SLE. Our results showed that HFD increased anti-dsDNA autoantibody compared with the RD group (figure 4A) but not in ANA levels (figure 4B). Anti-dsDNA autoantibody is known to be more pathogenic than ANA in SLE due to its ability to activate the complement pathway and immunoglobulin receptors of the FcγR family. Furthermore, elevated ANA is an essential diagnostic antibody in patients with lupus, whereas an elevated anti-dsDNA autoantibody is typically associated with lupus activity. Thus, the elevated anti-dsDNA autoantibody in the HFD group is more meaningful in lupus activity/severity than the diagnostic ANA. Of note, the autoantibody levels were more substantial in male mice than in female mice (online supplemental figure S4A,B). In addition, HFD mice had an increased concentration of IgG in their plasma compared with RD mice at weeks 6, 10 and 14 (figure 4C and online supplemental figure S4C).
Supplemental material

Effect of HFD on levels of anti-dsDNA, ANAs and total IgG in plasma of MRL/lpr mice. Levels of anti-dsDNA antibody (A) and ANA (B) and IgG (C) in plasma of RD and HFD mice were evaluated by ELISA (n=20, for each group). Results are shown as mean±SD. dsDNA, double-strand DNA; HFD, high-fat diet; lpr, lymphoproliferation; RD, regular diet
Composition of germinal center B cells, plasma cells, Tfh cells and Treg cells in the spleens of RD and HFD mice
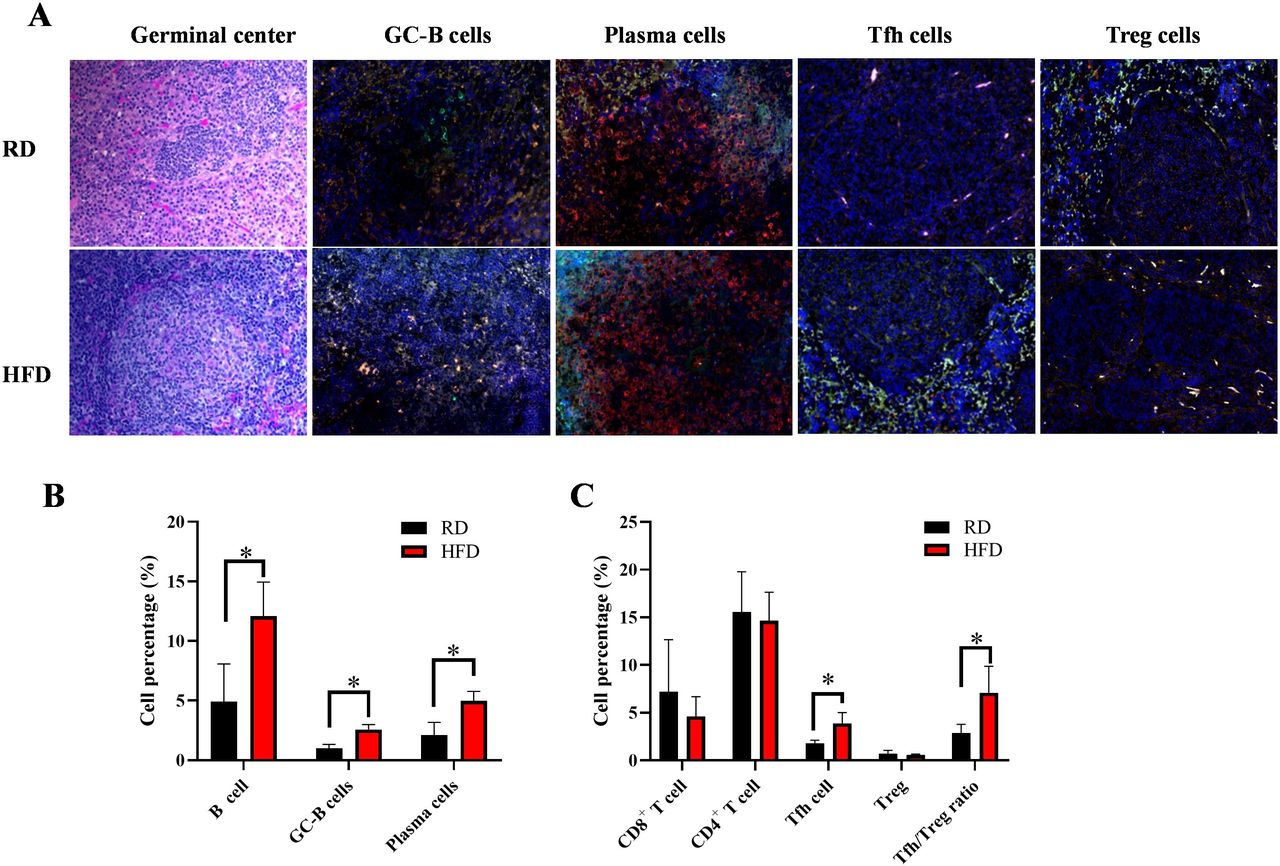
Since HFD led to lupus accompanied by splenomegaly, which may alter splenic immune cell populations, we evaluated splenic GC-B cells, plasma cells, Tfh cells and Tregs, which play essential roles for autoantibody production and autoimmunity in lupus. We observed a greater abundance of GC-B cells (GL-7+B220+), plasma cells (PNA+mIg+), Tfh cells (ICOS+CXCR5+) and Treg cells (CD4+Foxp3+) in the spleens of HFD mice than in RD mice (figure 5A). To quantify the number of these cells, we examined the cell profiles using flow cytometry and confirmed the higher frequencies of GC-B cells, plasma cells and Tfh cells in the HFD group versus the RD group (p<0.05) (figure 5B,C). There was no significant difference in frequencies of total CD8+ T cells, CD4+ T cells and Treg cells. However, there was a significant ratio of Tfh/Treg in the HFD group due to the increased frequency of Tfh cells in HFD mice. Collectively, these results demonstrate that HFD led to enhanced Tfh cells and germinal centre (GC) reactions in lupus-prone mice.

Frequencies of GC-B cells, plasma cells, Tfh cells and ratio of Tfh:Treg cells increased in the spleens of RD and HFD mice. (A). Representative H&E staining of germinal centre and opal four-colour immunofluorescence stainings for GC-B cells (GL7 green, B220 red), plasma cells (PNA green, mouse Ig red), Tfh cells (ICOS green, CD4 red) and Treg cells (FOXP3 green, CD4 red). DAPI counterstains were applied to all immunofluorescent staining slides. Magnification=×200. (B) Percentage of B cells (B220+), GC-B cells (GL7+B220+), plasma cells (PNA+B220-) in the spleens of RD and HFD mice were evaluated by FACS analysis (n=10 each group). (C) Frequencies of CD8+CD3+T cells, CD4+CD3+ T cells, Tfh cells (CD4+CXCR5+ICOS+), Treg (FoxP3+CD4+) and ratio of Tfh:Treg were determined by FACS analysis (n=10 each group). Significant differences between RD and HFD groups were analysed by Student t-test. *P<0.05. FACS, fluorescence-activated cell sorting; GC-B, germinal centre B; Tfh, T follicular helper; Treg, regulatory T cell.
Discussion
SLE demonstrates a range of pathogenic and clinical manifestations, including skin lesions, proteinuria, nephritis, autoantibodies and vasculitis. Studies have shown that 32%–50% of patients with SLE meet the criteria for obesity.5 Here, we demonstrate that HFD exacerbates lupus pathogenesis and the development of autoimmunity in MRL/lpr mice, characterised by significantly increased dermatitis, splenomegaly, glomerulonephritis, proteinuria and a higher level of anti-dsDNA autoantibody. Furthermore, GC-intrinsic and T cell-intrinsic signals are essential for the development of lupus, and we found a significantly increased frequency of GC-B cells, plasma cells and Tfh cells in the spleens of HFD mice. These findings have identified a previously unknown mechanism by which HFD may promote Tfh cell response and GC reactions, leading to lupus autoimmunity and pathogenesis.
Choosing a suitable animal model for the lupus study is challenging because of this disease’s complex and incompletely understood pathophysiology. We conducted our study using the MRL/lpr mouse, which exhibits the general clinical and histological phenotype of SLE, such as female sex predilection, signs of lpr (splenomegaly), cutaneous or vascular dysfunctional lesions, anti-dsDNA autoantibody production and glomerulonephritis, over a rapid time frame, which allows earlier assessment of interventions. Furthermore, the pathogenesis of autoimmunity in MRL/lpr mice includes pathogenic mechanisms leading to SLE in humans, such as polyclonal B-cell activation and T cell-dependent autoantibody production, upregulation of type 2 IFN pathways and the proliferation of T cells due to the lpr mutation-related defect in Fas-mediated apoptosis of autoreactive T cells and B cells.22 We recognise that no single lupus-prone mouse model is perfect for human SLE. One potential limitation of the MRL/lpr mouse model is the less dominant role played by type I interferons.23 Thus, further studies in other lupus mouse models, especially in obese patients, must unravel the complex relationship between HFD, obesity and autoimmunity in SLE. Of note, unlike obesity defined by BMI in humans, murine obesity may be defined by bodyweight increase and lipid accumulation or hyperlipidaemia. In our study, obesity was achieved by the significant bodyweight gain in the HFD group compared with the RD group from week 5 throughout the experimental period and increased serum levels of TC and TG. When separated by sex, female mice fed with HFD had a more significant percentage of bodyweight increase than male mice. Male mice on both RD and HFD achieved a 191.98%–192.98% bodyweight increase during weeks 0–8, whereas female mice on RD only increased weight by 193.3% compared with 241.74% with female mice on HFD in the same period. Several reports have shown a correlation between TC and TG serum levels with lupus disease activity. A single-cell cross-sectional study showed that patients with systemic lupus have abnormally elevated serum triglyceride levels. In addition, elevations in triglyceride and serum cholesterol levels correlate with the elevated 24-hour urine protein:creatinine ratio and serum creatinine.24 Another study also showed that serum triglycerides might be an independent risk factor for systemic lupus-related kidney injury. High triglycerides correlate with SLE-related kidney injury, The SLE Disease Activity Index 2000 (SLEDAI-2K), urinary casts, blood urea nitrogen level, serum creatinine and proteinuria.25 Thus, the increases of serum lipids may involve in SLE pathogenesis in HFD mice.
Our study found that HFD profoundly influenced the development and progression of SLE autoimmune features in both female and male MRL/lpr mice. In patients with SLE, the most typical form of acute cutaneous lupus (known as cutaneous lupus) is a rash on the face, which generally affects 60%–70% of patients with SLE. In our study, MRL/lpr mice fed with HFD developed skin rashes on the face, ears and back of the neck as early as week 6, resulting in a significantly higher frequency of skin lesions and skin histological score compared with the RD group. In addition, HFD accelerated other characteristic lupus features, including splenomegaly, proteinuria, increased levels of anti-dsDNA antibody and total IgG, and increased kidney index. Male mice with HFD developed more significant and severe lupus features (skin score, proteinuria, nephropathy and anti-dsDNA antibody) than male mice with RD. In contrast, no significant difference was found in female mice in the HFD and RD groups. This phenomenon parallels human lupus in which male patients (10% of patients with lupus) are likelier to have a severe disease (including nephritis) than female patients with lupus, who may have a broader range of lupus symptoms and complications.26 This finding raises the question of whether obesity plus oestrogen may regulate and accelerate lupus in female mice and whether a lack of oestrogen reduces lupus in male mice but does not protect against nephritis. Of note, no difference in glomerular cell proliferation was found between the HFD and RD groups, although the urinary protein levels were significantly elevated from week 11 to week 14 in male HFD mice. In human lupus nephritis, the renal histopathology correlates poorly with the amount of proteinuria, although class V lupus membranous nephropathy typically is associated with the highest level of proteinuria. That is why renal biopsy is performed to determine the precise renal histopathology. In addition, all MRL/lpr mice develop lupus-like disease spontaneously. While we found measurable changes in some features of lupus earlier, the MRL/lpr mice may gradually lead to renal pathology regardless of experimental conditions. As a result, the renal pathology in female mice may be significant in both RD and HFD groups. One may conclude that HFD cannot significantly increase renal disease, which is already advanced or active in the RD group.
Tfh cells help B cells differentiate into antibody-producing plasma cells and memory B cells.10 12 Tfh cells are thought to assist B-cell activation and contribute to autoantibody production and SLE pathogenesis. Our previous data and others have shown that circulating Tfh cells are increased in patients with SLE and correlate with disease severity and plasma cell levels.14 In this study on MRL/lpr mice fed with RD and HFD, spleens in HFD mice were enlarged with increased frequencies of GC-B cells, plasma cells and Tfh cells confirmed by immunofluorescence staining and FACS analysis. Small infiltrating B and T cells in the skin and kidney tissue sections were also observed in both RD and HFD groups (online supplemental figure S5). Treg is known to maintain self-tolerance by suppressing autoreactive lymphocytes and regulating cellular metabolism and glucose homeostasis. Our study did not find a difference in Treg cells between RD-fed and HFD-fed MRL/lpr mice. Taken together, our data on comparing immune cell profiles in RD and HFD mice suggest a possible mechanism by which HFD or obesity may activate GCs, steer the differentiation of CD4+ T cells towards Tfh cells which promote autoantibody production and accelerate lupus autoimmunity with low-grade inflammation in lupus-prone mice. Our results may only reflect partial aspects of the HFD response in lupus. Lupus and obesity might be interconnected through other pathways to induce these immunological dysfunctions in HFD-associated lupus, such as proinflammatory soluble mediators generated by white adipose tissue,27 gut microbiota,28 29 oxidative stress,30 insulin resistance,31 increased body fat percentage and decreased muscle mass,32 oestrogen metabolism33 and vitamin D deficiency.34 Indeed, we found that serum MCP-1 level was significantly higher in the HFD group than the RD group, suggesting MCP-1 may play a role in HFD-associated lupus pathogenesis as observed in human patients with lupus by accelerating atherosclerosis and leading vascular damage (online supplemental figure S6). Thus, the altered T-cell and B-cell dysfunctions in our HFD-associated lupus might be only one of the downstream pathways interconnecting lupus and obesity. The distinct mechanism of how HFD induces or changes the immune milieu in MRL/lpr mice needs further study.
Supplemental material
Supplemental material
In conclusion, our data demonstrate that HFD-induced obesity accelerates lupus progression in MRL/lpr mice; active GCs and Tfh cells may be involved in this process. Our data may suggest, for individual patients genetically predisposed/prone to lupus, that HFD and obesity could have detrimental consequences for initiating, exacerbating and progressing SLE pathogenesis. Recent studies have shown that the immune system, including Tfh cells, promotes gut bacteria colonisation via IgA, which protects against obesity.23 It is tempting to speculate that the mechanism of HFD exacerbates lupus pathogenesis may consist of compositional shifts in gut microbiota via Tfh/GC-B/plasma cell axis and accelerate lupus autoimmunity. Therefore, interventions of a healthy diet or interference of Tfh–GC-B cell interaction may improve both lupus symptoms and outcomes in genetically predisposed individuals with SLE.
Data availability statement
Data are available upon reasonable request. Data may be obtained from a third party and are not publicly available. All data relevant to the study are included in the article or uploaded as supplementary information.
Ethics statements
Patient consent for publication
Ethics approval
Not applicable.
Acknowledgments
The authors gratefully thank Dr Li Li and Dr Courtney Parke for their support and efforts throughout this project, and Kathleen McFadden for manuscript editing. We also thank staff of our animal facility, David Ortiz, Elise Peters, Aileen O’Brien and our vet, Dr David Hesse, for their excellent care and maintenance of animals used in the experiments. We also appreciate the assistance of University of New Orleans students Talon Washington and Lanaisha Farries during Ochsner CURE programme.
References
Supplementary materials
Supplementary Data
This web only file has been produced by the BMJ Publishing Group from an electronic file supplied by the author(s) and has not been edited for content.
Footnotes
Contributors XZ and ZY contributed to the conception and design of the study. JM and XZ grouped the mice and collected samples from the mice. JM, XS and XZ performed the experiments and analysed the data. LH and ANR cut the tissue slides from the blocks of kidney, skin and spleen. RJQ, WD, JZ and CK oversaw the experiments and interpreted the results using their scientific knowledge and experience in patients with SLE. XZ is the major contributor in writing the manuscript and serve as the guarantor. All authors contributed to the acquisition, analysis and interpretation of the data, along with drafting and revising the work, and read and approved the final manuscript.
Funding The authors have not declared a specific grant for this research from any funding agency in the public, commercial or not-for-profit sectors.
Competing interests None declared.
Patient and public involvement Patients and/or the public were not involved in the design, conduct, reporting or dissemination plans of this research.
Provenance and peer review Not commissioned; externally peer reviewed.
Supplemental material This content has been supplied by the author(s). It has not been vetted by BMJ Publishing Group Limited (BMJ) and may not have been peer-reviewed. Any opinions or recommendations discussed are solely those of the author(s) and are not endorsed by BMJ. BMJ disclaims all liability and responsibility arising from any reliance placed on the content. Where the content includes any translated material, BMJ does not warrant the accuracy and reliability of the translations (including but not limited to local regulations, clinical guidelines, terminology, drug names and drug dosages), and is not responsible for any error and/or omissions arising from translation and adaptation or otherwise.